3 - Centre National de Recherches Météorologiques - Météo France
3 - Centre National de Recherches Météorologiques - Météo France
3 - Centre National de Recherches Météorologiques - Météo France

Create successful ePaper yourself
Turn your PDF publications into a flip-book with our unique Google optimized e-Paper software.
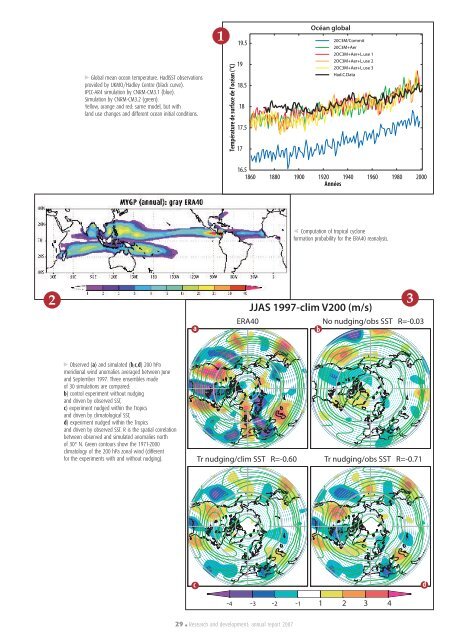
Global mean ocean temperature. HadISST observationsprovi<strong>de</strong>d by UKMO/Hadley <strong>Centre</strong> (black curve).IPCC-AR4 simulation by CNRM-CM3.1 (blue).Simulation by CNRM-CM3.2 (green).Yellow, orange and red: same mo<strong>de</strong>l, but withland use changes and different ocean initial conditions.1Température <strong>de</strong> surface <strong>de</strong> l’océan (°C)19.51918.51817.517Océan global20C3M/Commit20C3M+Aer2OC3M+Aer+L.use 12OC3M+Aer+L.use 22OC3M+Aer+L.use 3Had.C.Data16.51860 1880 1900 1920 1940 1960 1980 2000Années Computation of tropical cycloneformation probability for the ERA40 reanalysis.2 3JJAS 1997-clim V200 (m/s)ERA40No nudging/obs SST R=-0.03ab Observed (a) and simulated (b,c,d) 200 hPameridional wind anomalies averaged between Juneand September 1997. Three ensembles ma<strong>de</strong>of 30 simulations are compared:b) control experiment without nudgingand driven by observed SST,c) experiment nudged within the Tropicsand driven by climatological SST,d) experiment nudged within the Tropicsand driven by observed SST. R is the spatial correlationbetween observed and simulated anomalies northof 30° N. Green contours show the 1971-2000climatology of the 200 hPa zonal wind (differentfor the experiments with and without nudging).Tr nudging/clim SST R=-0.60Tr nudging/obs SST R=-0.71cd-4 -3 -2 -1 1 2 3 429 . Research and <strong>de</strong>velopment: annual report 2007