3 - Centre National de Recherches Météorologiques - Météo France
3 - Centre National de Recherches Météorologiques - Météo France
3 - Centre National de Recherches Météorologiques - Météo France

You also want an ePaper? Increase the reach of your titles
YUMPU automatically turns print PDFs into web optimized ePapers that Google loves.
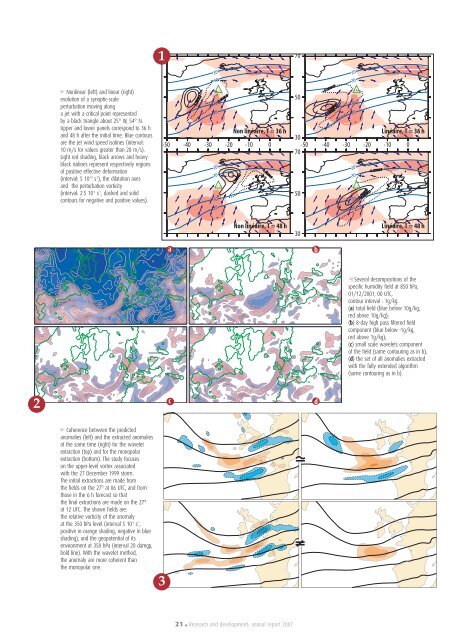
170 Nonlinear (left) and linear (right)evolution of a synoptic-scaleperturbation moving alonga jet with a critical point representedby a black triangle about 25° W, 54° N.Upper and lower panels correspond to 36 hand 48 h after the initial time. Blue contoursare the jet wind speed isolines (interval:10 m/s for values greater than 20 m/s).Light red shading, black arrows and heavyblack isolines represent respectively regionsof positive effective <strong>de</strong>formation(interval: 5 10 -10 s -2 ), the dilatation axesand the perturbation vorticity(interval: 2.5 10 -4 s -1 , dashed and solidcontours for negative and positive values).20303020Non linéaire, T = 36 hLinéaire, T = 36 h30-50 -40 -30 -20 -10 0 -50 -40 -30 -20 -10 0702030302050502030302020303020Non linéaire, T = 48 h30Linéaire, T = 48 hab Several <strong>de</strong>compositions of thespecific humidity field at 850 hPa,01/12/2001, 00 UTC,contour interval : 1g/kg.(a) total field (blue below 10g/kg,red above 10g/kg);(b) 8-day high pass filtered fieldcomponent (blue below -1g/kg,red above 1g/kg);(c) small scale wavelets componentof the field (same contouring as in b),(d) the set of all anomalies extractedwith the fully exten<strong>de</strong>d algorithm(same contouring as in b).2cd Coherence between the predictedanomalies (left) and the extracted anomaliesat the same time (right) for the waveletextraction (top) and for the monopolarextraction (bottom). The study focuseson the upper-level vortex associatedwith the 27 December 1999 storm.The initial extractions are ma<strong>de</strong> fromthe fields on the 27 th at 06 UTC, and fromthose in the 6 h forecast so thatthe final extractions are ma<strong>de</strong> on the 27 that 12 UTC. The shown fields are:the relative vorticity of the anomalyat the 350 hPa level (interval 5 10 -5 s -1 ,positive in orange shading, negative in blueshading), and the geopotential of itsenvironment at 350 hPa (interval 20 damgp,bold line). With the wavelet method,the anomaly are more coherent thanthe monopolar one.321 . Research and <strong>de</strong>velopment: annual report 2007