Final Report - Strategic Environmental Research and Development ...
Final Report - Strategic Environmental Research and Development ...
Final Report - Strategic Environmental Research and Development ...
- No tags were found...

You also want an ePaper? Increase the reach of your titles
YUMPU automatically turns print PDFs into web optimized ePapers that Google loves.
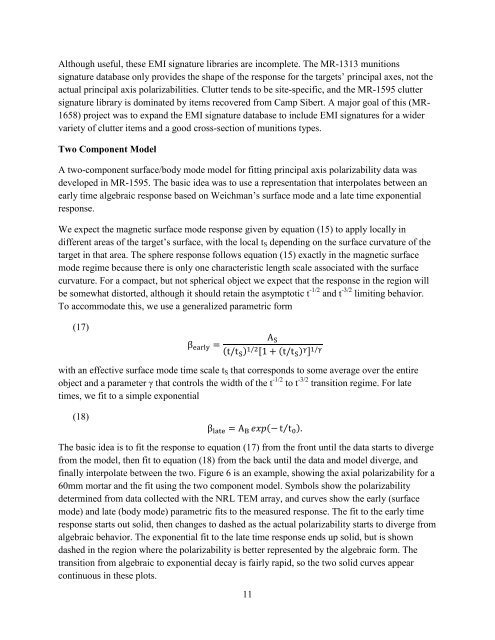
Although useful, these EMI signature libraries are incomplete. The MR-1313 munitionssignature database only provides the shape of the response for the targets’ principal axes, not theactual principal axis polarizabilities. Clutter tends to be site-specific, <strong>and</strong> the MR-1595 cluttersignature library is dominated by items recovered from Camp Sibert. A major goal of this (MR-1658) project was to exp<strong>and</strong> the EMI signature database to include EMI signatures for a widervariety of clutter items <strong>and</strong> a good cross-section of munitions types.Two Component ModelA two-component surface/body mode model for fitting principal axis polarizability data wasdeveloped in MR-1595. The basic idea was to use a representation that interpolates between anearly time algebraic response based on Weichman’s surface mode <strong>and</strong> a late time exponentialresponse.We expect the magnetic surface mode response given by equation (15) to apply locally indifferent areas of the target’s surface, with the local t S depending on the surface curvature of thetarget in that area. The sphere response follows equation (15) exactly in the magnetic surfacemode regime because there is only one characteristic length scale associated with the surfacecurvature. For a compact, but not spherical object we expect that the response in the region willbe somewhat distorted, although it should retain the asymptotic t -1/2 <strong>and</strong> t -3/2 limiting behavior.To accommodate this, we use a generalized parametric form(17)β early =A S(t/t S ) 1/2 [1 + (t/t S ) γ ] 1/γwith an effective surface mode time scale t S that corresponds to some average over the entireobject <strong>and</strong> a parameter γ that controls the width of the t -1/2 to t -3/2 transition regime. For latetimes, we fit to a simple exponential(18)β late = A B exp(− t⁄ t 0 ).The basic idea is to fit the response to equation (17) from the front until the data starts to divergefrom the model, then fit to equation (18) from the back until the data <strong>and</strong> model diverge, <strong>and</strong>finally interpolate between the two. Figure 6 is an example, showing the axial polarizability for a60mm mortar <strong>and</strong> the fit using the two component model. Symbols show the polarizabilitydetermined from data collected with the NRL TEM array, <strong>and</strong> curves show the early (surfacemode) <strong>and</strong> late (body mode) parametric fits to the measured response. The fit to the early timeresponse starts out solid, then changes to dashed as the actual polarizability starts to diverge fromalgebraic behavior. The exponential fit to the late time response ends up solid, but is showndashed in the region where the polarizability is better represented by the algebraic form. Thetransition from algebraic to exponential decay is fairly rapid, so the two solid curves appearcontinuous in these plots.11