DRIVING PERFORMANCE ● ENRICHING LIVES106 <strong>Hemas</strong> <strong>Holdings</strong> PLC Annual Report 2012/13NOTES TO THE FINANCIAL STATEMENTS17 OTHER FINANCIAL ASSETSGroupCompanyOTHER FINANCIAL ASSETS 2013 2012 1 April 2011 2013 2012 1 April 2011Rs.’000 Rs.’000 Rs.’000 Rs.’000 Rs.’000 Rs.’000Available For Sale InvestmentsQuoted Equity Shares (Note 17.1.1) 197,438 74,354 83,065 71,846 74,296 82,976Unquoted Equity Shares (Note 17.1.1) 12,388 10,371 10,215 - - -209,826 84,725 93,280 71,846 74,296 82,976Loans and ReceivablesESOS Receivables (Note 17.1.2) 274,462 274,811 130,881 96,389 93,045 42,255Loans to Company Officers 82,684 65,252 62,694 9,893 8,843 7,350Loans Due from Related Parties (Note 17.2.1) - - - 694,709 404,474 594,272Refundable Deposit 5,094 4,833 3,545 - - -Short Term Investments - 255,963 670,496 - - -362,240 600,859 867,616 800,991 506,362 643,877Held to Maturity InvestmentInvestments in Treasury Bonds - - 49,549 - - -- - 49,549 - - -Total Other <strong>Financial</strong> Assets 572,066 685,584 1,010,445 872,837 580,658 726,853Total Non-Current (Note 17.1) 399,147 324,069 277,255 224,924 229,941 200,231Total Current (Note 17.2) 172,919 361,515 733,190 647,913 350,717 526,622Available For Sale Investment - Quoted Equity SharesThe Company and Group have investments in listed equity securities. The fair value of the quoted equity shares is determined byreference to published price quotations in an active market.Available For Sale Investment - Unquoted Equity SharesThe Group has investments in unquoted equity securities. The fair value of the unquoted equity shares is estimated using appropriatevaluation techniques.Impairment on Available For Sale <strong>Financial</strong> InvestmentsFor Available For Sale financial investments, the Group and Company assess at each reporting date whether there is objective evidencethat an investment or group of investments is impaired. In the case of equity investments classified as Available For Sale, objectiveevidence would include a significant or prolonged decline in the fair value of the investment below its cost. The determination of what is“significant” or prolonged requires judgment. In making this judgment, the Group and Company evaluate, among other factors, historicalshare price movements and the duration or extent to which the fair value of an investment is less than its cost.17.1 Other <strong>Financial</strong> Assets - Non CurrentGroupCompany2013 2012 1 April 2011 2013 2012 1 April 2011Rs.’000 Rs.’000 Rs.’000 Rs.’000 Rs.’000 Rs.’000Investment in Equity Securities - (Note 17.1.1) 209,826 84,725 93,280 71,846 74,296 82,976ESOS Receivables (Note 17.1.2) 184,227 234,511 130,881 78,078 80,645 42,255Loans Due from Related Parties (Note 17.1.3) - - - 75,000 75,000 75,000Refundable Deposits 5,094 4,833 3,545 - - -Investments in Treasury Bonds - - 49,549 - - -399,147 324,069 277,255 224,924 229,941 200,231
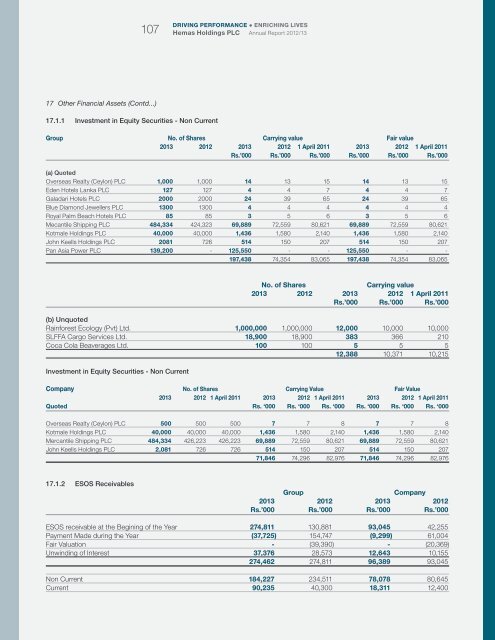
DRIVING PERFORMANCE ● ENRICHING LIVES107 <strong>Hemas</strong> <strong>Holdings</strong> PLC Annual Report 2012/1317 Other <strong>Financial</strong> Assets (Contd...)17.1.1 Investment in Equity Securities - Non CurrentGroup No. of Shares Carrying value Fair value2013 2012 2013 2012 1 April 2011 2013 2012 1 April 2011Rs.’000 Rs.’000 Rs.’000 Rs.’000 Rs.’000 Rs.’000(a) QuotedOverseas Realty (Ceylon) PLC 1,000 1,000 14 13 15 14 13 15Eden Hotels Lanka PLC 127 127 4 4 7 4 4 7Galadari Hotels PLC 2000 2000 24 39 65 24 39 65Blue Diamond Jewellers PLC 1300 1300 4 4 4 4 4 4Royal Palm Beach Hotels PLC 85 85 3 5 6 3 5 6Mecantile Shipping PLC 484,334 424,323 69,889 72,559 80,621 69,889 72,559 80,621Kotmale <strong>Holdings</strong> PLC 40,000 40,000 1,436 1,580 2,140 1,436 1,580 2,140John Keells <strong>Holdings</strong> PLC 2081 726 514 150 207 514 150 207Pan Asia Power PLC 139,200 - 125,550 - - 125,550 - -197,438 74,354 83,065 197,438 74,354 83,065No. of SharesCarrying value2013 2012 2013 2012 1 April 2011Rs.’000 Rs.’000 Rs.’000(b) UnquotedRainforest Ecology (Pvt) <strong>Ltd</strong>. 1,000,000 1,000,000 12,000 10,000 10,000SLFFA Cargo Services <strong>Ltd</strong>. 18,900 18,900 383 366 210Coca Cola Beaverages <strong>Ltd</strong>. 100 100 5 5 512,388 10,371 10,215Investment in Equity Securities - Non CurrentCompany No. of Shares Carrying Value Fair Value2013 2012 1 April 2011 2013 2012 1 April 2011 2013 2012 1 April 2011Quoted Rs. ‘000 Rs. ‘000 Rs. ‘000 Rs. ‘000 Rs. ‘000 Rs. ‘000Overseas Realty (Ceylon) PLC 500 500 500 7 7 8 7 7 8Kotmale <strong>Holdings</strong> PLC 40,000 40,000 40,000 1,436 1,580 2,140 1,436 1,580 2,140Mercantile Shipping PLC 484,334 426,223 426,223 69,889 72,559 80,621 69,889 72,559 80,621John Keells <strong>Holdings</strong> PLC 2,081 726 726 514 150 207 514 150 20771,846 74,296 82,976 71,846 74,296 82,97617.1.2 ESOS ReceivablesGroupCompany2013 2012 2013 2012Rs.’000 Rs.’000 Rs.’000 Rs.’000ESOS receivable at the Begining of the Year 274,811 130,881 93,045 42,255Payment Made during the Year (37,725) 154,747 (9,299) 61,004Fair Valuation - (39,390) - (20,369)Unwinding of Interest 37,376 28,573 12,643 10,155274,462 274,811 96,389 93,045Non Current 184,227 234,511 78,078 80,645Current 90,235 40,300 18,311 12,400