Behrman Capital - Preqin
Behrman Capital - Preqin
Behrman Capital - Preqin

Create successful ePaper yourself
Turn your PDF publications into a flip-book with our unique Google optimized e-Paper software.
The 2007 Performance Monitor<br />
The 2007 Private Equity<br />
Performance Monitor<br />
© 2007 Private Equity Intelligence Ltd 1
Contents:<br />
Figure Index<br />
1. Executive Summary<br />
2. Methodology<br />
3. Top-Line Performance of Private Equity<br />
- Universe of Funds<br />
- DPI, RVPI and TVPI<br />
- Median IRRs, Money Weighted IRRs and Pooled IRRs<br />
- Performance by Geographic Region<br />
- Relationship between Predecessor and Successor Fund Quartile<br />
- Experience Effect<br />
4. Performance by Fund Type<br />
Buyout<br />
- DPI, RVPI and TVPI<br />
- Net IRR Dispersion and Quartile Ranking<br />
- Median, Weighted and Pooled IRRs<br />
- North American vs. European Buyout funds<br />
- Large and Mega Buyout funds<br />
- Buyout Cash Flow Analysis<br />
- Buyout Net Cash Flow by Vintage Year<br />
- Relationship between Successor and Predecessor Fund Quartile<br />
Distressed Debt & Special Situation<br />
- DPI, RVPI and TVPI<br />
- Median IRR<br />
7<br />
11<br />
17<br />
25<br />
35<br />
36<br />
44<br />
Contents<br />
Fund of Funds<br />
- DPI, RVPI and TVPI<br />
- Median and Money Weighted IRR<br />
- Fund Selection Performance<br />
- Relationship between Successor and Predecessor Fund<br />
Mezzanine<br />
- DPI, RVPI and TVPI<br />
- Median and Money Weighted IRR<br />
- Quartile Ranking by Fund Number<br />
Real Estate<br />
- DPI, RVPI and TVPI<br />
- Median IRR<br />
- Relationship between Successor and Predecessor Fund<br />
Secondaries<br />
- DPI, RVPI and TVPI<br />
- Median IRR<br />
Venture<br />
- DPI, RVPI and TVPI<br />
- Net IRR Dispersion and Quartile Ranking<br />
- Median, Weighted and Pooled IRRs<br />
- Performance of Early Stage Funds<br />
- Performance of Venture Funds by Industry Focus<br />
- Venture Cash Flow Analysis<br />
- Venture Cash Flow by Vintage<br />
- Relationship between Successor and Predecessor Fund Quartile<br />
© 2007 Private Equity Intelligence Ltd 5<br />
46<br />
50<br />
52<br />
54<br />
56
6<br />
The 2007 Performance Monitor<br />
5. Listed Funds<br />
- Introduction<br />
- Overview of Listed Private Equity<br />
- Listed Private Equity vs Other Listed Stocks<br />
- Private Equity: Listed vs Unlisted<br />
- Role of Listed Private Equity<br />
6. Risk and Investment Selection<br />
- Introduction<br />
- Fund Selection Risk<br />
- Buyout vs Venture: A 20 Year Comparison<br />
- Variation of Risk with Fund Size<br />
- Conclusion<br />
- Performance of Listed Private Equity<br />
7. Consistent Performers<br />
8. Firm and Fund Listing<br />
- Detailed listing for 1,000 private equity firms including background,<br />
fund performance and fund quartile rankings<br />
63<br />
77<br />
87<br />
95<br />
9. Market Benchmarks<br />
- Buyout All<br />
- Buyout US<br />
- Buyout Europe<br />
- Early Stage<br />
- Fund of Funds<br />
- Mezzanine<br />
- Real Estate<br />
- Venture All<br />
- Venture US<br />
- Venture Europe<br />
10. Firm Index<br />
11. Glossary<br />
477<br />
489<br />
505<br />
© 2007 Private Equity Intelligence Ltd
Figure Index:<br />
Fig. 1: No. of Funds by Type and Vintage Year 27<br />
Fig. 2: Value of Funds by Type and Vintage Year 28<br />
Fig. 3: All Private Equity: DPI, RVPI and TVPI 29<br />
Fig. 4: All Private Equity: Median, Money Weighted and Pooled IRR 30<br />
Fig. 5: All Private Equity: Median Net IRR by Region Focus 31<br />
Fig. 6: All Private Equity: Relationship between Predecessor and Successor Fund Quartile 32<br />
Fig. 7: All Private Equity: Quartile Ranking by Fund Number 33<br />
Fig. 8: Buyout: DPI, RVPI and TVPI 36<br />
Fig. 9: Buyout: Net IRR Dispersion 37<br />
Fig. 10: Buyout: Median, Money Weighted and Pooled IRR 38<br />
Fig. 11: Buyout: Net Median IRR US vs. Europe 38<br />
Fig. 12: Largest Third of Buyout Funds vs. All other Buyouts 39<br />
Fig. 13: GPs Managing Mega Buyout Funds vs. Buyout Median IRR 39<br />
Fig. 14: Buyout: Yearly Contribution and Distribution with Net Cash Flow 40<br />
Fig. 15: Buyout: Cumulative Contribution and Distribution, Remaining Value and Value Multiple 41<br />
Fig. 16: Buyout: Net Cash Flow by Vintage Year 42<br />
Fig. 17: Buyout: Relationship between Predecessor and Successor Fund Quartile 43<br />
Fig. 18: Distressed Debt and General Special Situation: DPI, RVPI and TVPI 44<br />
Fig. 19: Distressed Debt and General Special Situation: Median Net IRR 45<br />
Fig. 20: Fund of Funds: DPI, RVPI and TVPI 46<br />
Fig. 21: Fund of Funds: Median and Money Weighted IRR 47<br />
Fig. 22: Quartile Ranking of Partnership Investments made by Fund of Funds Managers 48<br />
Fig. 23: Top 15 Fund of Funds Managers by Average underlying Fund Quartile 48<br />
Fig. 24: Fund of Funds: Relationship between Predecessor and Successor Fund Quartile 49<br />
Fig. 25: Mezzanine: DPI, RVPI and TVPI 50<br />
Fig. 26: Mezzanine: Median and Money Weighted IRR 51<br />
Fig. 27: Mezzanine: Quartile Ranking by Fund Number 51<br />
Fig. 28: Real Estate: DPI, RVPI and TVPI 52<br />
The 2007 Performance Monitor<br />
© 2007 Private Equity Intelligence Ltd 7
8<br />
The 2007 Performance Monitor<br />
Fig. 29: Real Estate: Median IRR 53<br />
Fig. 30: Real Estate: Relationship between Predecessor and Successor Fund Quartile 53<br />
Fig. 31: Secondaries: DPI, RVPI and TVPI 54<br />
Fig. 32: Secondaries: Median IRR 55<br />
Fig. 33: Venture: DPI, RVPI and TVPI 56<br />
Fig. 34: Venture: Net IRR Dispersion 56<br />
Fig. 35: Venture: Median, Money Weighted and Pooled IRR 57<br />
Fig. 36: Early Stage vs. All Venture 58<br />
Fig. 37: Healthcare and IT focused Funds vs. General venture 58<br />
Fig. 38: Venture: Yearly Contribution and Distribution with Net Cash Flow 59<br />
Fig. 39: Venture: Net Cash Flow by Vintage Year 60<br />
Fig. 40: Venture: Relationship between Predecessor and Successor Fund Quartile 61<br />
Fig. 41: Regional Location of Listing for Listed Private Equity Funds 65<br />
Fig. 42: Market <strong>Capital</strong>ization of Listed Private Equity (1993 - 2006) 66<br />
Fig. 43: Return of LPX vs Selected Global Incides (Dec 1993 - Dec 2006) 67<br />
Fig. 44: Risk of LPX vs selected Global Incides (1993 - 2006) 68<br />
Fig. 45: Sharpe Ratio of LPX vs selected Global Incides (1993 - 2006) 68<br />
Fig. 46: Risk, Return and Sharpe Ratio of LPX vs selected Global Indices (1993 - 2006) 68<br />
Fig. 47: LPX50 Annualised Return vs. <strong>Preqin</strong> All Private Equity Money Weighted IRR 70<br />
Fig. 48: Risk vs Return by Fund Strategy (1993-2004) 79<br />
Fig. 49: Risk vs Return by Fund Strategy and Vintage (1993-2004) 80<br />
Fig. 50: IRR Distributions by Fund Strategy 82<br />
Fig. 51: Buyout vs Venture - 20 Year Risk Comparison 83<br />
Fig. 52: Buyout vs Venture - 20 Year Return Comparison 83<br />
Fig. 53: Risk and Return by Fund Size - Buyout 84<br />
Fig. 54: Risk and Return by Fund Size - Venture 85<br />
Fig. 55: Risk and Return by Fund Size - Vintage 2000 Buyout 85<br />
© 2007 Private Equity Intelligence Ltd
Private equity’s rapid growth has continued over the<br />
past year, with total equity assets under<br />
management globally now $1.4 trillion. It is therefore<br />
fitting that the 2007 edition of the Private Equity<br />
Performance Monitor is based upon the largest ever<br />
sample of funds, with net returns data for over 3,400<br />
private equity funds of all types.<br />
A History of Superior Returns<br />
The industry’s growth has been driven by its<br />
investment performance, and the resulting LP<br />
appetite for greater allocations. Despite this, debate<br />
continues in academic and financial circles as to how<br />
LPs’ private equity returns compare with those from<br />
listed equities. Part of the debate is clearly<br />
generated by the challenges of comparing a long<br />
term, illiquid investment like private equity with listed<br />
stocks. However, at <strong>Preqin</strong> we believe that the data<br />
points to a clear and unambiguous conclusion:<br />
investors’ returns from private equity have far<br />
exceeded the stockmarket.<br />
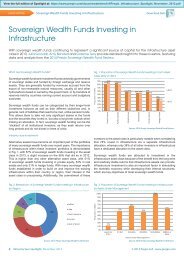
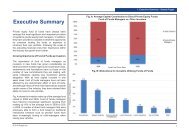
The most direct comparison is to compare listed<br />
private equity with other listed stocks. Although only<br />
Index Return - Rebased to Dec 1993<br />
a small proportion of private equity investment<br />
vehicles are listed (perhaps 5% of the total), they<br />
nevertheless now have an aggregate capitalization<br />
of around EUR 85 billion, and Swiss company LPX<br />
has created a family of indices to track their<br />
performance. These indices – in particular the<br />
flagship LPX50 - demonstrate that total returns from<br />
listed private equity have been good compared to<br />
returns from other leading indices (see Fig. A),<br />
whether measured on an absolute or risk adjusted<br />
basis.<br />
1000<br />
900<br />
800<br />
700<br />
600<br />
500<br />
400<br />
300<br />
200<br />
100<br />
0<br />
Fig. A: Return of LPX vs Selected Global Incides (Dec 1993 - Dec 2006)<br />
Executive Summary<br />
1993 1994 1995 1996 1997 1998 1999 2000 2001 2002 2003 2004 2005 2006<br />
MSCI World TR<br />
Source:LPX (www.lpx.ch)<br />
NASDAQ TR FTSE All Share TR LPX 50 TR<br />
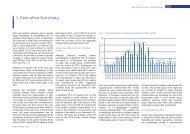
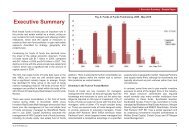
Most private equity investments are, of course,<br />
made through limited partnerships, not listed<br />
vehicles. <strong>Preqin</strong> compared the performance of<br />
these limited partnerships with listed private equity<br />
investments on the basis of IRRs from inception to<br />
date. Our total sample of limited partnerships now<br />
includes net returns data for more than 3,400 private<br />
equity funds of all types and sizes globally,<br />
accounting for just over 70% of the total universe of<br />
private equity funds by value. The money-weighted<br />
benchmark gives the best estimate of the returns<br />
© 2007 Private Equity Intelligence Ltd 13
The 2007 Performance Monitor<br />
that an LP is likely to earn on a well-diversified<br />
portfolio of fund interests, and this was compared<br />
with the cumulative return from the LPX over the<br />
same period. The results are shown in Fig. B, with<br />
returns from limited partnerships generally<br />
exceeding those from listed private equity by a<br />
significant 5 – 10% per annum in most years. (The<br />
unlisted benchmark lags a year or so behind the<br />
LPX50 for the simple reason that partnership<br />
investments are made over a period of years. The<br />
most recent vintage years are also affected by the<br />
well known J-curve.)<br />
The conclusions are clear: investment in private<br />
equity limited partnerships has delivered better<br />
returns than listed private equity, which in turn has<br />
done very well in comparison with other listed<br />
stocks.<br />
Performance Persistence and Manager Selection<br />
Average returns are only part of the story, however.<br />
The most successful LPs manage to consistently<br />
earn superior returns by investing with the best<br />
14<br />
private equity firms. Their success hinges on two<br />
factors unique to the private equity asset class:<br />
� Dispersion of returns: the gap between<br />
the best private equity funds and the rest is huge,<br />
around 10% per year between the median and<br />
first / third quartiles. In other words, a fund<br />
needs to beat the median return by at least 10%<br />
per year to make it into the first quartile, or to fall<br />
short by 10% per year to fall into the bottom<br />
quartile. The leverage from choosing the right<br />
Net IRR (%)<br />
30<br />
25<br />
20<br />
15<br />
10<br />
5<br />
0<br />
-5<br />
funds – or the penalty for choosing the wrong<br />
ones – is large.<br />
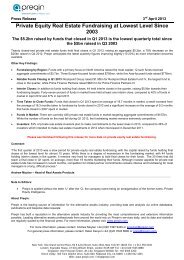
� Persistence of returns: not only is the gap<br />
between the best funds and the rest very high,<br />
but these differences tend to persist over time.<br />
<strong>Preqin</strong> analyzed the odds on a firm’s next fund<br />
being Q1 / Q2 / etc. based upon the performance<br />
of the firm’s current fund. There is a consistent<br />
pattern across all types of private equity fund,<br />
including fund of funds: the best firms are<br />
Fig. B: LPX50 Annualised Return vs. <strong>Preqin</strong> All Private Equity Money Weighted IRR<br />
1995 1996 1997 1998 1999 2000 2001 2002 2003 2004<br />
Source:LPX (www.lpx.ch) & <strong>Preqin</strong> Performance Analyst<br />
LPX 50 Annual Return<br />
Money Weighted <strong>Preqin</strong><br />
IRR<br />
© 2007 Private Equity Intelligence Ltd
emarkably consistent in their ability to produce<br />
superior performance fund after fund.<br />
Conversely, it is quite unlikely for a firm whose<br />
current fund is performing poorly to turn this<br />
around to a Q1 performance next time. (See Fig.<br />
C)<br />
In conclusion, private equity has delivered excellent<br />
net returns to its investors, and continues to do so.<br />
LPs’ target allocations are growing, and new<br />
investors continue to enter the asset class. Effective<br />
manager selection is vital for success, and the track<br />
record of funds and firms is therefore a necessary<br />
ingredient of LPs’ planning and due diligence.<br />
Executive Summary<br />
Fig. C: All Private Equity - Relationship between Predecessor and Successor Fund Quartile<br />
100%<br />
75%<br />
50%<br />
25%<br />
0%<br />
11% 14% 23% 35%<br />
17%<br />
29%<br />
43%<br />
© 2007 Private Equity Intelligence Ltd 15<br />
26%<br />
31%<br />
29%<br />
Q1 Predecessor Fund Q2 Predecessor Fund Q3 Predecessor Fund Q4 Predecessor Fund<br />
29%<br />
25%<br />
23%<br />
24%<br />
24%<br />
16%<br />
Q4 Successor Fund<br />
Q3 Successor Fund<br />
Q2 Successor Fund<br />
Q1 Successor Fund
22<br />
The 2007 Performance Monitor<br />
Background Information:<br />
Brief description of firm and<br />
focus, including contact details,<br />
year of establishment and total<br />
funds raised to date or assets<br />
under management (AUM).<br />
General Venture Partners Established: 1979 www.internetaddress.com Tel: +1 234 567 8910<br />
123 ABC Street, New York, NY 10152, US Funds Raised (mn): 1,605 USD info@internetaddress.com Fax: +1 234 567 8911<br />
General Venture Partners (GVP) was established to provide equity financing and assistance to the management of young, information<br />
Quartile Analysis<br />
technology companies. It seeks situations where the combination of ideas, dollars, experience, and relationships can create long-term,<br />
sustainable value. At present, it has over USD 1,400 million in assets under management. Its target range for new investments is between Q1 Q2 Q3<br />
USD 100,000 and 10 million.<br />
1 2 0<br />
Q4<br />
2<br />
NR<br />
0<br />
Fund Vintage Size (mn) Type Called Distributed Rem. Multiple Net IRR Benchmark Quartile Date<br />
(%) (%) Value (%) (X) (%) (%)<br />
Reported<br />
General Venture Partners I 1992 25 USD Venture 100.0 151.3 4.3 1.56 13.6 23.6 2 31-Dec-06<br />
General Venture Partners II 1996 105 USD Venture 100.0 151.0 11.2 1.62 16.6 22.5 2 31-Dec-06<br />
General Venture Partners III 1998 175 USD Venture 100.0 22.5 23.1 0.46 -20.2 -4.1 4 31-Dec-06<br />
General Venture Partners VI 1999 500 USD Venture 92.5 2.6 20.2 0.23 -29.7 -11.8 4 31-Dec-06<br />
General Venture Partners V 2001 800 USD Venture 48.0 18.8 82.1 1.01 0.6 -8.0 1 31-Dec-06<br />
Called %:<br />
Percentage of LP’s<br />
commitments called to<br />
date.<br />
�. e.g. LP with $ 1 mn<br />
commitment will have<br />
had $ 480k called.<br />
Distribution %:<br />
Distributions to date as<br />
percentage of called<br />
capital.<br />
�. e.g. LP with $ 1 mn<br />
commitment has had<br />
distributions of $ 90k -<br />
which is 18.8% of the<br />
$ 480k called.<br />
Quartile Analysis:<br />
A brief summary of the firm’s track<br />
record.<br />
�. e.g. in this case, 2 funds are<br />
4th quartile, 2 are 2nd quartile and<br />
1 is 1st quartile.<br />
Value %:<br />
Valuation of unrealized<br />
investments as<br />
percentage of called<br />
capital.<br />
�. e.g. LP with $ 1 mn<br />
commitment has<br />
unrealized capital valued<br />
at $ 394 - which is 82.1%<br />
of the $ 480k called.<br />
Quartile Ranking:<br />
This shows which quartile of the<br />
relevant peer group the fund falls<br />
into. We put equal weight on IRR<br />
and value multiple.<br />
�. e.g. in this case 2001 US<br />
venture funds.<br />
Multiple:<br />
Distributions plus<br />
unrealized value.<br />
�. e.g. in this case 1.01<br />
- which is 18.8% +<br />
82.1%<br />
Net IRR %:<br />
The net IRR earned by<br />
the LP to date.<br />
�. e.g. in this case<br />
0.6%, counting both<br />
distributions and<br />
unrealized value.<br />
Date Reported:<br />
This is the ‘as at’ date for<br />
the valuations and<br />
performance.<br />
�. e.g. in this case the data<br />
is as of 31-Dec-2006<br />
Benchmark IRR %:<br />
The median IRR for the<br />
relevant peer group.<br />
�. e.g. in this case<br />
2001, US venture funds.<br />
© 2007 Private Equity Intelligence Ltd
the LP’s net position will be minus $5.2 million. As<br />
distributions exceed contributions after this point, the<br />
LP’s maximum net investment will therefore have<br />
been $5.2 million – i.e. around 52% of its original<br />
commitment. This 52% is a lower figure than many<br />
LPs typically use in forecasting their portfolio cash<br />
flows, and suggests that some LPs should be<br />
considering higher levels of ‘over-commitment’ in<br />
order to achieve their desired target allocations.<br />
Distributions continue to grow and reach a maximum<br />
around year seven, by which time the LP’s<br />
($mn)<br />
cumulative cash flow will just be turning positive. By<br />
year eleven the average buyout fund will have<br />
returned a net cash multiple of around 1.47 in<br />
addition to still having a remaining unrealized<br />
portfolio value of around 20% of the paid-in capital.<br />
Fig 15 shows the same cash flow data but<br />
expressed cumulatively. The remaining value of the<br />
unrealised investments is also represented on the<br />
graph. During the first four years of the fund life the<br />
unrealised value is increasing rapidly. Between<br />
years four to six the value is also rising but at a much<br />
Fig. 15: Buyout - Cumulative Contribution and Distribution, Remaining Value and Value Multiple<br />
(LP with 10mn Commitment)<br />
18<br />
16<br />
14<br />
12<br />
10<br />
8<br />
6<br />
4<br />
2<br />
0<br />
1 2 3 4 5 6 7 8 9 10 11<br />
Investment year<br />
Cumulative Contribution Cumulative Distribution Remaining Value Value Multiple<br />
© 2007 Private Equity Intelligence Ltd 41<br />
Buyout<br />
slower rate. After year six, the unrealised value is<br />
then decreasing but is still at a relatively high level<br />
even at year eleven, where it still represents<br />
approximately 20% of the value of an investors paidin<br />
capital. Analysing the value multiple, the sum of<br />
unrealised value and distributions, it is interesting to<br />
note that as early as the third investment year of a<br />
typical fund the value multiple is exceeding<br />
cumulative contributions. This means that taking the<br />
remaining value into account, an LP will have<br />
reached a break-even on its investment in the third<br />
year and will start to generate a return on investment<br />
in subsequent years.<br />
Buyout Net Cash Flow by Vintage Year<br />
The above analysis is based upon the annualised<br />
transactions for each investment year regardless of<br />
fund vintages. The buyout industry is dynamic and<br />
evolving with time and is continually affected by<br />
general investment conditions. Annualised cash flow<br />
data reflects the intrinsic characteristics of buyouts<br />
but it does not give a true picture of the current<br />
trends and transitions of this fast changing industry.<br />
This can be done by analysing the net cash flows<br />
generated by buyouts for different vintage years. The
Net IRR Dispersion and Quartile Ranking<br />
Fig. 34 shows the dispersion of net IRRs generated<br />
by venture funds for vintage years 1980 to 2004,<br />
also showing the boundaries between different<br />
quartiles. One of the most notable features of this<br />
graph is the extremely high performance achieved<br />
by some venture funds of vintage years 1995 to<br />
1998. A few of the outstanding funds of this era<br />
include the AMWIN Innovation fund managed by<br />
CHAMP ventures based in Australia with a net IRR<br />
of 1,047%, Matrix Partners Fund V which has<br />
produced a net IRR of 515%, and Crescendo<br />
Ventures from 1995 with an IRR of 447%. Please<br />
Net IRR (%) Since inception<br />
70<br />
60<br />
50<br />
40<br />
30<br />
20<br />
10<br />
0<br />
-10<br />
-20<br />
note these three funds have been excluded from the<br />
chart to maintain its clarity.<br />
Such high returns would have perhaps not been<br />
possible were it not for the market conditions created<br />
by the dot-com bubble, which saw Internet based<br />
companies achieving huge valuations leading to<br />
substantial profits for their investors through IPOs.<br />
However, although some venture funds did benefit<br />
from the bubble, many suffered as a result of the<br />
subsequent crash in valuations of technology<br />
companies. Many venture funds now find<br />
themselves with dot-com companies in their<br />
portfolios which may never produce a return on their<br />
Fig. 35: Venture: Median, Money Weighted and Pooled IRR<br />
1993 1994 1995 1996 1997 1998 1999 2000 2001 2002 2003 2004<br />
Vintage Year<br />
Median IRR Money Weighted IRR Pooled IRR<br />
initial investment.<br />
Median, Weighted and Pooled IRRs<br />
© 2007 Private Equity Intelligence Ltd 57<br />
Venture<br />
Figure 35 shows the median, weighted and pooled<br />
IRRs for the venture capital industry for the vintages<br />
1993 to 2004. All three benchmarks correlate fairly<br />
closely with each other, although for funds of pre-<br />
1998 vintage both pooled and weighted IRRs were<br />
much higher than the median IRR. Funds of vintages<br />
between 1993 and 1997 produced excellent returns,<br />
with median IRRs of around 20% and Pooled IRRs<br />
in the region of 40%.<br />
Following the crash of the technology market the<br />
three benchmarks drop into negative territory, with<br />
funds of vintage 1997 to 1999 the worst affected.<br />
From 1999 the three benchmarks are very low,<br />
meaning that funds of this vintage have delivered<br />
negative returns or returns very close to 0%.<br />
Even though the performance is still relatively poor,<br />
there is a clear continuous improvement in the IRRs<br />
generated by venture funds of vintage 1999 to 2004.<br />
Starting in 1999 at around -10% both pooled and<br />
median IRRs constantly improved, with funds of<br />
more recent vintage years reaching positive territory.
Firm Listings<br />
Bear Stearns Merchant Banking Established: 1997 www.bsmb.com Tel: +1 212 272 7425<br />
383 Madison Avenue, 40th Floor, New York, NY 10179, US Funds Raised (mn): 4,400 USD merchantbanking@bear.com<br />
Bear Stearns Merchant Banking (BSMB), the private equity arm of Bear, Stearns & Co., invests private equity capital in leveraged buyouts,<br />
recapitalizations and growth capital opportunities. Bear Stearns Merchant Banking is committed to growing its private equity capabilities into<br />
a core business by both investing additional firm capital and raising external private equity funds. It actively pursues investments in the US<br />
and across the globe.<br />
Fund Vintage Size (mn) Type<br />
Called<br />
(%)<br />
Distributed<br />
(%)<br />
Rem. Value<br />
(%)<br />
Quartile Analysis<br />
Q1 Q2 Q3 Q4 NR<br />
1 1 0 0 1<br />
© 2007 Private Equity Intelligence Ltd 139<br />
Multiple<br />
(X)<br />
Net IRR<br />
(%)<br />
Benchmark<br />
(%)<br />
Quartile<br />
Date<br />
Reported<br />
Bear Stearns Merchant Banking I 1998 200 USD Buyout 81.0 42.1 122.4 1.64 26.5 8.4 1 30-Mar-06<br />
Bear Stearns Merchant Banking II 2000 1,500 USD Buyout 95.1 62.2 73.1 1.35 15.5 14.3 2 30-Sep-06<br />
Bear Stearns Merchant Banking III 2006 2,700 USD Buyout 1.1 0.0 27.3 0.27 n/m n/m - 30-Sep-06<br />
<strong>Behrman</strong> <strong>Capital</strong> Established: 1992 www.behrmancap.com Tel: +1 212 980 6500<br />
126 East 56th Street, New York, NY 10022, US Funds Raised (mn): 1,810 USD info@behrmancap.com Fax: +1 212 980 7024<br />
<strong>Behrman</strong> <strong>Capital</strong> is a private equity investment firm founded in New York in 1992 by brothers Grant G. <strong>Behrman</strong> and Darryl G. <strong>Behrman</strong><br />
<strong>Capital</strong> invests in management buyouts, leveraged buildups and recapitalizations of established growth companies and makes minority<br />
investments in emerging growth companies. Investments have historically been focused in the IT, outsourcing, business services and<br />
contract manufacturing industries, however the firm will consider a variety of related industries that provide opportunities for internal or<br />
external growth.<br />
Fund Vintage Size (mn) Type<br />
Called<br />
(%)<br />
Distributed<br />
(%)<br />
Rem. Value<br />
(%)<br />
Quartile Analysis<br />
Q1 Q2 Q3 Q4 NR<br />
0 1 3 0 0<br />
Multiple<br />
(X)<br />
Net IRR<br />
(%)<br />
Benchmark<br />
(%)<br />
Quartile<br />
Date<br />
Reported<br />
<strong>Behrman</strong> <strong>Capital</strong> Partners 1993 67 USD Buyout 100.0 179.0 0.5 1.80 19.8 20.1 3 31-Dec-06<br />
<strong>Behrman</strong> <strong>Capital</strong> B 1995 56 USD Buyout 100.0 133.0 2.4 1.35 9.8 9.9 3 30-Sep-06<br />
<strong>Behrman</strong> <strong>Capital</strong> Partners II 1998 518 USD Buyout 97.4 63.9 42.5 1.06 1.2 8.4 3 30-Sep-06<br />
<strong>Behrman</strong> <strong>Capital</strong> Partners III 2000 1,200 USD Buyout 75.6 44.4 99.2 1.44 11.7 14.3 2 30-Sep-06<br />
Belvedere <strong>Capital</strong> Partners Established: 1997 www.belvederecapital.com Tel: +1 415 434 1236<br />
One Maritime Plaza, Suite 825, San Francisco, CA 94111, US Funds Raised (mn): 300 USD Fax: +1 415 434 9918<br />
Belvedere <strong>Capital</strong> Partners is a private equity investment firm specializing in financial services. Belvedere’s investment activity to date has<br />
focused on California community banks.<br />
Fund Vintage Size (mn) Type<br />
Called<br />
(%)<br />
Distributed<br />
(%)<br />
Rem. Value<br />
(%)<br />
Quartile Analysis<br />
Q1 Q2 Q3 Q4 NR<br />
1 0 0 0 1<br />
Multiple<br />
(X)<br />
Net IRR<br />
(%)<br />
Benchmark<br />
(%)<br />
Quartile<br />
Date<br />
Reported<br />
California Community Financial Institutions Fund 1997 160 USD Buyout 101.5 170.6 0.4 1.71 9.5 5.2 1 30-Sep-06<br />
Belvedere <strong>Capital</strong> Fund II 2005 150 USD Buyout 26.5 19.3 77.1 0.96 n/m n/m - 30-Sep-06
The 2007 Performance Monitor<br />
Triumph <strong>Capital</strong> Group Established: 1990 www.triumphcapital.com<br />
28 State Street, 37th Floor, Boston, MA 02109, US Funds Raised (mn): 896 USD<br />
Triumph <strong>Capital</strong> Group is a diversified investment management firm specializing in private equity and high yield debt. The firm employs 15<br />
professionals in Boston, Hartford, San Francisco and West Palm Beach.<br />
Fund Vintage Size (mn) Type<br />
444<br />
Called<br />
(%)<br />
Distributed<br />
(%)<br />
Rem. Value<br />
(%)<br />
Quartile Analysis<br />
Q1 Q2 Q3 Q4 NR<br />
0 0 1 3 0<br />
Multiple<br />
(X)<br />
Net IRR<br />
(%)<br />
Benchmark<br />
(%)<br />
Quartile<br />
Date<br />
Reported<br />
Triumph Connecticut 1993 129 USD Buyout 100.0 106.9 0.0 1.07 2.7 20.1 4 31-Dec-06<br />
Triumph California 1995 71 USD Buyout 115.5 118.7 0.0 1.19 5.3 9.9 3 31-Dec-06<br />
Washington & Congress <strong>Capital</strong> Partners 1998 609 USD Mezzanine 99.5 88.6 19.7 1.08 1.9 7.0 4 30-Jun-06<br />
Triumph <strong>Capital</strong> Investors II 1999 87 USD Buyout 100.0 41.6 0.0 0.42 -25.1 8.2 4 31-Mar-06<br />
Trivest Partners Established: 1981 www.trivest.com Tel: +1 305 858 2200<br />
2665 South Bayshore Drive, Suite 800, Miami, FL 33133-5462, US Funds Raised (mn): 600 USD info@trivest.com Fax: +1 305 285 0102<br />
Trivest is a leading provider of equity for middle market corporate acquisitions, recapitalizations, and growth capital financings. Trivest<br />
prefers to invest in companies valued up to USD 350 million which possess market positions in growing or fragmented industries. Trivest<br />
pursues investment opportunities on a national basis, however, due to its geographic location in the Southeast and historic ties to the<br />
Midwest, the firm has an especially strong presence in these two geographic regions.<br />
Fund Vintage Size (mn) Type<br />
Called<br />
(%)<br />
Distributed<br />
(%)<br />
Rem. Value<br />
(%)<br />
Quartile Analysis<br />
Q1 Q2 Q3 Q4 NR<br />
0 0 1 0 0<br />
Multiple<br />
(X)<br />
Net IRR<br />
(%)<br />
Benchmark<br />
(%)<br />
Quartile<br />
Date<br />
Reported<br />
Trivest Fund II 1996 210 USD Buyout 98.2 40.7 58.4 0.99 7.2 3 31-Mar-06<br />
Troika Dialog Asset Management Established: 1996 www.am.troika.ru Tel: +7 495 258 05 34<br />
4, Romanov Pereulok, Moscow 125 009, Russia Funds Raised (mn): 218 USD Fax: +7 495 258 05 36<br />
Founded in 1996, Troika Dialog Asset Management (TDAM) is one of the Troika Dialog Group of Companies. TDAM is one of the largest<br />
independent companies on the asset management market. The company has four open-end mutual funds, two interval funds and one<br />
closed-end real estate fund (Commercial Real Estate).<br />
Fund Vintage Size (mn) Type<br />
Called<br />
(%)<br />
Distributed<br />
(%)<br />
Rem. Value<br />
(%)<br />
Quartile Analysis<br />
Q1 Q2 Q3 Q4 NR<br />
0 0 0 0 1<br />
Multiple<br />
(X)<br />
Net IRR<br />
(%)<br />
Benchmark<br />
(%)<br />
Quartile<br />
Date<br />
Reported<br />
Russia New Growth Fund 2006 218 USD Buyout 24.8 0.0 100.0 1.00 n/m n/m - 31-Dec-06<br />
© 2007 Private Equity Intelligence Ltd
Fund Type: Buyout<br />
Geographic Focus: All Regions<br />
Benchmark Type: Median<br />
Market Benchmarks<br />
Median Fund IRR Quartiles IRR Max/Min Multiple Quartiles<br />
Vintage Number of Funds Called(%) Dist(%) DPI Value(%) RVPI Q1 Median Q3 Max Min Q1 Median Q3<br />
2006 57 9.4 0.0 89.0 n/m n/m n/m n/m n/m n/m n/m n/m<br />
2005 92 28.0 0.0 94.2 n/m n/m n/m n/m n/m n/m n/m n/m<br />
2004 53 45.7 2.3 100.7 32.1 20.9 -1.5 101.0 -28.5 1.36 1.14 0.92<br />
2003 44 57.2 24.3 89.9 33.2 16.2 2.5 65.2 -48.7 1.46 1.20 0.88<br />
2002 56 78.4 36.6 88.2 26.8 16.7 7.6 78.3 -69.0 1.58 1.23 1.06<br />
2001 46 83.1 74.7 82.1 36.3 24.4 14.5 109.9 -14.6 2.09 1.56 1.19<br />
2000 85 90.0 71.9 64.6 21.7 15.4 7.9 55.5 -19.5 1.74 1.44 1.21<br />
1999 67 93.9 83.5 47.7 19.0 9.8 0.4 33.6 -31.4 1.80 1.41 1.01<br />
1998 72 97.4 88.9 38.0 14.9 8.4 -0.8 30.2 -100.0 1.93 1.39 1.01<br />
1997 53 100.0 98.6 31.1 12.0 7.5 -3.4 74.5 -23.1 1.68 1.31 0.84<br />
1996 39 98.5 99.8 21.9 19.1 6.1 -4.1 78.5 -23.0 1.88 1.28 0.87<br />
1995 38 100.0 132.6 11.1 24.1 9.9 2.1 59.9 -14.5 2.26 1.83 1.13<br />
1994 35 100.0 177.1 7.4 32.2 18.3 8.2 92.2 -8.4 2.28 1.80 1.30<br />
1993 20 100.0 201.0 1.9 26.4 18.0 8.7 57.8 2.7 3.12 2.09 1.60<br />
1992 18 100.0 200.1 0.0 35.6 21.2 2.7 58.0 -46.1 2.77 2.06 1.29<br />
1991 9 100.0 256.5 0.0 30.3 25.0 12.5 54.7 -0.5 3.22 2.57 2.01<br />
1990 22 100.0 168.9 0.0 21.1 12.5 9.0 54.2 2.9 3.57 2.28 1.54<br />
1989 12 100.0 330.5 0.0 33.6 30.0 18.0 64.0 12.4 4.15 3.20 1.83<br />
1988 12 100.0 193.2 0.0 20.1 14.9 9.4 32.4 4.7 2.44 1.93 1.60<br />
1987 9 100.0 243.0 0.0 30.5 16.5 7.9 31.3 5.2 4.23 2.28 1.63<br />
1986 7 100.0 281.2 0.0 38.6 23.7 15.7 n/a n/a 4.85 2.97 2.22<br />
1985 2 100.0 207.5 0.0 13.7 9.4 5.1 n/a n/a 2.66 2.08 1.49<br />
1984 6 100.0 268.6 0.0 18.4 13.9 7.3 n/a n/a 3.70 2.69 2.23<br />
1983 1 100.0 181.2 0.4 n/a 8.5 n/a n/a n/a n/m 1.81 n/m<br />
1982 1 100.0 397.0 0.0 n/a 39.2 n/a n/a n/a n/m 3.97 n/m<br />
1981 0 n/m n/m n/m n/m n/m n/m n/a n/a n/m n/m n/m<br />
1980 3 100.0 512.3 0.0 31.1 25.8 14.2 n/a n/a 11.68 5.12 2.16<br />
© 2007 Private Equity Intelligence Ltd 479
Firm Index<br />
10. Firm Index<br />
© 2007 Private Equity Intelligence Ltd 489
3i 97<br />
3TS <strong>Capital</strong> Partners 97<br />
5AM Partners 97<br />
Aavishkaar International 98<br />
Abbott <strong>Capital</strong> Management 98<br />
Aberdare Ventures 98<br />
Aberdeen Asset Managers Private Equity 99<br />
Abingworth Management 99<br />
ABN AMRO <strong>Capital</strong> 100<br />
ABRY Partners 100<br />
ABS <strong>Capital</strong> Partners 100<br />
ABS Ventures 101<br />
Acacia Venture Partners 101<br />
Accel Partners 101<br />
Accel-KKR 102<br />
Access <strong>Capital</strong> Partners 102<br />
Accuitive Medical Ventures 103<br />
Acon Bastion Management 103<br />
Adams <strong>Capital</strong> Management 103<br />
Adams Street Partners 104<br />
Adena Ventures 105<br />
ADM <strong>Capital</strong> 106<br />
Advanced <strong>Capital</strong> Private Equity Partners 106<br />
Advanced Technology Ventures 106<br />
Advent International 107<br />
Adveq Group 107<br />
Aetos <strong>Capital</strong> 108<br />
AEW <strong>Capital</strong> Management 108<br />
Affinity <strong>Capital</strong> Management 108<br />
AIG Global Investment Group 109<br />
AIG Global Real Estate 109<br />
Aisling <strong>Capital</strong> 110<br />
Aldus Equity Partners 110<br />
Alex. Brown Realty 110<br />
Allegra Partners 110<br />
Alliance Venture 111<br />
Alloy Ventures 111<br />
Alpha <strong>Capital</strong> Partners 111<br />
AlpInvest Partners 112<br />
Alta Communications 112<br />
Alta Partners 112<br />
Altor Equity Partners 113<br />
Altus <strong>Capital</strong> Partners 113<br />
AM Fund 113<br />
American Industrial Partners 114<br />
American River Ventures 114<br />
American Securities <strong>Capital</strong> Partners 114<br />
Ampersand Ventures 115<br />
Angelo, Gordon & Co 115<br />
Anthem <strong>Capital</strong> 116<br />
Apache Corporation 116<br />
Apax Partners 116<br />
Apex Venture Partners 118<br />
APIDC Venture <strong>Capital</strong> 118<br />
Apjohn Ventures 118<br />
Apollo Management 119<br />
Apollo Real Estate Advisors 119<br />
Arcadia Beteiligungen 119<br />
ARCH Development Partners 120<br />
ARCH Venture Partners 120<br />
ARCIS Group 120<br />
ArcLight <strong>Capital</strong> Partners 121<br />
Firm Index<br />
Ares Management 121<br />
Argil Venture <strong>Capital</strong> 121<br />
Argos Soditic 122<br />
Arkansas <strong>Capital</strong> Corp. 122<br />
ArrowPath Venture <strong>Capital</strong> 122<br />
Arsenal <strong>Capital</strong> Partners 123<br />
Arts Alliance 123<br />
Ascend Venture Group 123<br />
Ascent Biomedical Ventures 124<br />
Ascent Venture Partners 124<br />
Ashmore Investment Management 124<br />
Astorg Partners 125<br />
Athenian Venture Partners 125<br />
Atlantic Medical Management 125<br />
Atlas Venture 126<br />
ATP Private Equity Partners 126<br />
Atrium Investimentos 126<br />
Auda Advisor Associates 127<br />
Audax Group 127<br />
Aurora <strong>Capital</strong> Group 127<br />
Aurora Funds 128<br />
Austin Ventures 128<br />
Avadis Anlagestiftung 129<br />
Avalon Ventures 129<br />
AvalonBay Communities 130<br />
Avenue <strong>Capital</strong> Group 130<br />
Bain <strong>Capital</strong> 130<br />
Baird <strong>Capital</strong> Partners 131<br />
Baird <strong>Capital</strong> Partners Europe 131<br />
Baird Venture Partners 132<br />
Baker <strong>Capital</strong> 132<br />
© 2007 Private Equity Intelligence Ltd 491
492<br />
The 2007 Performance Monitor<br />
Balkan Accession Management Company 132<br />
Banc Funds Company 133<br />
Banc of America <strong>Capital</strong> Access Funds 133<br />
Band of Angels Management Company 133<br />
Banexi Ventures Partners 134<br />
BankInvest Group 134<br />
Barclays Private Equity 135<br />
Baring Private Equity Asia 135<br />
Baring Private Equity Partners (India) 135<br />
Baring Vostok <strong>Capital</strong> Partners 136<br />
Bassini Playfair & Associates 136<br />
Battery Ventures 136<br />
Bay Partners 137<br />
BC Partners 137<br />
BCEE Advisers 138<br />
BCI Partners 138<br />
Beacon <strong>Capital</strong> Partners 138<br />
Bear Stearns Merchant Banking 139<br />
<strong>Behrman</strong> <strong>Capital</strong> 139<br />
Belvedere <strong>Capital</strong> Partners 139<br />
Benchmark <strong>Capital</strong> 140<br />
Benson Elliot <strong>Capital</strong> Management 140<br />
Beringea Private Equity 140<br />
Berkshire Partners 141<br />
BEV <strong>Capital</strong> 141<br />
BG Media Investors 142<br />
Birch Hill Equity Partners 142<br />
Black Diamond <strong>Capital</strong> Management 142<br />
BlackRock Realty 143<br />
Blackstone Group 143<br />
BlakelyStern Investment Advisors 144<br />
Blue <strong>Capital</strong> 144<br />
Blue Chip Venture Company 145<br />
Blue Point <strong>Capital</strong> Partners 145<br />
Blue Sage <strong>Capital</strong> 145<br />
BlueRun Ventures 146<br />
Bluestream Ventures 146<br />
BLUM <strong>Capital</strong> Partners 146<br />
Boston Millennia Partners 147<br />
Boston Ventures 147<br />
Boulder Ventures 147<br />
Bowmark <strong>Capital</strong> 148<br />
BPG Properties 148<br />
Brait South Africa 148<br />
Brantley Partners 149<br />
Brazos Private Equity Partners 149<br />
Brentwood Associates 149<br />
Brentwood Venture <strong>Capital</strong> 150<br />
Brera <strong>Capital</strong> Partners 150<br />
Bridgepoint 151<br />
Bridgescale Partners 151<br />
Broadview <strong>Capital</strong> 151<br />
Brockway Moran & Partners 152<br />
Brook Venture Partners 152<br />
Brooke Private Equity Advisors 152<br />
Brookfield Asset Management 153<br />
Brown Brothers Harriman 153<br />
Bruckmann Rosser Sherrill & Co 153<br />
Bryanston Realty Partners 154<br />
Brynwood Partners 154<br />
BS Private Equity 154<br />
Buchanan Street Advisors 155<br />
Buerk Dale Victor 155<br />
Burrill & Company 155<br />
Butler <strong>Capital</strong> Partners 156<br />
CAI Partners 156<br />
Calera <strong>Capital</strong> 156<br />
Caltius Partners 157<br />
Calvert Street <strong>Capital</strong> Partners 157<br />
CAM Private Equity 157<br />
Camden Partners 158<br />
Canaan Partners 158<br />
Candover Partners 158<br />
Canterbury <strong>Capital</strong> Partners 159<br />
Canterbury Park <strong>Capital</strong> 159<br />
Canyon-Johnson Urban Funds 159<br />
<strong>Capital</strong> Dynamics 160<br />
<strong>Capital</strong> International 160<br />
<strong>Capital</strong> Resource Partners 160<br />
<strong>Capital</strong> Royalty 161<br />
<strong>Capital</strong> Trust 161<br />
CapMan <strong>Capital</strong> Management 161<br />
CapMan Real Estate 162<br />
Capmark Financial Group 163<br />
Capri <strong>Capital</strong> 163<br />
Capzanine 164<br />
Cardinal Partners 164<br />
Care <strong>Capital</strong> 164<br />
Carlyle Group 165<br />
Carmel Ventures 166<br />
Carnegie Hill Venture Partners 166<br />
Castile Ventures 166<br />
Castle Harlan 167<br />
© 2007 Private Equity Intelligence Ltd
Catalyst Investors 167<br />
Catapult Venture Managers 167<br />
Catella Investments 168<br />
Catterton Partners 168<br />
CB Richard Ellis Investors 168<br />
CCMP <strong>Capital</strong> Advisors 169<br />
CCMP <strong>Capital</strong> Asia 169<br />
CCP Equity Partners 170<br />
CDC IXIS Innovation 170<br />
Celtic House Venture Partners 170<br />
Centennial Ventures 171<br />
Centerbridge <strong>Capital</strong> Partners 171<br />
Centerfield <strong>Capital</strong> Partners 171<br />
Centerline <strong>Capital</strong> Group 172<br />
Central Valley Fund 172<br />
Centre Partners Management 172<br />
Century Park <strong>Capital</strong> Partners 173<br />
CEO Venture Fund 173<br />
Cerberus <strong>Capital</strong> Management 173<br />
CHAMP Ventures 174<br />
Champaign-Urbana Venture 174<br />
Charles River Ventures 175<br />
Charlesbank <strong>Capital</strong> Partners 175<br />
Charter Life Sciences 175<br />
Charterhouse <strong>Capital</strong> Partners 176<br />
Charterhouse Group 176<br />
Chartwell Investments 176<br />
CHB <strong>Capital</strong> Partners 177<br />
Chequers <strong>Capital</strong> 177<br />
Cherokee Investment Partners 177<br />
Chicago Growth Partners 178<br />
ChinaVest 178<br />
Chisholm Private <strong>Capital</strong> Partners 178<br />
Chrysalis <strong>Capital</strong> Partners 179<br />
Chrysalis Ventures 179<br />
Churchill <strong>Capital</strong> 179<br />
Ciclad 180<br />
CID Equity Partners 180<br />
CIMB Group 180<br />
Cinven 181<br />
Citigroup Alternative Investments 181<br />
Clairvest Group 182<br />
Claremont Creek Ventures 182<br />
Clarendon Fund Managers 182<br />
Clarity Partners 183<br />
Clarus Ventures 183<br />
Clayton Dubilier & Rice 183<br />
Clearstone Venture Partners 184<br />
Clearwater <strong>Capital</strong> Partners 184<br />
Clessidra <strong>Capital</strong> Partners 184<br />
Close Brothers Private Equity 185<br />
CLSA <strong>Capital</strong> Partners 185<br />
CMEA Ventures 185<br />
Code Hennessy & Simmons 186<br />
Cognetas 186<br />
Coleman Swenson Booth 186<br />
Coller <strong>Capital</strong> 187<br />
Collinson Howe & Lennox 187<br />
Colonial First State Private Equity 187<br />
Colony <strong>Capital</strong> 188<br />
Colorado Venture Management 188<br />
Columbia <strong>Capital</strong> 189<br />
Firm Index<br />
Commonfund <strong>Capital</strong> 189<br />
Commonwealth <strong>Capital</strong> Ventures 190<br />
Compass Partners International 191<br />
Comventures 191<br />
Concert Realty Partners 191<br />
Concord Partners 192<br />
Concord Ventures 192<br />
Consilium 192<br />
Contrarian <strong>Capital</strong> Management 193<br />
Convergence Ventures 193<br />
Coral <strong>Capital</strong> Management 193<br />
Cordova, Smart & Williams 194<br />
Cornerstone Equity Investors 194<br />
Corpfin <strong>Capital</strong> 194<br />
Cortec Group 195<br />
Court Square Ventures 195<br />
Cramer Rosenthal McGlynn 195<br />
Cravey, Green & Wahlen 196<br />
Credit Suisse Customized Fund Invest. Group 196<br />
Crescendo Ventures 197<br />
Crescent <strong>Capital</strong> 198<br />
Crestview 198<br />
Crimson Investment 198<br />
Cross Atlantic <strong>Capital</strong> Partners 199<br />
Crossmark Equity Partners 199<br />
Crosspoint Venture Partners 199<br />
Crow Holdings 200<br />
Crown Advisors International 200<br />
CVC <strong>Capital</strong> Partners 201<br />
Cypress Group 201<br />
Darby Overseas Investments 201<br />
© 2007 Private Equity Intelligence Ltd 493
494<br />
The 2007 Performance Monitor<br />
Darwin Ventures 202<br />
Davis, Tuttle Venture Partners 202<br />
DDJ <strong>Capital</strong> Management 202<br />
De Novo Ventures 203<br />
Decorum <strong>Capital</strong> Partners 203<br />
Delta Private Equity Partners 203<br />
Delta Ventures 204<br />
DeltaPoint <strong>Capital</strong> Management, LLC 204<br />
Desai <strong>Capital</strong> Management Incorporated 204<br />
Deutsche Bank Asset Management 204<br />
Diamond Castle Holdings 205<br />
DN Partners 205<br />
Doll <strong>Capital</strong> Management 205<br />
Domain Associates 206<br />
Dominion Ventures 206<br />
Doughty Hanson & Co 207<br />
Doyle & Boissiere 207<br />
Draper Fisher Jurvetson 207<br />
Draper Triangle Ventures 208<br />
Drum <strong>Capital</strong> Management 208<br />
Dubin Clark 209<br />
Duff Ackerman & Goodrich 209<br />
Duke Street <strong>Capital</strong> 209<br />
Earlybird Venture <strong>Capital</strong> 210<br />
Easton Hunt <strong>Capital</strong> 210<br />
ECI Partners 210<br />
EDF Ventures 211<br />
EdgeStone <strong>Capital</strong> Partners 211<br />
Edgewater <strong>Capital</strong> Partners 211<br />
Edgewater Funds 212<br />
Edison Venture Fund 212<br />
El Dorado Ventures 212<br />
Elevation Partners 213<br />
EMBL Ventures 213<br />
Emergence <strong>Capital</strong> Partners 213<br />
EnCap Investments 214<br />
Endeavour <strong>Capital</strong> 214<br />
Energy Arrow Exploration 214<br />
Energy <strong>Capital</strong> Partners 215<br />
Energy Investors Funds Group 215<br />
Energy Spectrum 215<br />
EnerTech <strong>Capital</strong> Partners 216<br />
EnerVest Management Partners 216<br />
Enhanced <strong>Capital</strong> 216<br />
Enterprise Florida <strong>Capital</strong> Partnership 217<br />
Enterprise Investors 217<br />
Enterprise Partners Venture <strong>Capital</strong> 217<br />
EOS <strong>Capital</strong> Partners 218<br />
EQT 218<br />
Equastone 218<br />
Equinox Investors 219<br />
Equity International 219<br />
Equity Office Properties Trust 219<br />
Ergon <strong>Capital</strong> Partners 219<br />
Escalate <strong>Capital</strong> 220<br />
Essex Woodlands Health Ventures 220<br />
ETF Manager 220<br />
Ethos Private Equity 221<br />
EuclidSR Partners 221<br />
European Equity Partners 221<br />
Euroventures 222<br />
Euroventures Ukraine 222<br />
Evercore Partners 222<br />
Everest Energy 223<br />
Evergreen Pacific Partners 223<br />
Evergreen Partners 223<br />
Excel <strong>Capital</strong> Partners 224<br />
Excelsior <strong>Capital</strong> Asia 224<br />
Exponent Private Equity 224<br />
Exxel Group 225<br />
Facilitator <strong>Capital</strong> 225<br />
Fairview <strong>Capital</strong> Partners 225<br />
Falcon Investment Advisors 226<br />
Falconhead <strong>Capital</strong> 226<br />
FBR Technology Venture Partners 226<br />
FdG Associates 227<br />
Fenno Management 227<br />
Fenway Partners 227<br />
Ferd Private Equity 228<br />
Ferrer, Freeman & Co 228<br />
Fidelity <strong>Capital</strong> 228<br />
Fifth Street <strong>Capital</strong> 229<br />
Fillmore <strong>Capital</strong> Partners 229<br />
Finansa <strong>Capital</strong> 229<br />
First Albany Technology Ventures 230<br />
First Analysis 230<br />
First Reserve Corporation 230<br />
Fisher Lynch <strong>Capital</strong> 231<br />
Flagship Ventures 231<br />
Fletcher Spaght Ventures 232<br />
Focus Ventures 232<br />
Fond fondov 232<br />
Fondinvest <strong>Capital</strong> 233<br />
© 2007 Private Equity Intelligence Ltd
Fonds Partenaires-Gestion 233<br />
Formula Ventures 233<br />
Forstmann Little & Co 234<br />
Fort Washington <strong>Capital</strong> Partners 234<br />
Fortress Investment Group 235<br />
Forward Ventures 235<br />
Foundation <strong>Capital</strong> 235<br />
Founders Equity 236<br />
Fox Paine & Company 236<br />
Francisco Partners 236<br />
Frazier Healthcare Ventures 237<br />
Freeman Spogli & Co 237<br />
Friedman Fleischer & Lowe 238<br />
Frontenac Company 238<br />
Galen Partners 238<br />
Garage Technology Ventures 239<br />
GarMark Partners 239<br />
Garnett & Helfrich <strong>Capital</strong> 239<br />
GCP Gamma <strong>Capital</strong> Partners 240<br />
GED Iberian Private Equity 240<br />
Gefinor Ventures 240<br />
Gemini Israel Venture Funds 241<br />
Gen Cap America 241<br />
General Catalyst Group 241<br />
Generation Partners 242<br />
Genesis Partners 242<br />
Geneva Venture Partners 242<br />
Genstar <strong>Capital</strong> Partners 242<br />
Geocapital Partners 243<br />
Geometry Realty 243<br />
GI Partners 243<br />
Gilbert Global Equity Partners 244<br />
Giza Venture <strong>Capital</strong> 244<br />
GKM Ventures 244<br />
Gleacher Partners 245<br />
Glencoe <strong>Capital</strong> 245<br />
Glenmede 245<br />
Global Catalyst Partners 246<br />
Global Finance 246<br />
Global Forest Partners 246<br />
Global Investment House 247<br />
Global Life Science Ventures 247<br />
Globespan <strong>Capital</strong> Partners 247<br />
GMO 248<br />
GMT Communications Partners 248<br />
Goense Bounds & Partners 248<br />
Gold Hill <strong>Capital</strong> 249<br />
Goldman Sachs / Archon Group 249<br />
Goldman Sachs JBWere 249<br />
Goldman Sachs Private Equity Group 250<br />
Goldner Hawn Johnson & Morrison 251<br />
Gores Group 251<br />
GP Investimentos 251<br />
Graham Partners 252<br />
Granite Global Ventures 252<br />
Granite Ventures 252<br />
Graphite <strong>Capital</strong> Management 253<br />
Great Hill Partners 253<br />
Green Mountain Partners 253<br />
Greenpark <strong>Capital</strong> 254<br />
Gresham Investment House 254<br />
Grosvenor Investment Management 254<br />
Firm Index<br />
Grosvenor Select Partners 255<br />
Grotech <strong>Capital</strong> Group 255<br />
Groupe Alpha 255<br />
Grove International Partners 256<br />
Grove Street Advisors 256<br />
GRP Partners 256<br />
Gryphon Investors 257<br />
GSC Group 257<br />
GTCR Golder Rauner 258<br />
Guggenheim Real Estate 258<br />
H&Q Asia Pacific 259<br />
Haddington Ventures 259<br />
Halder 259<br />
Halifax <strong>Capital</strong> Partners 260<br />
Halpern, Denny & Co 260<br />
Hamilton Lane 260<br />
Hammond, Kennedy, Whitney & Co. 261<br />
Hampshire Companies 261<br />
Hampshire Equity Partners 261<br />
Hancock Park Associates 262<br />
Hancock Timber Resource Group 262<br />
Harbour Group 262<br />
HarbourVest Partners 263<br />
Harvest Partners 264<br />
Hawkesbridge Private Equity 265<br />
HB Equity Partners 265<br />
HealthCap Venture <strong>Capital</strong> 265<br />
HealthCare Ventures 266<br />
HealthPoint<strong>Capital</strong> 266<br />
Heartland Industrial Partners 266<br />
Heidelberg Innovation Funds Management 267<br />
© 2007 Private Equity Intelligence Ltd 495
496<br />
The 2007 Performance Monitor<br />
Heitman Real Estate Investment Management 267<br />
Hellman & Friedman 267<br />
Henderson Equity Partners 268<br />
Heritage Partners 268<br />
Hg<strong>Capital</strong> 269<br />
HIG <strong>Capital</strong> 269<br />
HIG Ventures 269<br />
High Peaks Venture Partners 270<br />
Highcross Strategic Advisers 270<br />
Highland <strong>Capital</strong> Partners 270<br />
Highway 12 Ventures 271<br />
Hines 271<br />
Hirtle, Callaghan & Co. 271<br />
Hispania <strong>Capital</strong> Partners 272<br />
HM <strong>Capital</strong> Partners 272<br />
Hopewell Ventures 272<br />
Horizon <strong>Capital</strong> Partners 273<br />
Horsley Bridge Partners 273<br />
House Investments 274<br />
HSBC Private Equity (Asia) Limited 274<br />
Hummer Winblad Venture Partners 274<br />
Hyperion Partners 275<br />
i-Hatch Ventures 275<br />
ICICI Venture Funds Management 275<br />
ICV Partners 276<br />
Ida-West Energy 276<br />
IDFC Private Equity 276<br />
Ignite Group 277<br />
IL & FS Investment Managers 277<br />
IllinoisVENTURES 277<br />
Index Ventures 278<br />
India Value Fund Advisors 278<br />
Indigo <strong>Capital</strong> 278<br />
Industri Kapital 279<br />
Industrial Growth Partners 279<br />
Infinity <strong>Capital</strong> Ventures 279<br />
Information Technology Ventures 280<br />
ING Clarion Partners 280<br />
ING Investment Management (Australia) 280<br />
Innisfree 281<br />
InnoCal 281<br />
Innova <strong>Capital</strong> 281<br />
InnovationsKapital 282<br />
INROADS <strong>Capital</strong> Partners 282<br />
InSight <strong>Capital</strong> Partners 282<br />
Institutional Venture Partners 283<br />
Inter-Atlantic Group 283<br />
Intercontinental Real Estate Corporation 283<br />
Intersouth Partners 284<br />
InterWest Partners 284<br />
Invencor 285<br />
Inverness Management 285<br />
INVESCO Private <strong>Capital</strong> 285<br />
INVESCO Real Estate 286<br />
Investitori Associati 286<br />
Investors in the Community 286<br />
Ironbridge <strong>Capital</strong> 287<br />
IRRfc 287<br />
Israel Seed Partners 287<br />
IT Provider Adviser 288<br />
ITU Ventures 288<br />
J.W. Childs Associates 288<br />
JAFCO Co. (Japan) 289<br />
JatoTech Ventures 290<br />
Jefferies <strong>Capital</strong> Partners 290<br />
Jefferson Partners 290<br />
JER Partners 291<br />
Jerusalem Venture Partners 291<br />
JK&B <strong>Capital</strong> 292<br />
JLL Partners 292<br />
JMB Realty 292<br />
JMI Equity 293<br />
John Buck Company 293<br />
Jordan Company 293<br />
JPMorgan Asset Management 294<br />
JPMorgan Partners 294<br />
Karnataka Asset Management Company 295<br />
Kayne Anderson 295<br />
KBL Healthcare Ventures 296<br />
KBS Realty Advisors 296<br />
Kelso & Company 296<br />
Kenmont <strong>Capital</strong> Partners 297<br />
Kensington <strong>Capital</strong> Partners 297<br />
Kestrel Ventures 297<br />
Kettle Partners 298<br />
Keyhaven <strong>Capital</strong> Partners 298<br />
Keystone Property Group 298<br />
Keystone Ventures 299<br />
Kidd & Company 299<br />
Kirtland <strong>Capital</strong> Partners 299<br />
Kitty Hawk <strong>Capital</strong> 300<br />
Kleiner Perkins Caufield & Byers 300<br />
Klesch & Company 300<br />
© 2007 Private Equity Intelligence Ltd
Kline Hawkes & Co 301<br />
Knightsbridge Advisers 301<br />
Kodiak Venture Partners 301<br />
Kohlberg & Company 302<br />
Kohlberg Kravis Roberts 302<br />
KPS Special Situation Funds 303<br />
KRG <strong>Capital</strong> 303<br />
Krokus PE 303<br />
KSL <strong>Capital</strong> Partners 304<br />
KTR <strong>Capital</strong> Partners 304<br />
Kuwait Financial Centre S.A.K. 304<br />
L&B Realty Advisors 305<br />
Lake <strong>Capital</strong> Partners 305<br />
Lake Pacific Partners 305<br />
Landmark Partners 306<br />
Landsbanki - Landsvaki 306<br />
Langholm <strong>Capital</strong> Partners 307<br />
LaSalle Investment Management 307<br />
Latin America <strong>Capital</strong> Partners 307<br />
Latin America Enterprise Fund Managers 308<br />
Latterell Venture Partners 308<br />
Lazard Real Estate Partners 308<br />
Lazard Technology Partners 309<br />
Lead Equities 309<br />
Leapfrog Venture 309<br />
Leeds Weld & Co 310<br />
Legal & General Ventures 310<br />
Legend <strong>Capital</strong> Management 310<br />
Lehman Brothers 311<br />
LEM Mezzanine 312<br />
Lend Lease Real Estate Investments 312<br />
Leonard Green & Partners 312<br />
Levine Leichtman <strong>Capital</strong> Partners 313<br />
Levmark <strong>Capital</strong> Corp 313<br />
Lexin <strong>Capital</strong> 313<br />
Lexington Partners 314<br />
LGT <strong>Capital</strong> Partners 314<br />
Liberty Partners 315<br />
Lighthouse <strong>Capital</strong> Partners 315<br />
Lightspeed Venture Partners 315<br />
Lightyear <strong>Capital</strong> 316<br />
Lime Rock Partners 316<br />
Lincolnshire Management 317<br />
Lindsay Goldberg & Bessemer 317<br />
Linsalata <strong>Capital</strong> Partners 317<br />
Lion <strong>Capital</strong> 318<br />
Litorina <strong>Capital</strong> Management 318<br />
Littlejohn & Co. 318<br />
LLR Partners 319<br />
Lombard Investments 319<br />
London Fund Managers 319<br />
Lone Star Funds 320<br />
Lovell Minnick Partners 320<br />
LSU Research and Technology Foundation 320<br />
Lubert Adler 321<br />
M/C Venture Partners 321<br />
Macquarie Direct Investment 322<br />
Macquarie Funds Management Group 322<br />
Macquarie Global Property Advisors 322<br />
Madison Dearborn Partners 323<br />
Mangrove <strong>Capital</strong> Partners 323<br />
Markstone <strong>Capital</strong> Group 323<br />
Firm Index<br />
Marlborough <strong>Capital</strong> Advisors 324<br />
Mason Wells 324<br />
Massachusetts Institute of Technology 324<br />
Matlin Patterson Global Advisors 325<br />
Matrix Partners 325<br />
MAVA <strong>Capital</strong> 325<br />
Mayfield Fund 326<br />
MCC - Sofipa 326<br />
McCown De Leeuw & Co 326<br />
MCM <strong>Capital</strong> Partners 327<br />
MDS <strong>Capital</strong> Corp 327<br />
Mediphase Venture Partners 327<br />
Menlo Ventures 328<br />
Meridian Venture Partners 328<br />
Merion Investment Partners 328<br />
Merit <strong>Capital</strong> Partners 329<br />
Merit Energy Partners 329<br />
Meritage Private Equity 329<br />
Meritech <strong>Capital</strong> Partners 330<br />
Mesirow Financial 330<br />
Mezzanine Management UK 331<br />
MHR Fund Management 331<br />
Miami Valley Economic Development Coalition 331<br />
Mid-Atlantic Venture Funds 332<br />
MidOcean Partners 332<br />
MIL Equity Partners 332<br />
Milestone <strong>Capital</strong> 333<br />
Milestone Partners 333<br />
Miller Global Properties 333<br />
MillhouseIAG 334<br />
Mission Ventures 334<br />
© 2007 Private Equity Intelligence Ltd 497
498<br />
The 2007 Performance Monitor<br />
MK <strong>Capital</strong> 334<br />
MMF <strong>Capital</strong> Management 335<br />
Mobius Venture <strong>Capital</strong> 335<br />
Mohr Davidow Ventures 335<br />
Monadnock Venture <strong>Capital</strong> 336<br />
Montagu Private Equity 336<br />
Montauk Triguard 336<br />
Monument Advisors 337<br />
Morgan Stanley Private Equity 337<br />
Morgan Stanley Real Estate 337<br />
Morgenthaler Partners 338<br />
MPM <strong>Capital</strong> 338<br />
MSBI <strong>Capital</strong> 339<br />
MTI Firms 339<br />
Muller & Monroe 339<br />
Murphree Venture Partners 340<br />
Murphy & Partners 340<br />
MVM Life Science Partners 340<br />
MWV Pinnacle Management 341<br />
Natexis-Cape 341<br />
Natixis Private Equity 341<br />
Natural Gas Partners 341<br />
Nautic Partners 342<br />
Navis <strong>Capital</strong> Partners 342<br />
NeoMed 342<br />
New Boston Fund 343<br />
New England Partners 343<br />
New Enterprise Associates 343<br />
New Mountain <strong>Capital</strong> 344<br />
New York Life <strong>Capital</strong> Partners 344<br />
Newbury Ventures 345<br />
Newstone <strong>Capital</strong> Partners 345<br />
Nexit Ventures 345<br />
Nexxus <strong>Capital</strong> 346<br />
NGEN Partners 346<br />
NGN <strong>Capital</strong> 346<br />
Nogales Investors 347<br />
Nomura Group 347<br />
Nordic Biotech 348<br />
Nordic <strong>Capital</strong> 348<br />
Normandy Real Estate Partners 348<br />
Noro-Moseley Partners 348<br />
North American Business Development Co 349<br />
North Atlantic <strong>Capital</strong> Corp 349<br />
North Atlantic Value 349<br />
North Bridge Venture Partners 350<br />
North Castle Partners 350<br />
North Texas Opportunity 350<br />
Northcoast <strong>Capital</strong> Management 351<br />
Northern Enterprise Limited 351<br />
Northgate <strong>Capital</strong> 351<br />
Northstar <strong>Capital</strong> 352<br />
Northstar <strong>Capital</strong> Investment Corp. 352<br />
Novak Biddle Venture Partners 352<br />
Novus Ventures 353<br />
NW Brown <strong>Capital</strong> Partners 353<br />
O'Connor <strong>Capital</strong> Partners 353<br />
Oak Hill Partners 354<br />
Oak Investment Partners 354<br />
Oaktree <strong>Capital</strong> Management 355<br />
Och-Ziff Real Estate Advisors 356<br />
Odewald & Compagnie 356<br />
Odyssey Investment Partners 356<br />
Offit Hall <strong>Capital</strong> Management 356<br />
Olympus Partners 357<br />
Olympus Real Estate Partners 357<br />
One Liberty Ventures 358<br />
Onex Corp 358<br />
Opportunity <strong>Capital</strong> Partners 358<br />
Opus <strong>Capital</strong> Ventures 359<br />
OrbiMed Advisors 359<br />
Oregon State Treasury 359<br />
Orion <strong>Capital</strong> Managers 360<br />
OVP Venture Partners 360<br />
Oxford Bioscience Partners 360<br />
Oxford <strong>Capital</strong> Partners 361<br />
PA Early Stage 361<br />
Pacesetter <strong>Capital</strong> Group 362<br />
Pacholder Associates 362<br />
Pacific Community Ventures 362<br />
Pacific Horizon Ventures 362<br />
PAI Partners 363<br />
Paladin <strong>Capital</strong> Group 363<br />
Paladin Realty Partners 363<br />
Palamon <strong>Capital</strong> Partners 364<br />
Palladium Equity Partners 364<br />
Palmer <strong>Capital</strong> Partners 364<br />
Palomar Ventures 365<br />
Pantheon Ventures 365<br />
Paragon Advisory 366<br />
Parallel Investment Partners 366<br />
Parish <strong>Capital</strong> Advisors 367<br />
Park Street <strong>Capital</strong> 367<br />
© 2007 Private Equity Intelligence Ltd
Parmenter Realty Partners 368<br />
Partech International Ventures 368<br />
Parthenon <strong>Capital</strong> 368<br />
Partners Group 369<br />
Pathway <strong>Capital</strong> Management 369<br />
Patria - Banco de Negocios 369<br />
Paul <strong>Capital</strong> Investments 370<br />
Paul <strong>Capital</strong> Partners 370<br />
PCG <strong>Capital</strong> Partners 371<br />
Pegasus <strong>Capital</strong> Advisors 371<br />
Peninsula <strong>Capital</strong> Partners 371<br />
Pentech Ventures 372<br />
Peppertree Partners 372<br />
Pequot <strong>Capital</strong> Management 372<br />
Performance Equity Management 373<br />
Permira 373<br />
Perseis Partners 374<br />
Perseus 374<br />
Perseus Realty Partners 374<br />
Pharos <strong>Capital</strong> Group 375<br />
Phoenix Equity Partners 375<br />
Phoenix Partners 375<br />
Pinnacle Ventures 376<br />
Pino Venture Partners 376<br />
Pitango Venture <strong>Capital</strong> 376<br />
Platinum Equity 377<br />
Platinum Neurone Ventures 377<br />
PNC Equity Partners 377<br />
Polaris Venture Partners 378<br />
Pomona <strong>Capital</strong> 378<br />
Pond Venture Partners 378<br />
Pradera - AM 379<br />
Praedium Group 379<br />
Pragma <strong>Capital</strong> 379<br />
Prime Management Group 380<br />
Prime Technology Ventures 380<br />
PrimePartners Group 380<br />
Primus Venture Partners 381<br />
Prism <strong>Capital</strong> 381<br />
Prism Venture Partners 381<br />
Private Advisors 382<br />
Private Equity Investors 382<br />
Private Equity Partners S.p.A. 383<br />
Priveq <strong>Capital</strong> Funds 383<br />
Priveq Investment 383<br />
Procuritas Partners 383<br />
Progress Investment Management Company 384<br />
Prospect Venture Partners 384<br />
Prospector Equity <strong>Capital</strong> 384<br />
Provender <strong>Capital</strong> Group 385<br />
Providence Equity Partners 385<br />
Prudential <strong>Capital</strong> Group 385<br />
Prudential Real Estate Investors 386<br />
Prudential Timber Investments 386<br />
PTV Sciences 386<br />
Quad-C Management 387<br />
Quadrangle Group 387<br />
Quadriga <strong>Capital</strong> 387<br />
Quaker BioVentures 388<br />
Quartus Gestion 388<br />
Questor Management 388<br />
Real Estate <strong>Capital</strong> Partners 389<br />
Firm Index<br />
Red River Ventures 389<br />
Redpoint Ventures 390<br />
RedShift Ventures 390<br />
Regent Pacific Group 390<br />
Relational Investors 391<br />
Reliant Equity Partners 391<br />
Renaissance Partners 391<br />
Reservoir <strong>Capital</strong> Group 392<br />
Reservoir Venture Partners 392<br />
Resurgence Asset Management 392<br />
Retail Initiative 393<br />
RFE Investment Partners 393<br />
RHO Ventures 393<br />
Rhone <strong>Capital</strong> 394<br />
Rice, Sangalis, Toole & Wilson 394<br />
Richardson Financial Group 394<br />
Richland Ventures 395<br />
Riordan, Lewis & Haden 395<br />
Ripplewood Holdings 395<br />
River Cities <strong>Capital</strong> Fund 396<br />
Riverlake Partners 396<br />
Riverside Company 396<br />
RiverVest Ventures 397<br />
Rizvi Traverse 397<br />
RMK Timberland Group 397<br />
RockBridge <strong>Capital</strong> 397<br />
Rockpoint Group 398<br />
RockPort <strong>Capital</strong> Partners 398<br />
Rockspring Property Investment Managers 398<br />
Rocky Mountain <strong>Capital</strong> Partners 399<br />
Rosemont Investment Partners 399<br />
© 2007 Private Equity Intelligence Ltd 499
500<br />
The 2007 Performance Monitor<br />
Rosewood <strong>Capital</strong> 399<br />
Rossrock 400<br />
Rothschild Realty 400<br />
RREEF Alternative Investments 400<br />
RRZ Private Equity 401<br />
Rustic Canyon Ventures 401<br />
Safeguard International 401<br />
Sandefer <strong>Capital</strong> 402<br />
Sanderling Management 402<br />
Sandler <strong>Capital</strong> Management 402<br />
Sankaty Advisors 403<br />
Saratoga Partners 403<br />
Saugatuck <strong>Capital</strong> 403<br />
SB Partners 404<br />
SCF Partners 404<br />
Schroder Property Investment Management 404<br />
Scope <strong>Capital</strong> 405<br />
Scottish Equity Partners 405<br />
SCP Private Equity Partners 405<br />
Seaport <strong>Capital</strong> 406<br />
Secured <strong>Capital</strong> Japan Co. 406<br />
Security <strong>Capital</strong> European Realty 406<br />
Seneca Partners 407<br />
Sentinel Real Estate Corporation 407<br />
Sequel Partners 407<br />
Sequoia <strong>Capital</strong> 408<br />
Service Equity Partnes 408<br />
Sevin Rosen Funds 409<br />
SGAM AI Private Equity 409<br />
Shamrock Holdings 409<br />
Shasta Ventures 410<br />
Shawmut <strong>Capital</strong> Partners 410<br />
Shepherd Management 410<br />
Shore <strong>Capital</strong> Group 411<br />
Sierra Ventures 411<br />
Sightline Partners 411<br />
Siguler Guff & Co 412<br />
Silver Creek Ventures 412<br />
Silver Lake 412<br />
Siparex - Sigefi Private Equity 413<br />
Skyline Ventures 413<br />
Skypoint <strong>Capital</strong> 413<br />
Smith Whiley & Company 414<br />
Sofimac Partners 414<br />
Sofinnova Ventures 414<br />
Softbank Asia Infrastructure Fund Advisors 415<br />
SOFTBANK <strong>Capital</strong> Partners 415<br />
Solera <strong>Capital</strong> 415<br />
Sorenson <strong>Capital</strong> 416<br />
Sorrento Ventures 416<br />
South Atlantic Funds 416<br />
Sovereign <strong>Capital</strong> 416<br />
Spark <strong>Capital</strong> 417<br />
Spectrum Equity Investors 417<br />
Split Rock Partners 417<br />
Sprout Group 418<br />
Standard Life Investments 418<br />
STAR Ventures 419<br />
StarVest Partners 419<br />
Starwood <strong>Capital</strong> Group 419<br />
Sterling Partners 420<br />
Sternhill Partners 420<br />
Stockbridge <strong>Capital</strong> Partners 420<br />
Stone Point <strong>Capital</strong> 421<br />
Storebrand Alternative Investments 421<br />
Summer Street <strong>Capital</strong> Partners 422<br />
Summit Partners 422<br />
Sun <strong>Capital</strong> Partners 423<br />
SunBridge Partners 423<br />
Sunrise <strong>Capital</strong> Partners 423<br />
SunTx <strong>Capital</strong> Partners 424<br />
SV Life Sciences 424<br />
SVG Advisers 424<br />
Swander Pace <strong>Capital</strong> 425<br />
Syncom <strong>Capital</strong> Corp 425<br />
Synergo 425<br />
TA Associates 426<br />
TA Associates Realty 427<br />
Tailwind <strong>Capital</strong> 427<br />
Tallwood Venture <strong>Capital</strong> 428<br />
TANEO 428<br />
TAT <strong>Capital</strong> Partners 428<br />
TCW Group 429<br />
TD <strong>Capital</strong> Private Equity Investors 429<br />
TD <strong>Capital</strong> Ventures 430<br />
TDA <strong>Capital</strong> Partners 430<br />
TDH Private Equity Management Company 430<br />
TDR <strong>Capital</strong> 431<br />
Technology Crossover Ventures 431<br />
Technology Partners 431<br />
Technology Venture Partners 432<br />
Telecom Partners 432<br />
Telesoft Partners 432<br />
© 2007 Private Equity Intelligence Ltd
Tennessee Valley Ventures 433<br />
Terra Firma <strong>Capital</strong> Partners 433<br />
Texas Pacific Group 433<br />
TGF Management Corporation 434<br />
TH Lee Putnam Ventures 434<br />
Thayer <strong>Capital</strong> Partners 435<br />
Thayer Lodging Group 435<br />
Thoma Cressey Bravo 435<br />
Thomas H Lee Partners 436<br />
Thomas Weisel Asset Management 436<br />
Thomas, McNerney & Partners 437<br />
Thompson Clive & Partners 437<br />
Thompson Street <strong>Capital</strong> Partners 437<br />
Three Arch Partners 437<br />
Three Cities Research 438<br />
Ticonderoga <strong>Capital</strong> 438<br />
Timberline Venture Partners 438<br />
Timbervest Partners 439<br />
Tishman Speyer 439<br />
TL Ventures 439<br />
Tonka Bay Equity Partners 440<br />
TowerBrook <strong>Capital</strong> Partners 440<br />
Transportation Resource Partners 440<br />
Transwestern Investment Company 441<br />
Tri Continental <strong>Capital</strong> 441<br />
Triathlon Medical Partners 442<br />
Tricor Pacific <strong>Capital</strong> 442<br />
Trident <strong>Capital</strong> 442<br />
Trillium Group 443<br />
Trinity Ventures 443<br />
Triton 443<br />
Triumph <strong>Capital</strong> Group 444<br />
Trivest Partners 444<br />
Troika Dialog Asset Management 444<br />
True Ventures 445<br />
TSG <strong>Capital</strong> 445<br />
TSG Consumer Partners 445<br />
Tuckerman Group 446<br />
Tullis-Dickerson & Co 446<br />
TVG <strong>Capital</strong> Partners 446<br />
TVM <strong>Capital</strong> 447<br />
Unigestion 447<br />
Union Square Ventures 447<br />
Updata Venture Partners 448<br />
US Venture Partners 448<br />
Valhalla Partners 449<br />
Valley Ventures 449<br />
Vanguard Venture Partners 449<br />
VantagePoint Venture Partners 450<br />
Varde Partners 450<br />
Vector <strong>Capital</strong> 450<br />
Vencap International 451<br />
Ventech 451<br />
Venture <strong>Capital</strong> Fund of America 451<br />
Venture Investment Associates 452<br />
Venture Investors Management 452<br />
Venture Partners 452<br />
Ventures West 453<br />
Verdane <strong>Capital</strong> 453<br />
Verge 453<br />
Veritas <strong>Capital</strong> 454<br />
Veronis Suhler Stevenson 454<br />
Firm Index<br />
Versant Ventures 454<br />
Vestar <strong>Capital</strong> Partners 455<br />
Vision <strong>Capital</strong> (US) 455<br />
Vitalife Life Sciences Ventures 455<br />
VSP <strong>Capital</strong> 456<br />
vSpring <strong>Capital</strong> 456<br />
W <strong>Capital</strong> Partners 456<br />
W.R. Huff Asset Management 457<br />
Wachovia Timberland Investment Group 457<br />
Walden International 457<br />
Walden Israel 458<br />
Walton Street <strong>Capital</strong> 458<br />
Wand Partners 458<br />
Warburg Pincus 459<br />
Wasatch Venture Fund 459<br />
Washington <strong>Capital</strong> Partners 460<br />
Wasserstein Perella & Co 460<br />
Water Street <strong>Capital</strong> 460<br />
Wayzata Investment Partners 461<br />
Weiss Peck & Greer 461<br />
Wellspring <strong>Capital</strong> Management 461<br />
Welsh, Carson, Anderson & Stowe 462<br />
West Midlands Enterprise 462<br />
Westbrook Partners 463<br />
Western Technology Investment 463<br />
WestLB Mellon Asset Management 463<br />
Weston Presidio <strong>Capital</strong> 464<br />
WestSphere Group 464<br />
Wexford <strong>Capital</strong> 465<br />
Wheatley Partners 465<br />
Whippoorwill Associates 465<br />
© 2007 Private Equity Intelligence Ltd 501
502<br />
The 2007 Performance Monitor<br />
Whitney & Co 466<br />
Wicks Group 466<br />
William Blair <strong>Capital</strong> Partners 467<br />
William E. Simon & Sons 467<br />
Willis Stein & Partners 467<br />
Wilshire Private Markets Group 468<br />
Wilton Asset Management 468<br />
Wind Point Partners 468<br />
Windjammer <strong>Capital</strong> 469<br />
Windward <strong>Capital</strong> Partners 469<br />
Wingate Partners 470<br />
WL Ross & Co 470<br />
Worldview Technology Partners 471<br />
Xylem Investments 471<br />
YFM Private Equity 471<br />
Yorkshire Venture Finance 472<br />
Yorktown Energy Partners 472<br />
Yucaipa Companies 472<br />
Zephyr Management 473<br />
Zero Stage <strong>Capital</strong> 473<br />
Zesiger <strong>Capital</strong> Group 473<br />
Zouk Ventures 474<br />
© 2007 Private Equity Intelligence Ltd
2007 Private Equity<br />
Performance Monitor<br />
Your Essential Guide to Private Equity and Venture <strong>Capital</strong> Fund Performance<br />
• Transparent performance data for over 3,000 private equity and venture capital funds of all geographies and types<br />
• Detailed analysis of market trends and benchmarks, with in-depth analysis by individual fund type, sections examining<br />
risk, plus a study into the relative performance of private equity compared with other asset classes historically<br />
• Detailed profiles for over 1,000 separate private equity firms worldwide<br />
• View which GPs deliver consistent good performance<br />
• Quartile rankings - see who the top performers are<br />
• More information is available at: www.preqin.com/PM<br />
I would like to order the 2007 Private Equity Performance Monitor:<br />
Name:<br />
Firm: Job Title:<br />
Address:<br />
PUBLICATION ORDER FORM: Complete this form and return it by post/fax<br />
£675 + £10 shipping $1,345 + $40 shipping €995 + €25 shipping<br />
I would like to order the 2007 Performance Package (Publication plus 12 month’s access to Performance Analyst Online):<br />
£1,295 + £10 shipping $2,595 + $40 shipping €1,995 + €25 shipping (Prices include 50% discount on full publication price)<br />
Additional Copies<br />
£95 + £5 shipping $180 + $20 shipping €135 + €12 shipping<br />
(Shipping Costs will not exceed a maximum of: £15 / $60 / €37 per order)<br />
City: Post/Zip Code: Country:<br />
Telephone: Email:<br />
Payment Options:<br />
Cheque enclosed (please make the cheque payable to ‘Private Equity Intelligence’)<br />
Credit Card Visa Amex MasterCard<br />
Card No: Expiration Date:<br />
Name on Card:<br />
Private Equity Intelligence - Fleet House, 8 - 12 New Bridge Street, London, EC4V 6AL<br />
w: www.preqin.com / e: info@preqin.com / t: +44 (0)20 7822 8500 / f: +44 (0)87 0330 5892 or +1 440 445 9595<br />
© 2007 Private Equity Intelligence Ltd. / www.preqin.com