Frans van Poppel: a sort of farewell. Liber Amicorum. - NIDI
Frans van Poppel: a sort of farewell. Liber Amicorum. - NIDI
Frans van Poppel: a sort of farewell. Liber Amicorum. - NIDI
- No tags were found...

Create successful ePaper yourself
Turn your PDF publications into a flip-book with our unique Google optimized e-Paper software.
<strong>Frans</strong> <strong>van</strong> <strong>Poppel</strong>: A <strong>sort</strong> <strong>of</strong> <strong>farewell</strong><strong>Liber</strong> <strong>Amicorum</strong>
Publication:Nederlands Interdisciplinair Demografisch InstituutLange Houtstraat 19, 2511 CV The HagueP.O. Box 11650, 2502 AR The HaguePhone: + 31 70 - 3565200December 2012Photo cover: Kees RuttenEditors:Erik Beekink and Evelien WalhoutTechnical coordination:Jeannette <strong>van</strong> der Aar and Jacqueline <strong>van</strong> der HelmPublisher:AndoMercuriusweg 372516 AW Den HaagISBN: 978-90-8780-000-0© 2012, <strong>NIDI</strong>, The HagueNo part <strong>of</strong> this book may be reproduced in any form or by means, print, photocopy, micr<strong>of</strong>ilm,or otherwise, without the prior written permission <strong>of</strong> the publisher
Table <strong>of</strong> contentsPreface....................................................................................................................................... 7Introduction............................................................................................................................... 8Part IScope and Impact.................................................................................................................... 11<strong>Frans</strong> <strong>van</strong> <strong>Poppel</strong>: A <strong>sort</strong> <strong>of</strong> <strong>farewell</strong> in 2012.........................................................................13Dirk J. <strong>van</strong> de KaaAhead, not alo<strong>of</strong>. <strong>Frans</strong> <strong>van</strong> <strong>Poppel</strong>’s contribution to agenda-settingin historical demography.........................................................................................................17Jan KokThe impact <strong>of</strong> a historical demographer: A bibliometric approach........................................22George AlterOn the occasion <strong>of</strong> the retirement <strong>of</strong> <strong>Frans</strong> <strong>van</strong> <strong>Poppel</strong>..........................................................25Simon SzreterPart IIData and Methods....................................................................................................................27The census and the historical demographer............................................................................28Peter DoornSex ratios in global historical perspective:Female surplus versus female deficit......................................................................................32Antoinette Fauve-ChamouxErasmus’ monkey.Iconoclastic reflections on two developments in technical demography...............................39Ron Lesthaeghe25 Years <strong>of</strong> collaboration: The Historical Sample <strong>of</strong> theNetherlands and LINKS..........................................................................................................45Kees MandemakersPart IIIFertility and Nuptiality............................................................................................................49Low fertility, economic change and unemployment during the interbellum period..............50Jan Van BavelSocio-economic status and marriage in Northeast China, 1749-1912...................................54Shuang Chen, James Lee and Cameron CampbellThe incidence <strong>of</strong> consanguinity in Norway in the late 19 th century.......................................58Hilde L. Jåstad and Gunnar ThorvaldsenVerzuiling (‘pillarisation’), ontzuiling (‘de-pillarisation’) and fertility inthe Netherlands (1920-1980)..................................................................................................63Hans Knippenberg and Sjoerd de VosMarriage and conscription in the Netherlands........................................................................66Pim Kooij
Religious and socio-economic determinants <strong>of</strong> fertility limitation by birth spacing:Results <strong>of</strong> the Historical Sample <strong>of</strong> the Netherlands..............................................................69Aart C. LiefbroerLong term trends in social and geographical homogamy:A plea for an integrated approach...........................................................................................73Ineke Maas, Marco H.D. <strong>van</strong> Leeuwen and Richard L. ZijdemanOrigins <strong>of</strong> the ‘western European marriage pattern’..............................................................78Jona SchellekensThe West European marriage system in early modern Europe..............................................81Tony WrigleyPart IVAging and Mortality................................................................................................................85Are we getting sick <strong>of</strong> low incomes?......................................................................................86Tommy BengtssonNeither alone nor neglected: The elderly in a 19 th -century Italian city..................................89Renzo DerosasChildbearing and longevity – the contribution <strong>of</strong> historical demography.............................95Martin DribeExcess mortality during the Dutch famine <strong>of</strong> 1940-45. When, where, and why?Some unresolved questions.....................................................................................................98Bertie LumeyDivergence <strong>of</strong> life expectancy and the epidemiological transition theory...........................106Johan P. MackenbachHeat waves and elderly mortality responses:What about social differential vulnerability? ....................................................................... 113Michel Oris and Mathias Lerch<strong>Frans</strong> <strong>van</strong> <strong>Poppel</strong> and the study <strong>of</strong> perinatal and childhood mortality................................. 117Diego Ramiro-FariñasDemographic systems and population change: Restoring mortalityits rightful place ....................................................................................................................120David ReherThe impact <strong>of</strong> the 1911 heat wave on mortality in the Dutch province <strong>of</strong> Limburg...........123Willibrord RuttenBiography <strong>of</strong> the authors.......................................................................................................129
PrefaceThis is a book written by scientific friends <strong>of</strong> <strong>Frans</strong> <strong>van</strong> <strong>Poppel</strong> on the occasion <strong>of</strong> his 65 thbirthday; an event that at present still means automatic retirement in the Netherlands. For theNetherlands Interdisciplinary Demographic Institute (<strong>NIDI</strong>) and the demographic discipline,<strong>Frans</strong> has been and still is <strong>of</strong> large stature and we have to choose one occasion to show himhow big his impact is. His formal retirement is a good excuse to do that.Indeed he has left a big mark on demographic science. For example, initially, the editors ErikBeekink and Evelien Walhout planned to add a list <strong>of</strong> his publications to this volume, butthat proved to be a little out <strong>of</strong> balance, since it would have covered more than 50 pages!Nevertheless, it is not in the first place in quantity, but in the quality <strong>of</strong> his scientific workthat he stands out. For <strong>NIDI</strong> he set the standard <strong>of</strong> making it the rule rather than the exceptionto publish in the highest ranking demographic journals. His dedication to carefully plannedempirical research has been an example for younger scholars both within and outside <strong>NIDI</strong>,and he has always been more than willing to help out if a colleague asked his advice to getaround a difficult research problem.<strong>NIDI</strong> is very proud to have had such a scholar among its staff. <strong>Frans</strong> started at <strong>NIDI</strong> in 1976,a year that today is considered history for some. Retirement marks a <strong>sort</strong> <strong>of</strong> <strong>farewell</strong>, but not<strong>of</strong> the <strong>sort</strong> that <strong>Frans</strong> is going to leave the scientific stage, or <strong>NIDI</strong>. As a recognition <strong>of</strong> hiscontributions to both demography and to the institute, <strong>NIDI</strong> is happy to <strong>of</strong>fer <strong>Frans</strong> a honoraryfellowship, so that he remains affiliated with the institute in the future.Without a doubt this <strong>Liber</strong> <strong>Amicorum</strong> is not only a fine tribute to him, but also a welcomeaddition to demographic libraries. The topics chosen by the contributors signify the broad areathat he has covered, and the content <strong>of</strong> their contributions prove the significant scientific valuehe has added to the field. Taken together, they give a beautiful view <strong>of</strong> a scientific career in theheart <strong>of</strong> the demographic discipline, where a lot <strong>of</strong> work is indeed joint work, but neverthelesswith a clear individual mark.The two editors have done a very good job. Thanks to their efforts in a short time a largenumber <strong>of</strong> first class contributions were collected. I also express my thanks to all authors.All participants reacted enthusiastically and swiftly to the request <strong>of</strong> the editors. Each <strong>of</strong>their contributions reveals an interesting piece <strong>of</strong> <strong>Frans</strong>’s career. Taken together, they form abeautiful and rich mosaic <strong>of</strong> a remarkable academic career.Although retirement is ‘a <strong>sort</strong> <strong>of</strong> <strong>farewell</strong>’, I am sure his academic productivity will not showeven the slightest dip around this age and he will continue to work, perhaps more leisurelythan in the past, on his many demographic interests. So in a sense this collection <strong>of</strong> tributes isa snapshot in a career in full swing.Leo <strong>van</strong> WissenNovember 20127
8IntroductionOn 27 December 2012 <strong>Frans</strong> <strong>van</strong> <strong>Poppel</strong>, Senior researcher at <strong>NIDI</strong> in The Hague andPr<strong>of</strong>essor <strong>of</strong> Kinship Demography at the Department <strong>of</strong> Sociology at Utrecht University, willretire. After more than 40 years <strong>of</strong> dedication to academic research he will become honoraryfellow at <strong>NIDI</strong>, the research institute where he spent most <strong>of</strong> his academic career.The editors and contributors dedicate this volume with short essays to <strong>Frans</strong> <strong>van</strong> <strong>Poppel</strong>and his influential scholarly work. The contributions in this volume –a <strong>Liber</strong> <strong>Amicorum</strong>–centre around issues that are <strong>of</strong> particular interest to <strong>Frans</strong> and which are central to historicaldemography as a whole: The history <strong>of</strong> the family, life course analysis, historical data andmethodology, and historical population issues. The contributors, all national and internationalacademic colleagues in the field <strong>of</strong> –mostly– social and economic history and historicaldemography reflect on the influence and impact <strong>of</strong> <strong>Frans</strong> <strong>van</strong> <strong>Poppel</strong> and his scientific workin the field <strong>of</strong> Dutch as well as international historical demography. They also reflect on theirjoint work, present new findings and insights, and propose new research and methodologies.The significance <strong>of</strong> <strong>Frans</strong> <strong>van</strong> <strong>Poppel</strong> as a historical demographer has been substantial as ismade clear by the various authors in their essays. In the first place, without any overstatement,the responses to the invitation to contribute to this volume were overwhelming. This tellsus a lot about the personality <strong>of</strong> <strong>Frans</strong> <strong>van</strong> <strong>Poppel</strong> who is in many respects our mentor. Allreplies were encouraging and enthusiastic with colleagues already reflecting on his work orthe work they had done together with <strong>Frans</strong>, the committees they participated in, the meetingsat conferences and above all, his friendship. In the second place, the range <strong>of</strong> topics in thisvolume is extensive which highly reflects the academic diversity <strong>of</strong> <strong>Frans</strong>.A first cluster <strong>of</strong> essays refers predominantly to the scope and impact <strong>of</strong> <strong>Frans</strong> in the field <strong>of</strong>family history, life course analysis and historical demography. What is the influence <strong>of</strong> <strong>Frans</strong>in historical science and demography? The essays <strong>of</strong> Dirk J. <strong>van</strong> de Kaa and Jan Kok, bothpresenting their ideas on the work <strong>of</strong> <strong>Frans</strong> in lectures during a seminar in honor <strong>of</strong> <strong>Frans</strong>’sretirement and organized by <strong>NIDI</strong> on 11 December 2012, the personal (scientific) note <strong>of</strong>Simon Szreter and the bibliometric analysis <strong>of</strong> George Alter, should give the reader food forthought.The variation in topics provides, in our opinion, a modest but fairly sound overview <strong>of</strong> thefields <strong>of</strong> interest <strong>of</strong> <strong>Frans</strong>. The scientific essays in this volume are distinguished according toresearch theme: Data and methods, fertility and nuptiality, and aging and mortality. These mainfields <strong>of</strong> research are not difficult to discover in <strong>Frans</strong>’s scholarly work over the past 40 years.We could range the essays <strong>of</strong> Peter Doorn, Antoinette Fauve-Chamoux, Ron Lesthaeghe andKees Mandemakers on the side <strong>of</strong> ‘methodological issues’ while stressing the importance <strong>of</strong>proper techniques and good quality data. They express both implicitly and explicitly <strong>Frans</strong>’sinterest, his initiatives and contributions to the methodological side <strong>of</strong> historical demography.A second issue that is <strong>of</strong> special interest to <strong>Frans</strong> <strong>van</strong> <strong>Poppel</strong> is the description and explanation<strong>of</strong> differential fertility and nuptiality patterns and reproductive behavior, in particular by
social class and religious affiliation. The essays <strong>of</strong> Hans Knippenberg and Sjoerd de Vos, JanVan Bavel and Aart Liefbroer particularly reflect on this. <strong>Frans</strong> <strong>van</strong> <strong>Poppel</strong>’s dissertation onmarriage in 19 th and early-20 th century Netherlands became a classic on nuptiality. Severalcontributions highlight this fact and deal with nuptiality issues: The papers <strong>of</strong> Shuang Chen,James Lee and Cameron Campbell, Hilde Jåstad and Gunnar Thorvaldsen, Pim Kooij, InekeMaas, Marco <strong>van</strong> Leeuwen and Richard Zijdeman, Jona Schellekens and Tony Wrigley.Regarding research on mortality –and again, it’s social and economic differentials–, it maybe stated that the contributions <strong>of</strong> Tommy Bengtsson, Martin Dribe, Bertie Lumey, JohanMackenbach, Michel Oris and Mathias Lerch, Diego Ramiro-Fariñas, David Reher andWillibrord Rutten show the wide range <strong>of</strong> topics <strong>Frans</strong> <strong>van</strong> <strong>Poppel</strong> has dealt with in this type<strong>of</strong> research, for instance the effects <strong>of</strong> childbearing on health and longevity, fetal and neonatalmortality, and the impact <strong>of</strong> heat waves and seasonality on mortality in past, present andfuture.The editors would like to take the opportunity to thank all contributors. It was a great honorand pleasure to work with you to make this <strong>Liber</strong> <strong>Amicorum</strong> possible in such a short time span.We hope that this volume which, as mentioned before, reflects in our opinion an importantpart <strong>of</strong> <strong>Frans</strong> <strong>van</strong> <strong>Poppel</strong>’s considerable contribution to historical demography, will be read bymany people with great pleasure and interest and for some researchers even might be a source<strong>of</strong> inspiration for new research.The editors express their appreciation to Leo <strong>van</strong> Wissen and Nico <strong>van</strong> Nimwegen forencouraging and supporting this initiative from the very start. We thank Jeannette <strong>van</strong> der Aarand Jacqueline <strong>van</strong> der Helm for their technical support.Erik Beekink and Evelien WalhoutNovember 20129
Part IScope and Impact
Publication record<strong>Frans</strong> is a prolific author. Just over 300 publications carry his name. Of these 10 count as abook, 82 are articles published in an internationally refereed journal and the remainder haveappeared in a national journal, an edited volume, or less scholarly outlet. One <strong>of</strong> the mainpurposes <strong>of</strong> adding <strong>Frans</strong> to <strong>NIDI</strong>’s staff was for the institute to stay in touch with the manypeople in the country and abroad whose work had a distinct historical focus or who did notfit in mainstream demography. From examining <strong>Frans</strong>’s publication record it can only beconcluded that he has been extremely successful in covering these areas <strong>of</strong> interest. He hasdone the institute a great service by developing and maintaining an extensive network <strong>of</strong>scholarly contacts and by joining initiatives to collect data or records for special archives ordatabases. His willingness to work with others is quite apparent if one counts the number<strong>of</strong> people he wrote at least one publication with. Our common friend Yves de Roo let hiscomputer make the counts for me. The result shows that during his career <strong>Frans</strong> has hadno fewer than 375 co-authors with almost 150 unique names. The colleagues he publishedwith most frequently were Peter Ekamper (18) and Aat Liefbroer (16) both <strong>of</strong> <strong>NIDI</strong> andthe historian Kees Mandemakers (16) <strong>of</strong> the Academy Institute IISG. With another <strong>NIDI</strong>colleague, Hanna <strong>van</strong> Solinge, he collaborated for a publication 11 times. It would havepleased Muntendam to see that immediately following these social scientists the medialresearcher, Johan Mackenbach, features in 5 th place on the list with 10 joint publications.All in all <strong>Frans</strong> was single author in almost 30 per cent <strong>of</strong> the cases and first author in nearly58 per cent. With almost 40 researchers he worked together on more than three occasions,while with the remaining hundred or so (102) he wrote a joint paper only once or twice.The list <strong>of</strong> names <strong>of</strong> co-authors is not simply long and impressively varied; it also containsinternationally well respected names. For example, <strong>of</strong> Jona Schellekens, Lincoln Day, DavidReher, Tapani Valkonen, George Alter and George Stolnitz. <strong>Frans</strong> would seem to have had acertain preference for surnames beginning with a B (18) or an S (17) but perhaps these peoplesimply selected themselves.Fields <strong>of</strong> researchIt is fair to say that a person’s bibliography also is bound to reflect his or her main researchinterests. In the case <strong>of</strong> <strong>Frans</strong> two broad areas in particular deserve attention. Marriage andfertility is the first area and the study <strong>of</strong> mortality the second. <strong>Frans</strong>’s magnum opus is hisbook <strong>of</strong> 1992 on marrying in the Netherlands during the 19 th and early 20 th centuries. The bookyielded him a doctorate from the Agricultural University <strong>of</strong> Wageningen and the distinctioncum laude. To put the matter in perspective, it is 655 pages long and in present day termswould be worth about three Ph.D’s. The book is a lasting monument and will be consulted byscholars long after <strong>Frans</strong>’active involvement in population studies has come to an end. When,the other day, I took it <strong>of</strong> it’s shelf the sheets with the questions I put to <strong>Frans</strong> as a member<strong>of</strong> his promotion committee fell out. I had written them down carefully. Apparently my mainconcern was that while over time one may calculate demographic rates or ratios in exactly thesame fashion, their meaning might have changed significantly in one and a half century: Think<strong>of</strong> extra-marital fertility! As far as I can recollect <strong>Frans</strong> agreed that the concepts <strong>of</strong> marriageand divorce also underwent changes during the 150 years or so he had looked at but not quiteto the same extent. In any case, in subsequent papers he characteristically studied all <strong>sort</strong>s14
<strong>of</strong> further aspects <strong>of</strong> marriage, divorce and fertility. Let me just mention the questions <strong>of</strong> theseasonality <strong>of</strong> marriage, the remarriage <strong>of</strong> widowers, the effects <strong>of</strong> changes in legislation ondivorce, <strong>of</strong> the role <strong>of</strong> health selection in the marital transition, <strong>of</strong> the behaviour <strong>of</strong> widowersin a small city, <strong>of</strong> changes in the proper age <strong>of</strong> marriage, in the degree <strong>of</strong> homogamy and <strong>of</strong>the problems encountered when trying to overcome the death <strong>of</strong> one <strong>of</strong> the marrriage partners.It is a rich display <strong>of</strong> topics and interests and the collaboraters tend to change with the issue.If one consults an international database on mortality, chances are that one finds a note thatthe data on the Netherlands have been supplied by <strong>Frans</strong> <strong>van</strong> <strong>Poppel</strong>. And indeed, togetherwith several others <strong>Frans</strong> has done his utmost to try and construct cohort and period life tablesfrom the earliest possible date. I have always found the two estimates <strong>of</strong> life expectancyat birth for the first half <strong>of</strong> the 19 th century very useful in illustrating the magnitude <strong>of</strong> thechanges in the last decades. For the years 1827-1828 life expectancy at birth in the Netherlandsapparently only reached 36.6 years while for 1840-1851 it may even have been half a yearless. Just as in the case <strong>of</strong> marriage and fertility <strong>Frans</strong> has constantly sought to broaden ourhorizon and to push the boundaries <strong>of</strong> our knowledge further away. One aspect concernsdifferental mortality: How large were the differences between rural and urban areas, betweenthe sexes, between social classes, at different ages, and just after birth or when people hadbecome aged? Investigating the causes <strong>of</strong> death, changes in the state <strong>of</strong> health as self-reportedand the increase in the probability <strong>of</strong> death following the loss <strong>of</strong> a parent or a partner. Therelation between marital status and mortality also received attention, while the survival <strong>of</strong>illegitimate children in comparison to their legitimate counterparts similarly was the subject<strong>of</strong> a study. Again, just as regarding fertility and marriage, <strong>Frans</strong> gave the role <strong>of</strong> religion hisspecial attention. Did it result in differences in infant and childhood mortality? In all <strong>of</strong> thiswork, that in fact one can see grow almost organically under his hands, <strong>Frans</strong> always was onthe alert for the possibility <strong>of</strong> international comparisons and when international programmesin historical demography were being launched the organizers commonly found in <strong>Frans</strong> theirrepresentative for the Netherlands.In all <strong>of</strong> his work <strong>Frans</strong> kept an open eye for the theoretical aspects <strong>of</strong> a study and the largerframework in which the topics selected had to find their place. His extensive knowledge <strong>of</strong>population literature built up over many years <strong>of</strong> reading and acting as a <strong>sort</strong> <strong>of</strong> custodian <strong>of</strong>the <strong>NIDI</strong> library paid <strong>of</strong>f handsomely on such occasions.EpilogueI must admit that with two exceptions, that is when both <strong>of</strong> us were on the <strong>NIDI</strong> staff andwhen <strong>Frans</strong> was the Rogier pr<strong>of</strong>essor at the University <strong>of</strong> Nijmegen, I had no reason to follow<strong>Frans</strong>’s career very closely. From a certain distance I was happy to see that he was doing wellbut we never really collaborated nor wrote a paper together. Why we never did is a moot point.Curiously enough the situation suddenly changed when <strong>Frans</strong> was coming close to retirementand I was about to become an octogenarian. A few years ago Yves de Roo and I were workingon our book on the members <strong>of</strong> the Royal Academy. We then found that calculating their lifeexpectancy was both possible and illuminating in assessing their social position. Two or threeyears later it ocurred to me that one could possibly collect information on the birth and death15
Ahead, not alo<strong>of</strong>. <strong>Frans</strong> <strong>van</strong> <strong>Poppel</strong>’s contribution to agenda-settingin historical demographyJan Kok<strong>Frans</strong> <strong>van</strong> <strong>Poppel</strong> has changed the field <strong>of</strong> historical demography in two ways. First, byconstituting a monumental body <strong>of</strong> knowledge, in the form <strong>of</strong> literally hundreds <strong>of</strong> articles,book chapters, monographs and edited volumes. His scientific output is, and undoubtedlywill remain, an essential source for all those seeking information on family and demographicbehavior in the past. Second, by inspiring others to follow his lead, to take up new topics, toexplore new sources, and to experiment with new methods. In this brief essay I will focus onthe latter, and I will do so by looking back as well as by looking forward. Looking at the pastdecades, how has <strong>Frans</strong> achieved to move the field, and in what directions? And how does hiswork constitute a challenge for the next generation <strong>of</strong> historical demographers?Differential demographySpeaking for myself, but surely also for many others –both in the Netherlands and abroad-, Ithink that <strong>Frans</strong> <strong>van</strong> <strong>Poppel</strong> has been exemplary by his choice <strong>of</strong> topics, his typical mixture<strong>of</strong> qualitative and quantitative approaches, his quest for new data, and finally, his researchcollaborations. In terms <strong>of</strong> topics, <strong>Frans</strong> has early and consistently made the choice towork on differential demography. Until well into the 1980 s , historical demography in theNetherlands had been focused on mapping and contrasting locally and regionally aggregateddata, in order to understand the epidemiological and fertility transitions <strong>of</strong> the 19 th and20 th centuries. <strong>Frans</strong> set out to decompose these aggregates into their smallest componentspossible, with a clear preference for the level <strong>of</strong> the individual. Although his work frequently<strong>of</strong>fers an introduction on spatial differences and trends, the apotheosis is more <strong>of</strong>ten thannot an elaborate multivariate model showing how demographic behavior differed by socialclass, church denomination, and household composition. Moreover, he also integrates periodeffects in his models, such as food crises (e.g. the Famine <strong>of</strong> 1944/1945), GDP per capita,unemployment rates and even temperature. His work proved, among others, that religion andsocial class exerted autonomous influences on all aspects <strong>of</strong> behavior.However, <strong>Frans</strong> was also quick in recognizing that the behavior <strong>of</strong> individuals had to beplaced squarely in their social networks. This led him, for example, to explore genealogiesto reconstruct kinship networks, and to use the witnesses on marriage certificates to studythe networks <strong>of</strong> Jews and Christians in The Hague (Van <strong>Poppel</strong> and Schoonheim, 2005). Inhis choice <strong>of</strong> topics, <strong>Frans</strong> has managed to straddle both (social) history and demography,thus keeping open the dialogue between these disciplines and countering a trend <strong>of</strong> academicfragmentation and disassociation. On the one hand, and naming just a few examples, <strong>Frans</strong>has contributed to social history by his studies <strong>of</strong> the ‘housewife ideal’, the institutionalization<strong>of</strong> the elderly, social mobility, the history <strong>of</strong> leaving home (in international perspective), thestudy <strong>of</strong> naming practices, and the fates <strong>of</strong> reformed boys, illegitimate children, permanentcelibates, and widows. On the other hand, he has taught social scientists the rele<strong>van</strong>ce <strong>of</strong> the17
ever-changing societal and normative context <strong>of</strong> behavior and the need to adopt a long-termperspective.Suggesting research topics is one thing, coming up with convincing results is quite another.<strong>Frans</strong>’s results appeal to a wide audience (going beyond historians and demographers)because <strong>of</strong> his mixed methods approach. His hypotheses are well-grounded in the literature,including 19 th century medical reports, government enquiries, ethnographic material, andegodocuments. They are tested on representative datasets, <strong>of</strong>ten the result <strong>of</strong> painstaking datacollection, in many cases by <strong>Frans</strong> himself. Finally, the analytic handling <strong>of</strong> the data hasalways been –as far as I can see– <strong>of</strong> great quality. His dissertation on marriage and divorceshows his great love for history and literary sources in the detailed analysis <strong>of</strong> contemporarydebates between politicians, church <strong>of</strong>ficials, social reformers, and eugenicists on the ‘proper’age to marry. Popular attitudes to marriage are studied through regional customs, proverbsand may other sources. In the same book, however, <strong>Frans</strong> tackles the regional variation inmarriage in a linear regression model, and goes on to study remarriage hazard ratios in one <strong>of</strong>the first event history analyses to be performed in Dutch historical demography (Van <strong>Poppel</strong>,1992). Another example <strong>of</strong> his sophisticated mixed methods approach is his study with HugoRöling on contraceptive behavior <strong>of</strong> medical doctors, in which they combined a history <strong>of</strong>debates on contraceptive techniques with family reconstitutions <strong>of</strong> a large number <strong>of</strong> medicalpr<strong>of</strong>essionals in Holland. They showed that although doctors were clearly pioneers <strong>of</strong> birthcontrol in their private lives, concerns for the respectability <strong>of</strong> their pr<strong>of</strong>ession preventedthem from openly advocating neo-Malthusianism (Van <strong>Poppel</strong> and Röling, 2003).The success <strong>of</strong> <strong>Frans</strong>’s research stems –in part– from his fine nose for data. In his earlier work,historical census data still played a large role, but <strong>Frans</strong> soon cast his net wide to includesources as diverse as cause-<strong>of</strong>-death statistics, collections <strong>of</strong> marital records (e.g. Gouda),automatically reconstituted family trees (GenLias), archives <strong>of</strong> churchyards, interviewswith priests and parishioners, and complete life course reconstructions <strong>of</strong> regional or evennational samples <strong>of</strong> individuals. This could imply, as in the case <strong>of</strong> the Historical Sample <strong>of</strong>the Netherlands, a long-term involvement in organization, quality control and dissemination<strong>of</strong> the specific data infrastructure.Agenda-settingHis success can also be attributed to his ability to collaborate across disciplines, generationsand frontiers. Until recently, historians kept very much to themselves, in terms <strong>of</strong> data andmethods. The ‘collaborative model’, as shown by <strong>Frans</strong>, expanded the scope and rele<strong>van</strong>ce <strong>of</strong>historical work through the fine-tuning <strong>of</strong> hypotheses and results, incorporating specializedknowledge (e.g. on statistical modeling), and allowing for large scale or comparative research.A recent example is the special issue by <strong>Frans</strong> and Tommy Bengtsson in Explorations inEconomic History (2011) on change over time in social class differences in child and adultmortality. They refute conventional wisdom by showing that, for a long time, high incomeand high social status were not consistently translated into health benefits. Even more recentis his cooperation with Spanish authors (Van <strong>Poppel</strong> et al., 2012) who had demonstrated thatchild survival affected fertility decisions in pre-transition populations. By replicating their18
approach on Dutch data, <strong>Frans</strong> showed on the one hand that this association appears to beuniversal, on the other hand that the effects differed strongly by social and religious group,reflecting strong socio-cultural differences in self-agency.In all these aspects <strong>of</strong> historical-demographic research, <strong>Frans</strong> was ahead <strong>of</strong> the rest. Yet, heclearly never was ‘alo<strong>of</strong>’ – he never distanced himself from the other players in the field.As supervisor <strong>of</strong> trainees, peer reviewer, commentator at conferences, co-promotor <strong>of</strong> Ph.D.students, editor <strong>of</strong> journals, board member <strong>of</strong> organizations and in many other ways, <strong>Frans</strong>has encouraged others to take up the fascinating subject <strong>of</strong> family and population history. Tosummarize: <strong>Frans</strong>’s track record <strong>of</strong> agenda-setting amounts to exploring promising researchfields, demonstrating the added value <strong>of</strong> mixed methods, investing in data infrastructure, andsetting high quality standards.However, <strong>Frans</strong> is only human. There are still areas he has hardly touched upon. Actually,some fields may have been relatively underdeveloped by the concentration <strong>of</strong> <strong>Frans</strong> and otherhistorical demographers on the topics mentioned above. Firstly, <strong>Frans</strong> has dedicated most <strong>of</strong>his energy to the demography <strong>of</strong> the Netherlands in the data-rich period after 1850. There arestill many issues to be addressed in the earlier period. For instance, when and how did thepositive association between wealth and family size disappear? Secondly, although studieson migration are not absent in <strong>Frans</strong>’s publication list, he has refrained from systematicallylinking migration to other aspects <strong>of</strong> demography, such as fertility or mortality. Finally, <strong>Frans</strong>is not a ‘system-builder’. In most <strong>of</strong> his work, he seems to studiously avoid holistic conceptssuch as ‘demographic regime’ or ‘family system’. Also, he is not engaging (probably forgood reasons) in debates with, for instance, those economists who seek to explain the greattransformation <strong>of</strong> the nineteenth century in the form <strong>of</strong> a Unified Growth Theory that linksthe industrial revolution to fertility and mortality decline.What next?Although <strong>Frans</strong> will hopefully remain active for a very long time, the occasion for which thisessay was written begs the question: What next? What are now the challenges for historiansand demographers? For historians, <strong>Frans</strong> <strong>of</strong>fers, firstly, a puzzling array <strong>of</strong> subtle differencesin behavioral responses between occupational and religious groups and, secondly, a set <strong>of</strong>compelling questions on long-term change. Referring to the first, the next generations willhave to dig deeper still. Thus, we need to find out how the assumed differences in attitudesand outlook between Catholics and (<strong>Liber</strong>al) Protestants have emerged, and how they couldpersist over time. What is the role <strong>of</strong> social control mechanisms in this respect? Also, thedistinctions by socio-occupational group identified by <strong>Frans</strong> may hide other, possibly evenmore important fissures in society. How does the picture change once we compare lifecourses by education, income, property, or even expectations <strong>of</strong> inheritance? Referring to thesecond, <strong>Frans</strong>’s studies suggest that change in demographic behavior is more influenced bysocio-economic factors than by cultural/ideational ones, thus adding to the growing critique<strong>of</strong> diffusionist models. In a recent article (Schellekens and Van <strong>Poppel</strong>, 2010) it is arguedthat mortality decline coupled with the rise in real wages are the most important factorsin explaining the Dutch fertility decline before 1940. However, it is still not clear how the19
supposed ‘quality-quantity trade-<strong>of</strong>f’ functioned at the level <strong>of</strong> individual couples. Moreover,<strong>Frans</strong>’s analyses <strong>of</strong> nineteenth century demography need to be integrated into new narrativesfor non-specialist audiences. For instance, what do <strong>Frans</strong>’s findings on social mobility,networks and social group differences in mortality and fertility tell us about class formationduring Dutch industrialization? Can we translate <strong>Frans</strong>’s remarkable findings on the lifeexpectancy <strong>of</strong> widows and orphans to a new vision on Dutch welfare? And, finally, how do<strong>Frans</strong>’s finding on strongly internalized religious norms affect our view on the meaning <strong>of</strong>Pillarization?History mattersFor demographers, <strong>Frans</strong>’s legacy is clear: History matters. And it does so in at least threeways. First, <strong>Frans</strong>’s recent work on family composition <strong>of</strong> adolescents in the past 150 yearshas shown the rele<strong>van</strong>ce <strong>of</strong> taking the long view. The current experience <strong>of</strong> growing up inbroken families is mirrored by the many (semi-)orphans in the past (Van Gaalen and Van<strong>Poppel</strong>, 2009). Clearly, the 1950 s do not represent ‘traditional’ Dutch society. If anything,the period 1945-1965 was probably the most ‘untypical’ period in Dutch recent historywith respect to family life. The great challenge <strong>of</strong> historical demography, as demonstratedexemplarily in <strong>Frans</strong>’s work, is to show and understand precisely when demographic behaviorcan be understood in terms <strong>of</strong> continuity, and when it is subject to change. Secondly, theadded value <strong>of</strong> the longitudinal perspective in <strong>Frans</strong>’s demographic analyses is clear; peopleact on past experiences and we cannot understand demographic events in isolation fromearlier ones. Finally, history serves as an ideal laboratory for testing socio-biological aspects<strong>of</strong> demography; e.g. determinants <strong>of</strong> starting, stopping and spacing in a non-contraceptiveenvironment, or the intergenerational transmission <strong>of</strong> behavior (as <strong>Frans</strong> has done on the ageat marriage (Van <strong>Poppel</strong>, Monden and Mandemakers, 2008)).It is to be hoped that historical demographers will take up this challenge and pursue researchalong the lines suggested by <strong>Frans</strong> <strong>van</strong> <strong>Poppel</strong>. Preferably, by expanding into the more distantpast as well. Above all, let’s hope that future generations will be able to work in the true‘<strong>Poppel</strong>ian’ spirit. That is, by tackling the research questions with a balanced mixture <strong>of</strong>qualitative and quantitative content, soundly embedding them in the literature, formulating aclear body <strong>of</strong> testable hypotheses, cautiously interpreting results, and where possible, workingin a truly interdisciplinary setting.ReferencesBengtsson, Tommy and <strong>Frans</strong> <strong>van</strong> <strong>Poppel</strong> (2011), Socio-economic inequalities in death from past topresent: An introduction. Explorations in Economic History, 48(3), pp. 343-356.Gaalen, Ruben <strong>van</strong> and <strong>Frans</strong> <strong>van</strong> <strong>Poppel</strong> (2009), Long-term changes in the living arrangements <strong>of</strong> childrenin the Netherlands. Journal <strong>of</strong> Family Issues, Vol. 30(5), May, pp. 653-669.<strong>Poppel</strong> F. <strong>van</strong> (1992), Religion and health: Catholicism and regional mortality differences in 19 th centuryNetherlands. Social History <strong>of</strong> Medicine, Vol. V, nr. 2, August , pp. 229-253.<strong>Poppel</strong>, <strong>Frans</strong> <strong>van</strong> and Hugo Röling (2003), Physicians and fertility control in the Netherlands. Journal <strong>of</strong>Interdisciplinary History, 34(2), Autumn, pp. 55-18520
<strong>Poppel</strong>, <strong>Frans</strong> <strong>van</strong> <strong>Poppel</strong> and Marloes Schoonheim (2005), Measuring cultural differences betweenreligions with network data. An example based on 19 th century Dutch marriage certificates. Annales deDémographie Historique, 1, pp. 173-197.<strong>Poppel</strong>, <strong>Frans</strong> <strong>van</strong>, Christiaan Monden and Kees Mandemakers (2008), Marriage timing over thegenerations. Human Nature, 19(1), pp. 7-22.<strong>Poppel</strong>, <strong>Frans</strong> <strong>van</strong>, David S. Reher, Alberto Sanz-Gimeno and Maria Sanchez Dominguez (2012),Mortality decline and reproductive change during the Dutch demographic transition: Revisiting atraditional debate with new data. Demographic Research (in press).21
The impact <strong>of</strong> a historical demographer: A bibliometric approachGeorge AlterSince historical demography is a quantitative discipline, it may be interesting to examinequantitative measures <strong>of</strong> our colleague <strong>Frans</strong> <strong>van</strong> <strong>Poppel</strong>’s impact on science. The development<strong>of</strong> citation indexes has resulted in the emergence <strong>of</strong> bibliometrics, a set <strong>of</strong> methods designed toanalyze publication patterns in the scientific literature. This brief excursion into bibliometricsis intended to demonstrate how broad and important the contributions <strong>of</strong> our friend andcolleague have been.The most common way to measure influence in bibliometric analysis is by counting citations.The underlying assumption is that scholars are most likely to cite work that they consideroriginal and important. A prominent example <strong>of</strong> bibliometrics is the ‘Journal Impact Factor’,which is published by Thomson Reuters as part <strong>of</strong> their Journal Citation Reports®. JournalCitation Reports have been published since 1975, when they were based on the ScienceCitation Index® and the Social Sciences Citation Index®. These indexes were created bythe Institute for Scientific Information® (ISI), which was acquired by Thomson Reuters in1994. The Science Citation Index, the Social Sciences Citation Index, and similar databasescovering the arts, humanities, and biomedical research are now included in a single productknown as the Thomson Reuters Web <strong>of</strong> Knowledge® (also known as ISI Web <strong>of</strong> Science®).The measures used here are derived from Web <strong>of</strong> Knowledge and two other citation databases(Scopus and Google Scholar).These three databases index enormous numbers <strong>of</strong> publications, but that does not assurethat they will produce the same results. Web <strong>of</strong> Knowledge is the oldest service, and itincludes journal articles back to 1900 (Thomson Reuters Online source). However, theselection <strong>of</strong> journals in Web <strong>of</strong> Knowledge is more limited and more focused on Englishlanguage journals than other products. Scopus, which is owned by publisher Elsevier, claimsa larger list <strong>of</strong> journals and a wider international scope (Elsevier Online source). Both Web<strong>of</strong> Knowledge and Scopus begin with peer-reviewed journals, but they have added otherpublications, including books and conference proceedings. Google Scholar grows out <strong>of</strong> theGoogle search engine, and it indexes papers on individual websites and other web contentas well as publications (Google Online source). Micros<strong>of</strong>t is developing a competitor calledAcademic Search, which is still in ‘beta’ testing.The first problem in assembling a bibliometric analysis is assuring that we have identifiedthe publications belonging to the person <strong>of</strong> interest. This process, known as disambiguation,involves filtering out publications that belong to other people with the same name. Fortunately,“<strong>van</strong> <strong>Poppel</strong>” is not a common academic name. A search for “<strong>van</strong>poppel f*” in Web <strong>of</strong>Knowledge returned 12 record sets, which could be 12 different people. Most <strong>of</strong> these recordspoint to publications by our colleague, but it is necessary to filter out some articles, such asthe 1993 article on “Scraper Systems in Pig Houses” published by a different F. <strong>van</strong> <strong>Poppel</strong>.22
Both Scopus and Google Scholar had already used other information to consolidate all <strong>of</strong> therele<strong>van</strong>t records under a single identity.As bibliographic databases become more important, there is an active movement to assignidentification numbers to individual scholars. Thomson Reuters encourages authors to createa ResearcherID, which allows them to establish pr<strong>of</strong>iles and claim their own publicationsin the Web <strong>of</strong> Knowledge database. The Scopus Author ID has similar functions in thatdatabase. Both Thomson Reuters and Scopus have connected their internal author ID systemsto the ORCID registry. ORCID (Open Researcher and Contributor ID) is a non-pr<strong>of</strong>it groupfounded to create a central registry <strong>of</strong> unique identifiers for individual researchers and to linkindividuals across existing ID schemes (ORCID Online source). In the future, ORCID orsomething like it will probably connect to record systems at universities and funding agencies.Table 1 displays the results <strong>of</strong> our bibliographic searchers. Web <strong>of</strong> Knowledge, which searchesthe most restricted collection, identified 49 publications that were cited 523 times. Scopusfound 75 publications and 725 citations. Google Scholar returned 145 publications and 1,440citations, but this includes many duplicates. Since Google Scholar counts each version <strong>of</strong> anarticle separately, a single work may be counted several times (e.g. conference presentation,online working paper, journal article, et cetera). We also learn that Pr<strong>of</strong>essor <strong>van</strong> <strong>Poppel</strong> haspublished with more than 80 co-authors (most <strong>of</strong>ten with Johan P. Mackenbach and Aart C.Liefbroer) and in at least 43 different journals (most <strong>of</strong>ten in Population Studies, Annales deDémographie Historique, and The History <strong>of</strong> The Family). His most cited publications are ‘Alongitudinal study <strong>of</strong> health selection in marital transitions’ (Joung et al., 1998), ‘Differencesin self-reported morbidity by marital-status and by living arrangement’ (Joung et al., 1994),and ‘A test <strong>of</strong> Durkheim's theory <strong>of</strong> suicide – Without committing the ‘ecological fallacy’’(Van <strong>Poppel</strong> and Day, 1996). According to Web <strong>of</strong> Knowledge, the authors who have citedhim the most are L.H. Lumey, J.P. Mackenbach and A.C. Liefbroer, and he has been citedmost in Social Science and Medicine, History <strong>of</strong> the Family, Journal <strong>of</strong> Epidemiology andCommunity Health, and Demographic Research.Although they differ in coverage, the citation indexes provide a consistent picture <strong>of</strong> theinfluence <strong>of</strong> Pr<strong>of</strong>essor <strong>van</strong> <strong>Poppel</strong>’s work. All <strong>of</strong> them show an average <strong>of</strong> ten citations perpublication (10.7, 9.7, 9.9). Moreover, his publications hold up over time. For example,among the 55 citations counted by Web <strong>of</strong> Knowledge in 2011, 31 refer to articles publishedbefore 2000. Others in this volume will comment on the quality <strong>of</strong> our colleague’s empiricalTable 1. Results <strong>of</strong> publication and citation searches for <strong>Frans</strong> <strong>van</strong> <strong>Poppel</strong>Source Publications Co-authors Number <strong>of</strong> times cited Citations per publicationWeb <strong>of</strong> Knowledge 49 523 10.7Scopus 75 84 725 9.7Google Scholar 145 1,440 9.923
and theoretical contributions, but the quantitative evidence is clear. <strong>Frans</strong> <strong>van</strong> <strong>Poppel</strong> has hada major impact on the course <strong>of</strong> scholarship in historical demography, and we can expect thatinfluence to be reflected in citations to his work for many years to come.ReferencesElsevier (Online source) Scopus: http://www.info.sciverse.com/scopus (accessed October 28, 2012).Google (Online source) Google Scholar: http://scholar.google.com/intl/en/scholar/about.html (accessedOctober 26, 2012).Joung, I.M.A., H.D. <strong>van</strong> de Mheen, K. Stronks, F.W.A. <strong>van</strong> <strong>Poppel</strong> and J.P. MacKenbach (1998), Alongitudinal study <strong>of</strong> health selection in marital transitions. Social Science & Medicine, 46, pp. 425-435.Joung, I.M.A., H. <strong>van</strong> de Mheen, K. Stronks, F.W.A. <strong>van</strong> <strong>Poppel</strong> and J.P. Mackenbach (1994), Differencesin self-reported morbidity by marital-status and by living arrangement. International Journal <strong>of</strong>Epidemiology, 23, pp. 91-97.<strong>Poppel</strong>, F. <strong>van</strong> and L.H. Day (1996), A test <strong>of</strong> Durkheim’s theory <strong>of</strong> suicide – without committing theEcological Fallacy. American Sociological Review, 61, pp. 500-507.ORCID (Online source) About Orcid: http://about.orcid.org/ (accessed October 28, 2012).Thomson Reuters (Online source) Web <strong>of</strong> Knowledge: http://wokinfo.com/products_tools/multidisciplinary/web<strong>of</strong>science/ (accessed October 28, 2012).24
On the occasion <strong>of</strong> the retirement <strong>of</strong> <strong>Frans</strong> <strong>van</strong> <strong>Poppel</strong>Simon Szreter<strong>Frans</strong> <strong>van</strong> <strong>Poppel</strong> has had a wonderfully productive career during which he has surely becomethe premier historian <strong>of</strong> demography and the family in modern Dutch history.His approach has been distinguished by his methodological diversity and preparedness toembrace the insights and knowledge that can come from all forms <strong>of</strong> evidence in additionto the quantitative information which he has analysed so resourcefully in so many distinctstudies.It was precisely this liberal-minded open-ness which I found so appealing when talking with<strong>Frans</strong> over twelve years ago about the new oral history research on contraceptive practicesthat I was engaged in with Kate Fisher when we encountered each other in the bar at one<strong>of</strong> the many SSHA conferences, which we have each regularly attended over the years. Iremember that <strong>Frans</strong> was immediately very enthusiastic and it was he who was quick topropose that we should consider some form <strong>of</strong> collective publication along with others doingcomplementary quantitative and qualitative research on the contraceptive aspects <strong>of</strong> fertilitydeclines in a number <strong>of</strong> countries. From this meeting was quickly born the idea for a session asat a subsequent SSHA meeting – in Chicago in 2001. This session was a great opportunity tobring together historians <strong>of</strong> fertility and birth control who focused on the cultural, ideologicaland political history <strong>of</strong> the subject in diverse countries <strong>of</strong> Europe along with others examiningcontemporary qualitative material collected by social-feminist activists in Scandinavia aswell as interview-derived, ‘new’ historical evidence from Quebec and Britain. All <strong>of</strong> this wasachieved in the six articles published together in the Journal <strong>of</strong> Interdisciplinary History asIssue Number 2 <strong>of</strong> Volume 34 in 2003. <strong>Frans</strong> was also instrumental in recruiting the greatFrench cultural historian, Robert Nye, to our discussant and editorial team, also a person whowas a great pleasure to work with.<strong>Frans</strong>’s own contribution was an excellent piece perfectly exemplifying the special issue’smain methodological proposal regarding the gains to knowledge to be had from combiningtogether both quantitative and qualitative sources <strong>of</strong> evidence. Together with Hugo Röling,<strong>Frans</strong> demonstrated how Dutch doctors maintained a careful public face <strong>of</strong> reticence on allmatters to do with birth control, while nevertheless engaging very effectively in private inrigorous reduction <strong>of</strong> their own family sizes. I recall a particular glimmer <strong>of</strong> pleasure in<strong>Frans</strong>’s eyes and a broad grin as he presented to us in Chicago the evidence <strong>of</strong> such systematichypocrisy among these powerful members <strong>of</strong> a previous generation.<strong>Frans</strong> is a very warm and generous individual who has always spontaneously emitted a greatsense <strong>of</strong> fun in what he does, as on this occasion in Chicago. I hope –and am certain– that wewill continue to see a lot more <strong>of</strong> this over the coming years.25
Part IIData and Methods
The census and the historical demographerPeter Doorn‘The census tells us who we are and where we are going as a nation’, the United States CensusBureau tells us, and: “A census tells us not only about our past, but it can help us prepare forour future”. 1 Both statements make it clear why censuses are such an interesting source fordemographic and socio-economic research. If the current census tells us where we are going,past censuses tell us where we once thought we were going. Or, as the American census putsit: “So, how do we know about our nation? To better understand where we came from, let’stake a look back at what America was like during the first census.”Historical demographers can use such old censuses to ‘predict the past’. They andsocio-economic historians were the main target groups we had in mind when we started aproject back in 1996 to digitize the Dutch historical censuses from the first national one in 1795till the last traditional census held in our country in 1971. In 1981 and 1991, no census washeld in the Netherlands, mainly because <strong>of</strong> a (feared) lack <strong>of</strong> cooperation by the population.And from 2001 onwards, Statistics Netherlands (Centraal Bureau voor de Statistiek, CBS)organised virtual censuses based on linked <strong>of</strong>ficial registrations, with added information froma number <strong>of</strong> surveys. 2 Also in the early years there were gaps in the sequence <strong>of</strong> censuses.Since 1830 about every ten years a census was published; the Second World War causeda disruption and irregular census years (1947, 1956). It must be mentioned here, that theoriginal counting forms <strong>of</strong> the Dutch censuses have regrettably not been preserved. Only for1960 and 1971 we can avail <strong>of</strong> anonymized micro-level census information. For these yearsthe computer files have been preserved, be it that the 1960 files are not entirely complete. 3The census is indeed a basic source <strong>of</strong> information about the state <strong>of</strong> the nation, and as suchit seems to have great value for historical demographic research. Although it is a rich datasource, it also clearly has its limitations. Over his career, it seems that <strong>Frans</strong> <strong>van</strong> <strong>Poppel</strong> hasgradually moved away from using censuses as a prime source in favour <strong>of</strong> other sources forhis research. Other sources that are (1) longitudinal and (2) individual, in particular supplyinginformation on the changing position <strong>of</strong> the individual in the household, and on his or herhealth (and eventual death).1Explanation on the website <strong>of</strong> the US Census Bureau <strong>of</strong> what a census is good for. See: http://www.census.gov/2Eric Schulte Nordholt, Marijke Hartgers and Rita Gircour (eds. 2004), The Dutch Virtual Census <strong>of</strong> 2001: Analysis andMethodology (Statistics Netherlands, Voorburg/Heerlen), p. 276.3About 300,000 records are missing; for an extensive report see: Michelle <strong>van</strong> den Berk and Peter Doorn (2007), ‘Eendigitale detective story: de reconstructie <strong>van</strong> de Nederlandse Volkstelling <strong>van</strong> 1960’, in: Twee eeuwen Nederlandgeteld: onderzoek met de digitale Volks- Beroeps- en Woningtellingen 1795-2001, ed. by O.W.A. Boonstra et al. (DenHaag, 2007) pp. 471-487. An English version <strong>of</strong> this paper ‘Reconstruction <strong>of</strong> the digital Dutch Populations Census <strong>of</strong>1960’ is available on http://www.volkstellingen.nl/en/documentatie/1960/index.html28
Early in his career, <strong>Frans</strong> was co-author <strong>of</strong> one <strong>of</strong> the eighteen monographs published on thebasis <strong>of</strong> the 1971 census. 4 This monograph focused on nuptiality patterns in the Netherlands,starting with an extensive historical analysis, based on the censuses since 1889. Of course thetables were not yet available in digital form at that time, so I assume that <strong>Frans</strong> had to key inthe data he needed from the published census books himself. Of the last population censuses(1960 and 1971, and also <strong>of</strong> the economic censuses since the 1930 s as well), more detailedinformation than ever published survived, which is available in original hand-written form ontransparencies in the CBS archives, <strong>of</strong> which a copy was made for use in the CBS library. 5 Inthe past few years, many <strong>of</strong> these fragile originals have been scanned, and part <strong>of</strong> the tableshave also been transcribed as tables and are now available online. 6The Dutch census <strong>of</strong> 1899 was one <strong>of</strong> the most extensively published censuses, and it wasthe first census that became available in the form <strong>of</strong> about 10,000 pages <strong>of</strong> digital tablesin 1999. 7 It was only natural to invite <strong>Frans</strong> as one <strong>of</strong> the authors <strong>of</strong> a volume <strong>of</strong> articlesthat was produced on the occasion. 8 In his contribution, <strong>Frans</strong> describes how the Dutchpopulation developed from 5.1 million in 1899 to 16 million a century later. But already thenit is apparent that the census was in itself not rich enough for him, and that he used a variety<strong>of</strong> other sources as well, ranging from annual reports <strong>of</strong> the Central Statistical Committee tomortality tables and genealogical data.A few years later, in 2006, we managed to publish the tables <strong>of</strong> the remaining census yearsonline. A symposium organised on that occasion brought together a substantial group<strong>of</strong> specialists, both from Statistics Netherlands and from the academic community <strong>of</strong>socio-economic historians and historical demographers. The ultimate aim was to producea second book <strong>of</strong> papers on two centuries <strong>of</strong> the Netherlands in numbers. Of course, <strong>Frans</strong>was also invited. Although we tried to seduce him to collaborate in almost heart-breakingways, he politely declined. He only could contribute if he were allowed to base himself onthe population register, without using any census data at all. 9 Here the breach between thedemographer and the census was complete.4Frinking, G.A.B. and <strong>Poppel</strong>, F.W.A. <strong>van</strong>, Een sociaal-demografische analyse <strong>van</strong> de huwelijkssluiting in Nederland1979 VT Monografie no. 6.5Several years ago <strong>Frans</strong> confided me that he had a number <strong>of</strong> these originals in his <strong>of</strong>fice at <strong>NIDI</strong>. I can only hope thathe has returned them since then, and if not, may his retirement be a good occasion for returning them to the CBS6The handwritten materials <strong>of</strong> the censuses <strong>of</strong> 1947, 1956 and 1960 have been scanned; the labour force census <strong>of</strong> 1947is also available as spreadsheets. See: https://easy.dans.knaw.nl/ui/datasets/id/easy-dataset:43969 or urn:nbn:nl:ui:13-ggb-xtr7The original 1999 website is accessible at http://www.volkstelling1899.nl/; this was later updated as http://www.volkstellingen.nl/nl/volkstelling/jaarview/1899/index.html; the information is archived at https://easy.dans.knaw.nl/ui/datasets/id/easy-dataset:38770 or urn:nbn:nl:ui:13-988-0dq8<strong>Frans</strong> <strong>van</strong> <strong>Poppel</strong> (2001), ‘Van vijf naar 16 miljoen. De groei <strong>van</strong> de Nederlandse bevolking in de afgelopen eeuw’, in:J.G.S.J. <strong>van</strong> Maarseveen en P.K. Doorn (eds.), Nederland een eeuw geleden geteld. Een terugblik op de samenlevingrond 1900 (IISG, Amsterdam), pp. 65-87.9E-mail correspondence between Jacques <strong>van</strong> Maarseveen, Luuk Schreven, René <strong>van</strong> Horik and <strong>Frans</strong> <strong>van</strong> <strong>Poppel</strong>,November 2006.29
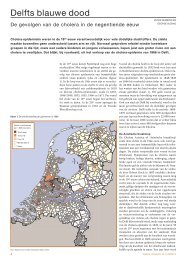
Is the role <strong>of</strong> censuses for historical demographers like <strong>Frans</strong> over? The census seems to havebecome less en vogue as a source <strong>of</strong> demographic research. Of course it still provides a lot <strong>of</strong>background information or reference data. Direct data from vital statistics registries that trackall births and deaths, as well as certain changes in legal status such as marriage, divorce, andmigration (registration <strong>of</strong> place <strong>of</strong> residence) probably <strong>of</strong>fer the best sources for estimatingthe numbers <strong>of</strong> births and deaths and are therefore perhaps more interesting sources thancensuses registry statistics. On the other hand censuses do more than just enumerate people.They typically collect information about families or households in addition to individualcharacteristics such as age, sex, marital status, literacy/education, employment status, andoccupation, and geographical location. They may also collect data on migration (or place<strong>of</strong> birth or <strong>of</strong> previous residence), language, religion, nationality (or ethnicity or race), andcitizenship.The potential <strong>of</strong> the census for socio-economic historians and historical demographers is farfrom exhausted. New ways to visualize masses <strong>of</strong> data <strong>of</strong>fer literally new views on hiddenpatterns and connections (see figure 1).Figure 1. Multi-level visualisation <strong>of</strong> the Labour Census <strong>of</strong> 1899Source: http://www.drasticdata.nl/ProjectVT/30
32Sex ratios in global historical perspective:Female surplus versus female deficitAntoinette Fauve-Chamoux 1This short paper will put in perspective some historical features <strong>of</strong> European populations,focussing on observed sex ratios and gender differences in number, according to age andvarious socio-economic and cultural contexts, which may help to trace differences betweenEurope and Indian population structures and socio-cultural behaviours in reproductionstrategies, on the long run. France is taken here as a case study.Why did Western Europe experience a frequent female surplus while the Indian continent<strong>of</strong>ten presented a female deficit, with suspicion <strong>of</strong> female neglect and infanticide? It isargued that the European female surplus <strong>of</strong> population may be related with female labourforce participation as domestic service, late marriage, frequent celibacy and an overall largerautonomy <strong>of</strong> daughters from family control concerning schooling, leaving home, migrating,finding a job and choosing a marriage partner or staying single.Overall sex ratios in early-modern European townsWhen studying pre-industrial urban population in Europe, historians understand from theavailable sources that the female population outnumbered the male population, at least sincethe Middle Ages, as Roger Mols already noticed a long time ago (Mols, 1955, vol. 2, pp.218-222 and Fauve-Chamoux and Sogner, 1994). In his path-breaking book, Mols emphasizedthe female surplus in urban societies and estimated that the phenomenon increased in Europeduring the eighteenth century. There were few cities where this female-surplus model didnot apply, and these were always cities with specific male communities as in Rome, Italy,with so many priests, clergymen and monks (Sonnino, 1994), or as in Oxford, England withmale scholars being all clerics (clerks), as well as in some garrison towns, or towns thatattracted many male migrants, be it for a specific male labour market or for the opportunitythey provided for overseas ventures. This was the case in France for ‘international’ harbourssuch as Marseille, Bordeaux or Nantes. Sex ratios were usually more balanced in the Frenchhistorical countryside than in towns.Why privileging ‘Female sex ratio’ (FMR) versus ‘Male sex ratio’?In Europe, demographers usually agree that the sex ratio <strong>of</strong> a given population is the number<strong>of</strong> males for a hundred females (Henry, 1980, p. 11; Pressat, 1979, p. 110 and Viet, 1985,p. 122). For this paper, I proposed to call this agreed upon sex ratio a male sex ratio, inopposition to a female sex ratio, which estimates the number <strong>of</strong> females for a hundred malesor, according to the Indian way, the number <strong>of</strong> females for a thousand males (FMR). The firstad<strong>van</strong>tage <strong>of</strong> the latter is that we can trace this proportion in many French historical sources,and, at the same time, we are thus able to use it for comparisons all over pre-industrial urbanEurope. The second ad<strong>van</strong>tage is that the female sex ratio allows detailed comparisons with1Ecole des Hautes Etudes en Sciences Sociales (EHESS), Centre de Recherches Historiques, 2, rue Emile Faguet, 75014Paris, France.
all Indian cases, since it is the way Indian scholars calculate it, and call it FMR as Agnihotriexplained in his major book dedicated to Sex ratio patterns in the Indian population:“Conventionally, the term sex ratio is used in India to denote female to male ratio, while internationallyit is the other way around. To avoid any confusion therefore the term sex ratio will be used to meanmale per 1,000 female population while FMR will mean number <strong>of</strong> females per male population”(Agnihotri, 2000, p. 27).The focus <strong>of</strong> his remarkable study is to map the diverse and complex patterns <strong>of</strong> FMRs inIndia along different rele<strong>van</strong>t dimensions: age groups, social groups and cultural variables,from available colonial sources and others, using traditionally the ‘female sex ratio’, a figurefor long quite common in historical Europe.Female surplus was a constant fact, especially when considering adult French populations.Bayeux (Normandy) was a leader for female presence (138 females for 100 males in 1774,i.e. a male sex ratio <strong>of</strong> 72), owing without doubt to the development <strong>of</strong> lace making duringthe 18 th century and to the generalized practice <strong>of</strong> working at home for a protoindustrialmanufacture (El Kordi, 1970, p. 157). Harbour cities were exceptions, although they alsopresented a slight female surplus, when considering the overall population. This phenomenonwas clear for Marseille, and it was still traceable for Bordeaux. Bordeaux attracted most <strong>of</strong>the migrants from South-West France (Poussou, 1983), either to its male labour market orfor overseas ventures, while it apparently did not keep its cohort <strong>of</strong> young native girls. Suchphenomenon was true at least <strong>of</strong> the St. André parish, with its male apprentices or ship’s boysaged less than 14, so that the female sex ratio there was only 87 females for 100 males. Itshould be noted that sex-ratio data in urban contexts vary considerably from one parish toanother, depending on the parochial socio-economic structure. Attention should also be givento age structure.The lowering proportion <strong>of</strong> children in pre-revolutionary FranceResults from the survey realized for Normandy (1762) by Louis Messance, and dataconcerning the town <strong>of</strong> Pontoise in 1781 (Dupâquier, 1992) show a tendency toward a declinein the proportion <strong>of</strong> children to the overall population. Such a fundamental phenomenon tookplace in the growing large towns <strong>of</strong> these North-Western provinces <strong>of</strong> France, not far fromParis.The steady decline <strong>of</strong> the proportion <strong>of</strong> children in the overall population during the course<strong>of</strong> the 18 th century was apparently a specific French phenomenon in Europe. Two mainfactors accounted for it: 1) the usual practice <strong>of</strong> putting urban children out to wet nurses inthe countryside caused towns to lose their children, particularly when many <strong>of</strong> them died farfrom home (Fauve-Chamoux, 1983; 1985); 2) urban families more and more <strong>of</strong>ten practicedfamily limitation (Fauve-Chamoux, 2004), whereas the rural population at that time (beforethe end <strong>of</strong> the 18 th century) was not, with the exception <strong>of</strong> Normandy, where contraception33
appeared early, as in some southern societies like Pyrenean societies, where a stem-familysystem, privileging one main heir or heiress, helped controlling reproduction. 2Urban children <strong>of</strong> the French kingdom accounted for less than 30 per cent <strong>of</strong> the population,whereas those in the countryside numbered about 35 per cent boys aged less than 14, andabout 30 per cent girls, also below 14. Was this gender difference due to underregistration<strong>of</strong> females? The rather low proportion <strong>of</strong> girls compared to boys in the countryside wasapparently a structural phenomenon, as Louis Henry showed in one <strong>of</strong> his groundbreakingmethodological studies in historical demography (Henry, 1948, p. 103). The variations <strong>of</strong>sex ratios by age group, as he said, indeed should be understood as part <strong>of</strong> some natural law(Brian and Jaisson, 2007).European ‘disguised infanticide’ in comparative perspective, without gender discriminationIn Europe, putting urban children out to wet nurses in the countryside affected baby boysand baby girls equally. This practice, which spread during the 17 th century, has been called‘disguised infanticide’ meaning a <strong>sort</strong> <strong>of</strong> delayed-action infanticide (Klapisch-Zuber, 1985).Infant mortality <strong>of</strong> nursed babies could be very high (Fauve-Chamoux, 1985; 1997). But nogender-differentiated data could ever be seriously evidenced in France about nursed babies,be they born legitimate or illegitimate (Fauve-Chamoux, 2002). C. Rollet-Eschalier (1990)also did not find any trace <strong>of</strong> female neglect in the data covering France as a whole in late 19 thcentury. As far as one can tell, it seems that there was overall no sexual discrimination in earlymodern Western Europe (and, in any case, not in France) between baby boys and baby girlswhen nursing practices were concerned. It seems also to be the case for abandoned children,when gender data are available (Chamoux, 1973, p. 282 and Hunecke, 1991, pp. 46-47).But some exceptions were noted in late medieval Italy (Kertzer, 1993) and Gregory Hanlonhas also given some interesting differentiated figures recently for early-modern Italy, but hisargument will need further research (Hanlon, 2012). This absence <strong>of</strong> gender discriminationat birth in Europe in the past is probably due to the strong influence <strong>of</strong> Christianity. But a lothas been written on the creation <strong>of</strong> foundling homes in Europe and the very high mortality<strong>of</strong> unwanted children (Lynch, 2000). Infanticide was rather marginal; abortion was probablymuch more common, even if both actions were severely punished when identified. ThisEuropean situation was very far from what was evidenced in Japan, China and India aboutfemale neglect, abandonment and female infanticide (Kurosu, 1994 and Panigrahi, 1972).Nominative studies do not show any gender differentiated behaviour towards children inhistorical Europe.Indian female deficit, infanticide among elite families and caste traditions.For India, by contrast, according to for instance Lalita Panigrahi (1972), Sunita Kishor (1993)or Rama Deb Roy (1996) 3 , a number <strong>of</strong> castes and clans <strong>of</strong> North Western provinces, roughlyUttar Pradesh, Punjab Oudh and <strong>of</strong> some other Indian states <strong>of</strong> Rajasthan were known to2For references on strategies <strong>of</strong> family limitation, Malthusianism and transmission systems, see Fauve-Chamoux andOchiai, 2009 and Duraes et al., 2009.3The literature on sex ratio, infanticide and abortion in India is enormous. See for example, Visaria, 1967.34
practice infanticide around mid-nineteenth century. 4 An 1854 investigation by colonialauthorities revealed that in the Benares Division, infanticide was clearly a common practice.The lower castes which did not own much land such as the Chamars, Kumhars, Dhobis,Telis, Lodhas and Kurmis had higher proportions <strong>of</strong> females in their population and, at thesame time, they had no tradition, in their communities, <strong>of</strong> practicing female infanticide. Thisdoes not mean that they never practiced it, because they could adopt the dowry system if theyimproved their standard <strong>of</strong> living.Hindu families wanted to marry their girls higher or at least equally to her own rank. Thisconnection between female infanticide, hypergamic marriage and the constraints <strong>of</strong> the dowrysystem has been extensively discussed for Gujarat by David Pocock (1954) and commentedby many authors (Goody and Goody, 1990) 5 . And in an Indian society practicing “universalmarriage”, a girl remaining unmarried was dishonourable for her family. In Western Europe,as John Hajnal demonstrated, the frequency <strong>of</strong> female celibacy was increasing during theeighteenth century and age at marriage was delayed (Hajnal, 1965). For a woman, stayingsingle was a solution when no good partner was available or when her dowry was not attractiveenough, or if she had none.Nowadays, the problem <strong>of</strong> female foeticide is alarming for Indian authorities, health policymakers and directors <strong>of</strong> family planning programmes (Patel, 2007). Female infanticide isa phenomenon to be always considered in long historical perspective and, for India, in theframe <strong>of</strong> an increasing “northenisation” (Agnihotri 2000, p. 47).If the Hindu Succession Act <strong>of</strong> 1956 assured equal rights to the female children <strong>of</strong> the family 6 ,it did not stop the decline in the female sex ratio (FMR), and it is still common that sons <strong>of</strong>tenget the best <strong>of</strong> education and inherit ancestral property. Raising a good dowry to marry agirl at a rather early age, according to traditional customs, continues to remain a problem inHindu society, be it rural or urban (Panigrahi 1972, p. 191). The problem <strong>of</strong> fewer girls is notnew in India and it requires multidisciplinary perspectives and qualitative and quantitativeapproaches.ConclusionFemale surplus in urban European pre-industrial society was an important demographicphenomenon but other factors concurred to increase this female surplus in Western societies.If it was partly natural, as evidenced by the French demographer Louis Henry in 1948, thefemale surplus was also partly related to the labour market and to the presence in town <strong>of</strong>females born in the countryside and encouraged to migrate to cities by the development <strong>of</strong>domestic service in bourgeois homes (Fauve-Chamoux, 2005). Adolescent girls and youngwomen were able to leave the parental home before the age at marriage, which was late,and they could earn a living independently (Fauve-Chamoux, 2003). A few studies are4Cf data collected by W.R.Moore, 18685See Chapter 6, on marriage and the family in Gujarat, pp. 160-179, and chapter 8, on India and Sri Lanka, pp. 229-251,in Goody & Goody, 19906For more, see Cave-Browne 1857; Miller 1981, 1993; Pakrasi 1970; Kishor 1993 and Caldwell 2001.35
available on female labour in India for further comparative historical analysis (Moosvi,1994), complementing the very many studies on sex ratios and historical traditions leadingsome well-<strong>of</strong>f communities, particularly in Northern India, to female infanticide and neglect,followed, in today’s India, by the largely practiced prenatal sex selection privileging sonsover daughters. 7Fully contrasting with Indian early and universal marriage patterns, traditional female deficit,infanticide and recently, gendered abortion, the European female surplus in past urbancontext and the large number <strong>of</strong> unmarried immigrant working women who had left homewere stressed. One <strong>of</strong> the basic characteristics <strong>of</strong> Western European pre-industrial towns wasthe presence <strong>of</strong> large cohorts <strong>of</strong> adult women, single or widowed, living on their own fromtheir personal work, sometimes with legitimate or illegitimate children, but without a spouse.This feature was coupled with a strong domestic service system and a late marriage pattern(Fauve-Chamoux, 2011). Abortion was not socially accepted for religious and cultural reasonsin Western culture. Infanticide was totally banned and condemned by death penalty. Beingnot any more regulated by mortality crises, the natural growth <strong>of</strong> the population was reducedby socio-cultural practices, as Thomas Robert Malthus had identified them (Malthus, 1798):Mercenary breastfeeding, child abandonment to charity, celibacy and late marriage, beforecontraceptive behaviours became fully efficient, in a secularised society (Fauve-Chamoux2004).ReferencesAgnihotri, Satish Balram (2000), Sex ratio patterns in the Indian population, a fresh exploration. NewDelhi/London: Sage.Brian, Eric and Marie Jaisson (2007), The descent <strong>of</strong> human sex ratio at birth: A dialogue betweenmathematics, biology and sociology. Dordrecht: Springer.Cave-browne, John (1857), Indian infanticide: Its origins, progress and suppression. London: W.H. Allen.Caldwell, John C. (2001), What do we know about Asian population history? Comparisons <strong>of</strong> Asian andEuropean research. In Ts'ui-jung Liu, James Lee, David Reher, Osamu Saito and Wang Feng (eds.),Asian Population History. Oxford: Oxford University Press, pp. 3-23.Chamoux, Antoinette (1973), L'enfance abandonnée à Reims à la fin du XVIIIe siècle. Annales deDémographie Historique, special issue "Enfant et société". Paris: Mouton, pp. 263-285.Das Gupta, Monica (1987), Selective discrimination against female children in rural Punjab, India.Population and Development Review, 13, 1 (March), pp. 77-100.Deb Roy, Rama (1996), Female infanticide in India in a historical perspective. Paper presented at ESSHC1996. Amsterdam: mimeo.Dupaquier, Jacques (1992), Pontoise et les pontoisiens en 1781. Pontoise: Société des Amis du Vexin.Durães, Margarida, Antoinette Fauve-Chamoux, Llorenç Ferrer and Jan Kok (eds.) (2009), Thetransmission <strong>of</strong> well-being: Gendered marriage strategies and inheritance systems in Europe from the17 th to the 20 th centuries. Bern: Peter Lang.7For the recent past, we recommend Patel, 2007, chapter 1, ‘Introduction. Gender relations, NRTs, and female foeticidein India’, pp. 26-35) (NRT: New Reproductive Technologies).36
Elkordi, Mohamed (1970), Bayeux aux XVIIe et XVIIIe siècles, Contribution à l'histoire urbaine de laFrance. Paris: Mouton.Fauve-Chamoux, Antoinette (1983), The importance <strong>of</strong> women in an urban environment: The example <strong>of</strong>the Rheims household at the beginning <strong>of</strong> the industrial revolution. In R. Wall, J. Robin and P. Laslett(eds.), Family Forms in Historic Europe. Cambridge: Cambridge University Press, pp. 475-492.Fauve-Chamoux, Antoinette (1985), Innovation et comportement parental en milieu urbain (XVe-XIXesiècles). Annales (E.S.C.), 40, 5, pp. 1023-1039.Fauve-Chamoux, Antoinette (2002), Changes in policy towards abandoned children and differentialmortality: The case <strong>of</strong> 18 th century Rheims, Pathways <strong>of</strong> the past, essays in honour <strong>of</strong> Sølvi Sogner onher 70 th anniversary, Hilde Sandvik, Kari Telse and Gunnar Thorvaldsen (eds), Tig og Tanke. Oslo:University <strong>of</strong> Oslo, pp. 39-58.Fauve-Chamoux, Antoinette (2003), Patterns <strong>of</strong> leaving “house” in a 19 th century stem-family society. InThe road to independence. Leaving home in Western and Eastern societies, 16 th -20 th century. <strong>Frans</strong> <strong>van</strong><strong>Poppel</strong>, Michel Oris and James Lee (eds.). Bern: Peter Lang, pp. 199-220.Fauve-Chamoux, Antoinette (2004), Fertility decline and family behaviour in 18 th century Rheims. InEugenio Sonnino (ed.), Living in the city. Rome: Universita La Sapienza, p. 523-546.Fauve-Chamoux, Antoinette (ed.) (2005), Domestic service and the formation <strong>of</strong> European identity.Understanding the globalization <strong>of</strong> domestic work 16 th -21 st centuries. Bern: Peter Lang.Fauve-Chamoux, Antoinette (2011), European illegitimacy trends in connection with domestic serviceand family systems (1545-2001). In Ioan Bolo<strong>van</strong> and Peter Teibenbacher (eds.), special issue CentralEurope population history during the first demographic transition. Romanian Journal <strong>of</strong> PopulationStudies, Cluj-Napoca, V, 2, pp. 8-45.Fauve-Chamoux, Antoinette and Emiko Ochiai (eds.) (2009), The stem family in Eurasian perspective.Revisiting house societies. Bern: Peter Lang.Fauve-Chamoux, Antoinette and Sølvi Sogner (eds.) (1994), Socio-economic consequences <strong>of</strong> sex-ratiosin historical perspective, 1500-1900. Milan: University Bocconi.Goody, Esther and Jack Goody (1990), Marriage and family in Gujarat. In Jack Goody, The Oriental, theAncient and the Primitive; systems <strong>of</strong> marriage and the family in the pre-industrial societies <strong>of</strong> Eurasia.Cambridge: Cambridge University Press, pp. 160-179.Hajnal, John (1965), European marriage patterns in perspective. Population in History. David V. Glass andDavid E.C. Eversley (eds.). London: Arnold.Hanlon, Gregory (2012), L’Infanticide «à la chinoise» en Europe moderne, L’Histoire, forthcoming.Henry, Louis (1948), La masculinité par âge dans les recensements. Population, 3, 1, pp. 93-114.Henry, Louis (1980), Techniques d'analyse en démographie historique. Paris.Hunecke, Volker (1991), Intensita e fluttuazioni degli abbandoni dal XV al XIX seculo. In Enfanceabandonnée et société en Europe, XVe-XXe siècle, Ecole française de Rome, pp. 27-72.Kertzer, David I. (1993), Sacrificed for honor, Italian infant abandonment and the politics <strong>of</strong> reproductivecontrol. Boston: Beacon Press.Kishor, Sunita (1993), May God give sons to all: Gender and child mortality in India. American SociologicalReview, 58, pp. 247-265.Klapisch-Zuber, Christiane (1985), Women, family, and ritual in Renaissance Italy. Chicago: ChicagoUniversity Press.37
Kurosu, Satomi (1994), Sex ratios and the years <strong>of</strong> the fire horse (hinoeuma): Cultural and regionalexperiences in Japan. In Antoinette Fauve-Chamoux and Sølvi Sogner (eds.), Socio-economicconsequences <strong>of</strong> sex-ratios in historical perspective, 1500-1900. Milan: Universita Bocconi, pp. 89-102.Lynch, Katherine A. (2000), Infant mortality, child neglect, and child abandonment in European history: Acomparative analysis. In Tommy Bengtsson and Osamu Saito (eds.). Population and Economy: fromhunger to modern economic growth. Oxford: Oxford University Press, pp. 133-164.Malthus, Thomas Robert (1798), An essay on the principle <strong>of</strong> population, as it affects the future improvement<strong>of</strong> society with remarks on the speculations <strong>of</strong> Mr. Godwin, M. Condorcet and other writers. London:J. Johnson [published anonymously].Messance, Louis (1766), Recherches sur la population des généralités d'Auvergne, de Lyon, de Rouen, etde quelques provinces et villes du Royaume.... Paris: Durand.Miller, Barbara (1993), Sex and gender hierarchies. Cambridge: Cambridge University Press.Mols, Roger (1954), Introduction à la démographie historique des villes d'Europe du XIVe au XVIIIesiècle. Louvain: Duculot, 3 vols.Moore, W.R. (1868), Papers on the subject <strong>of</strong> investigation and report regarding. Female infanticide in theBenares division. Calcutta.Moosvi, Shireen (1994), Work and gender in pre-colonial India. In Antoinette Fauve-Chamoux and SølviSogner (eds.), Socio-economic consequences <strong>of</strong> sex-ratios in historical perspective, 1500-1900. Milan:Universita Bocconi, pp. 105-116.Pakrasi, Kanti B. (1970), Female infanticide in India. Calcutta: Editions India.Panigrahi, Lalita (1972), British social policy and female infanticide in India. New Delhi: MunshiramManiharlal.Patel, Tulsi (ed.) (2007), Sex-selective abortion in India: Gender, society and new reproductive technologies.London: Sage.Pocock, David F. (1954), «The hypergamy <strong>of</strong> the Patidars». In K.M. Kapadia (ed.), Pr<strong>of</strong>essor GhuryeFelicitation Volume. Bombay: Popular Book Depot.Poussou, Jean-Pierre (1983), Bordeaux et le Sud-ouest au XVIIIe siècle, croissance économique etattraction urbaine. Paris: EHESS.Pressat, Roland (1979), Dictionnaire de démographie. Paris: PUF.Rollet-Eschalier, Catherine (1990), La politique à l'égard de la petite enfance sous la IIIe république. Paris:INED/PUF.Sonnino, Eugenio (1994), In the male city: The status animarum <strong>of</strong> Rome in the 17 th century. In AntoinetteFauve-Chamoux and Sølvi Sogner (eds.), Socio-economic consequences <strong>of</strong> sex-ratios in historicalperspective, 1500-1900. Milan: Universita Bocconi, pp. 19-29.Viet, Jean (1985), Population Multilingual Thesaurus. Paris: CICRED.Visaria, Pravin M. (1967), The sex ratio <strong>of</strong> the population <strong>of</strong> India and Pakistan and regional variationsduring 1901-1961. In Ashish Base (ed.), Patterns <strong>of</strong> population change in India, 1951-1961. Bombay:Allied Publishers.38
Erasmus’ monkey.Iconoclastic reflections on two developments in technicaldemographyRon LesthaegheTwo developments in technical demographyDuring the last three decades the field <strong>of</strong> technical demography has been characterized bytwo major developments: (i) Corrections for tempo shifts <strong>of</strong> period measures <strong>of</strong> fertility,and (ii) the shift from variants based population projections to the so-called ‘probabilistic’projections. In this short piece I will argue that neither one delivered a major breakthrough. 1Instead I think that the two developments cited above are an illustration <strong>of</strong> Erasmus’ dictum:“Even if a monkey wears a golden ring, it is and will remain an ugly thing”.‘Period paramount’: The opposite viewFirst <strong>of</strong> all, it is essential to understand that important ‘period effects’, such as an economiccrisis, a political turnaround, or a technical innovation (i.e. concerning fertility control orprolongation <strong>of</strong> life) are not synonymous with any superiority <strong>of</strong> the use <strong>of</strong> period measures<strong>of</strong> demographic events. That confusion between period effects and period measures seems tobe ubiquitous despite the fact that they refer to totally different things. The former refers toeffects <strong>of</strong> exogenous factors upon the life course, whereas the latter is a technical accountingtrick. The ‘period paramount’ dictum fails to point out whether period effects are <strong>of</strong> paramountimportance over cohort effects or whether period measures are to be preferred over cohortmeasures. The sooner ‘period paramount’ is forgotten, the better, and that in either instance.Life is just a bit too complex for such simplifications.I take it for granted that everyone understands that, with the theoretical exception <strong>of</strong> utterhistorical stagnation and immobility, successive generations are socialized under differentconditions, and are therefore by definition not starting from a position identical to that <strong>of</strong>their predecessors. During the 20 th century, the growth <strong>of</strong> education on a global scale, forinstance, already means that cohorts will be differentiated in aspirations, resources and valueorientations. These features that are linked to the socialization phase <strong>of</strong> generations are theso called ‘cohort effects’. That is the classic definition, and that’s the one we will stick to.And for good measure: These socialization effects are specific for each generation. If all <strong>of</strong> asudden there is a major expansion <strong>of</strong> the education system, the older generations will not enmasse return to school. It is essentially only the younger generation that will reap the benefits<strong>of</strong> it.But, <strong>of</strong> course, during their further life time, these generations will be affected by all <strong>sort</strong>s <strong>of</strong>‘period shocks’ and disturbances, to which ‘rational actors’ are supposed to adjust. And these1This short piece will be developed into a full article for peer review at a later stage. At this point it only benefitted fromcomments by Tomas Frejka and Tomas Sobotka.39
adjustments and reactions are the so-called ‘period effects’. These two effects, together withthe physiological effect <strong>of</strong> aging, the social influence <strong>of</strong> family members and peers, and lifecycle circumstances, largely determine the overall outcome. But the study <strong>of</strong> period effectsdoes by no means imply that only period measures should be used. When examining cohortpr<strong>of</strong>iles, a given period related ‘shock’ <strong>of</strong> any importance will show up for all cohorts, butat different ages, and in the instance <strong>of</strong> cohort-period interaction, the magnitude <strong>of</strong> the effect<strong>of</strong> the ‘shock’ will vary according to the life cycle stage <strong>of</strong> each cohort. The breakthrough <strong>of</strong>hormonal contraception during the late 1960 s and 1970 s only affected the stopping behavior<strong>of</strong> older women, whereas it affected the entire fertile life span <strong>of</strong> the younger ones, therebyopening up the possibility for a massive postponement <strong>of</strong> first births. In other words, periodshocks are best studied by assessing their differentiated effect at the various ages and lifecycle stages <strong>of</strong> each <strong>of</strong> the successive cohorts. One does not at all need period measures <strong>of</strong>demographic events to do that finer work.This throws us back to period measures and their use. Period measures are synthetic measuresthat are summations <strong>of</strong> slices <strong>of</strong> the life cycle unfolding <strong>of</strong> different cohorts. Fertility, nuptialityor mortality experiences over a short period <strong>of</strong> time are just summed up to arrive at a finalproduct which is not representative for any <strong>of</strong> the contributing cohorts. These measures haveno meaning in real life. 2 The only exception is <strong>of</strong> course that <strong>of</strong> perfect stationarity. In fact,to give these period measures any meaning, the stationarity condition –i.e. the hypothesis<strong>of</strong> a frozen society in which cohorts are mere copies <strong>of</strong> each other– is absolutely essential.Incidentally, this not only pertains to the Total Fertility Rate and to the Singulate MeanAge at Marriage (SMAM) 3 , but also to all the indirectly standardized ‘Princeton measures’(i.e. Coale’s Ig, Im, Ih or If). All these are frequently used measures, because they providesummaries. But only quick and dirty ones. In fact, period measures are merely accountancytricks for impatient users. Indeed, to get an idea <strong>of</strong> a final intensity 4 , one has to be patient andwait till a certain age is reached by which most <strong>of</strong> the events have occurred. 5 But nothing willprevent us from measuring the events up to an earlier point (defined by either age or duration)to see where successive cohorts had arrived by that point. One way <strong>of</strong> doing this is to take a2It could be argued that Kuczynski’s gross and net reproduction rates (GRR and NRR) were major historical stepsforward. But these period measures and especially the NRR led very illustrious demographers down the garden pathand into the belief that Europe was going to die out. Despite the fact that the Lexis diagram was long known by the1930 s , the impact <strong>of</strong> a tempo shift was totally ignored, together with cohort analyses.3The inventor <strong>of</strong> SMAM, John Hajnal, was vividly aware <strong>of</strong> this condition, much more so than many subsequent userswho prefer the blurring effect <strong>of</strong> SMAM over the clean analysis <strong>of</strong> proportions married up to a given age (e.g. 20, 25 or30) at various points in time.4The final intensity <strong>of</strong> mortality is <strong>of</strong> course always unity, and much <strong>of</strong> what is going to be said here pertains to otherdemographic events.5The classic objection to cohort analysis is that pr<strong>of</strong>iles are incomplete. Here this “impatience factor” shows up veryclearly. It goes without saying that all one can do is try to complete the schedules for cohorts that are far enough, andpurely speculate or write scenarios for those that are just starting with the unfolding <strong>of</strong> the life course. Just face the factthat the future is unknown for younger cohorts, but that we can monitor their progress, year after year, with a minimum<strong>of</strong> data requirements.40
enchmark cohort and to study the difference function for other cohorts as measured over ageor duration relative to this benchmark. 6The violations <strong>of</strong> the stationarity condition are the cause <strong>of</strong> all the problems with periodmeasures. This brings us to one major violation <strong>of</strong> the stationarity hypothesis: Tempo shifts.This problem is an old one and already discussed in great detail by our older mentors likeLouis Henry and Norman Ryder. But the idea <strong>of</strong> ‘fixing’ the problem by adjusting periodmeasures for the speed <strong>of</strong> the delay is more novel, and was, as everyone knows, pioneered byJohn Bongaarts and Griffith Feeney. More specifically, these authors measured parity specificperiod total fertility rates, and, in the instance <strong>of</strong> postponement, they inflated these total periodrates by ‘backwardly projecting’ them with the speed <strong>of</strong> postponement, as measured by therate <strong>of</strong> shift in the parity specific mean ages at motherhood. One can easily extend this idea tocorrect the total period first marriage rate, and calculations would be simpler too, since a firstmarriage is a non-renewable event. The Bongaarts-Feeney trick led to several variations, butthe core idea is always the same. 7 There are <strong>of</strong> course many problems with such measures.Firstly, how do we measure the speed <strong>of</strong> the tempo shift? Over a single year (very shaky),over five years, or should we opt for a more stable average over a longer time? Furthermore,the values <strong>of</strong> the parity specific TFR s are just period measures and therefore no more thansynthetic measures that are only representative for women <strong>of</strong> a given parity, but irrespective <strong>of</strong>generation. First births occur to teenagers as well as to much older women born twenty yearsearlier. That problem is less acute for birth orders three and higher, but then, the contribution<strong>of</strong> such higher order births has systematically dwindled in all populations <strong>of</strong> the industrializedworld.Secondly, all tempo adjusted measures proposed so far only assume postponement, and donot <strong>of</strong>fer any perspective on subsequent recuperation <strong>of</strong> fertility at later ages. The degree<strong>of</strong> recuperation is <strong>of</strong> course <strong>of</strong> paramount importance as well, and at the later stage <strong>of</strong> theso-called ‘postponement transition’, differential recuperation will determine the degree<strong>of</strong> definitive childlessness and the amount <strong>of</strong> increase in overall period TFR s . A simplesimulation suffices to show how the passage from postponement to recuperation, generationafter generation, will determine the track <strong>of</strong> the summary period measures. In fact, TomasFrejka has provided us with such a simple and elegant simulation <strong>of</strong> generational changes inpostponement and recuperation to illustrate this point. 8 This didactical piece <strong>of</strong> his can alsobe taken as a blueprint to look at real cohort behavior, and to translate that back into periodmeasures. When this is done for a set <strong>of</strong> European populations 9 one realizes furthermore that6This can be done graphically or through a modeling <strong>of</strong> the difference function. For the latest on this issue see TomasSobotka et al., 2011: Postponement and recuperation in cohort fertility: New analytical and projection methods andtheir application. European Demographic Research Papers. Vienna: Vienna Institute <strong>of</strong> Demography, 2.7Add to that the fact that the latest corrections are very data demanding, much more so than that required for a classiccohort analysis.8Tomas Frejka, 2012: The role <strong>of</strong> contemporary childbearing postponement and recuperation in shaping fertility trends.Comparative Population Studies – Zeitschrift für Bevölkerungswissenschaft. Preprint release <strong>of</strong> 27 September 2012.9See Tomas Sobotka et al, op.cit.41
the extent <strong>of</strong> fertility recuperation is very different among these nations and cohorts, andthat the rises in period TFR s are not just the product <strong>of</strong> the end <strong>of</strong> postponement, but alsoand increasingly the product <strong>of</strong> differential recuperation <strong>of</strong> fertility at later ages. This thenleads to the genuine social science question, i.e. why are there such major differences inthe catching up phase as well? Are they related to social welfare conditions? To provisionsfor working mothers? To different levels <strong>of</strong> unemployment? To housing conditions? Or toideational differences as well? I wonder whether one would have come to this ‘recuperation’issue via any <strong>of</strong> the available ‘tempo corrected’ versions <strong>of</strong> the TFR. The bottom line is thatall these finer issues are very straightforward and directly observable in the cohort perspective<strong>of</strong> fertility, whereas they are blurred and distorted in the period perspective.And thirdly, what do we do with such ‘corrected’ period TFR s ? Obviously they have nopredictive power whatsoever. 10 But why are the tempo adjusted measures so commonly usedto warn the public that current levels are just artificially too low and will automatically riseonce the postponement stops? Such pronouncements are predictions, aren’t they? Reality isthat not much <strong>of</strong> a rise will materialize if the end <strong>of</strong> postponement is not followed by amplerecuperation, and that in such instances the tempo adjusted measures will equally fall short <strong>of</strong>giving the finer picture. Furthermore, why are most inventors and users <strong>of</strong> the tempo correctedTFR s so typically confronting and validating their outcomes against the cohort measures <strong>of</strong>total fertility with a time lag <strong>of</strong> thirty years or so? If the benchmark <strong>of</strong> validation is cohortfertility, why then bother with all these adjustments in the first place?To sum up, considering their massive violation <strong>of</strong> the stationarity hypothesis, period measuresbecome clumsy affairs in periods <strong>of</strong> change. Furthermore, since demographers are mostlyinterested and fascinated by changes in behavior over time, they should do better than restricttheir analyses to such clumsy indicators. And simple adjustments do not alter this fact.Expressed with Erasmus’ metaphor, they are only the golden ring on the monkey’s finger.Probabilistic population projections: What is ‘probabilistic’ about them?The classic format <strong>of</strong> population projections has been based on <strong>of</strong>fering the public a set <strong>of</strong>variants, typically constructed by combining hypotheses concerning mortality, fertility andmigration. These were <strong>of</strong>ten simplified to retain three variants only, the medium, the highand the low variant respectively. Of course, in many instances, many more fully workedout combinations were <strong>of</strong>fered so that the effects <strong>of</strong> each <strong>of</strong> the hypotheses concerning thethree vital events on the future course and age structure could be isolated. In combinationwith insights from stable and quasi-stable population theory and with those from the formaldemography <strong>of</strong> migration and multi-state demography, very fine analytical work has beendone. Moreover, decisions were <strong>of</strong>ten based, rightly or wrongly, on social science insights.But in the worst case, one could still retrospectively diagnose where premises were wrong.And finally, one has <strong>of</strong>ten linked these reasoned outcomes to non-demographic aspects inorder to come up with highly instructive simulations <strong>of</strong> the labor force, social security costset cetera. In such instances one not only focusses on ‘variants’ but on complex scenarios <strong>of</strong>what could happen in real life.10John Bongaarts has repeatedly reaffirmed this in his presentations or in personal communication.42
issue <strong>of</strong> migration between more than one population. Multi-state demography proved to bea gem in projections <strong>of</strong> individual household positions as well (e.g. the Van Imh<strong>of</strong>f-KeilmanLIPRO model), and has even been an indispensable tool for well-reasoned ‘speculation’ aboutthe religious or political composition <strong>of</strong> populations. In all these endeavors, one does not losetrack <strong>of</strong> the composing elements and transition probabilities, and the output can be understood‘analytically’ from the input. With multi-state demography we are at the opposite end <strong>of</strong> thespectrum when compared to the massive shortcut hiding under the term ‘probabilistic’.My advice for the next cohorts <strong>of</strong> demographers? Demography is at the micro level (i)the study <strong>of</strong> individual life courses as they evolve, generation after generation, over timeand space, and (ii) <strong>of</strong> the impact <strong>of</strong> all factors that impact on the life course. At the macrolevel demography is the study <strong>of</strong> how all these individual pieces add up to a larger whole,and how the structure <strong>of</strong> this larger entity –a population– feeds back into constraints andopportunities for its constituting members. Hence, let’s keep the life course unfolding amongsuccessive generations, and all its intriguing alterations over time and space, as the core, andinvest in technical ad<strong>van</strong>ces that are in line with this objective. The way forward in technicaldemography is therefore that <strong>of</strong> increasing analytical finesse to cope with complexity, not that<strong>of</strong> blunt shortcuts.ReferencesTomas Frejka (2012), The role <strong>of</strong> contemporary childbearing postponement and recuperation in shapingfertility trends. Comparative Population Studies – Zeitschrift für Bevölkerungswissenschaft. Preprintrelease <strong>of</strong> September, 27, 2012.Tomas Sobotka et al. (2011), Postponement and recuperation in cohort fertility: New analytical andprojection methods and their application. European Demographic Research Papers. Vienna Institute<strong>of</strong> Demography, Vienna, 2.44
25 Years <strong>of</strong> collaboration: The Historical Sample <strong>of</strong> theNetherlands and LINKSKees MandemakersThe Historical Sample <strong>of</strong> the Netherlands (HSN) collects life course data as completely aspossible for a representative portion <strong>of</strong> the 19 th and 20 th century Dutch population. Base <strong>of</strong>the sample are the birth certificates. Most <strong>of</strong> the data for the construction <strong>of</strong> life courses areextracted from the population registers which makes it possible to follow migrants all overthe country. This feature makes the HSN database internationally unique.The HSN started around 1987 with the formation <strong>of</strong> a work group whose members were fromdifferent social science disciplines like sociology, social-economic history, social geography,economics and demography, all sharing a relatively strong historical interest. The projectstarted with a first meeting in an obscure restaurant near Utrecht Central Station, called the‘Pepper Box’ photo 1.Photo 1. Bar Pepper Box in the city <strong>of</strong> Utrecht, the Netherlands45
From the beginning <strong>Frans</strong> participated in the discussions how to build a representative samplefor the Netherlands. These discussions resulted in the decision to sample from the birthcertificates as this was the only way to achieve a really unbiased sample. Starting with infantsalso had the ad<strong>van</strong>tage that there would be immediate results in the field <strong>of</strong> infant mortality(early death certificates were relatively easy to find) which had the special interest <strong>of</strong> <strong>Frans</strong>. Iwon’t repeat the discussions about a proper sample structure, except that we were very closeto a name sample. A small majority decided in favor <strong>of</strong> the birth certificates, mainly to be sureto have an unbiased sample structure.In 1989 the HSN was institutionalized in the form <strong>of</strong> a foundation, based at the InternationalInstitute <strong>of</strong> Social History, and <strong>Frans</strong> became member <strong>of</strong> the board. And the last two years heis the chair <strong>of</strong> the HSN. One <strong>of</strong> the main features <strong>of</strong> the HSN is the continuous struggling toget funding. In this struggle <strong>Frans</strong> played a major role; especially the acquisition <strong>of</strong> the ESMproject (Early Childhood, Social Mobility and Longevity) was important. It was the firstexternally funded project in which the HSN received money to work on life courses <strong>of</strong> theHSN sample itself, instead <strong>of</strong> working on oversamplings <strong>of</strong> the basic sample structure. It wasalso the real forerunner for the enormous jump that came with the millions <strong>of</strong> the investmentgrant in the project Life Courses in Context (NWO Groot) in 2002.Figure 1 gives an overview <strong>of</strong> the data gathered since the start <strong>of</strong> the HSN in 1991. As said,the sample was drawn from all persons born in the Netherlands between 1812 and 1922(n=78,000).Figure 1. Development <strong>of</strong> the HSN-database, 1991-201146
Since 1995 numerous volunteers have been working to build an index <strong>of</strong> all 19 th and early20 th century civil certificates <strong>of</strong> the Netherlands, not only containing the names <strong>of</strong> all born,deceased and married persons, but also the names <strong>of</strong> their parents, places <strong>of</strong> birth, ages andpartly their occupational titles. In this so-called GENLIAS dataset, especially the marriagecertificates have been indexed, resulting in about 3,500,000 indexed certificates from almostall <strong>of</strong> the Netherlands for the period 1812-1932.To use these data for scientific research the LINKS project has been initiated by the HSN.LINKS reconstructs all 19 th and early 20 th century families in the Netherlands. Main goals<strong>of</strong> LINKS are the construction <strong>of</strong> pedigrees (linking marriages certificates <strong>of</strong> children andparents) and families (adding births and deaths to marriage certificates). LINKS is a follow-up<strong>of</strong> earlier work with the GENLIAS dataset, especially for the provinces <strong>of</strong> Zeeland, Overijsseland Gelderland which started around 2006. Actually, in 1993, <strong>Frans</strong> and I went to Zeeland todiscuss the construction <strong>of</strong> a Zeeland index <strong>of</strong> death certificates, which would have becomepart <strong>of</strong> the so-called AKON index (Algemene Klapper Overlijdensakten Nederland). TheZeeland index was realized but AKON was overtaken by GENLIAS which started in 1995and developed rapidly since then.The HSN was and is a mix <strong>of</strong> all kinds <strong>of</strong> projects directed at economic, social and demographichistory based on micro data. The total output <strong>of</strong> HSN <strong>of</strong> the last twenty years amounts to270 publications and 473 presentations. What might that have been without <strong>Frans</strong>? Perhapsnothing at all, one, given his importance for the HSN as a whole. There are 42 publications inwhich <strong>Frans</strong> was involved. Most <strong>of</strong> them focused on mortality with 24 publications, marriagecounted 9 publications, other subjects were fertility and divorce. The number <strong>of</strong> presentationswith <strong>Frans</strong> is 77 including the one in which <strong>Frans</strong> and I presented the first results <strong>of</strong> theHSN (at the Historical Demographical Conference in Montréal in 1992). We still workedwith overhead sheets and I remember that <strong>Frans</strong> came to Schiphol to present me the lastversions just before my departure to Montréal! The last ten years <strong>Frans</strong> is speeding up, givingpresentations with HSN data at an average <strong>of</strong> ten per year. And, again, almost all <strong>of</strong> thesepresentations are co-productions where <strong>Frans</strong>, as always, takes a great part <strong>of</strong> the work.The presentations <strong>of</strong> <strong>Frans</strong> are a goldmine for future work. I only have to remember thestill unpublished but quite brilliant presentation about remarriages at the SHAA Chicago2007 (Who did and who did not? Remarriage in the Netherlands during the 19 th and early20 th century). Figure 2 shows significant differences in the chance <strong>of</strong> remarrying betweenbridegrooms from different social backgrounds that are still waiting to be further analyzed,especially the question why the semi-skilled males were lagging behind in remarrying. Didthey have better health prospects? Did they have smaller families? Did they have lowerincomes? Were these workers not attractive partners for women looking for a partner? Wefound that age and marital status <strong>of</strong> the bride were very important to explain a second marriage,but why are these effects cheerfully interacting with social and provincial background? And<strong>of</strong> course the model needs to be improved as well, but that goes too far for this contribution.Anyway, with the new LINKS dataset the whole country could be covered, including effects<strong>of</strong> the first marriages as well.47
Figure 2. Percentage <strong>of</strong> remarrying bridegrooms (out <strong>of</strong> total bridegrooms) differentiated onsocial-economic background, five regions in the Netherlands (provinces <strong>of</strong> Groningen, Overijssel,Gelderland, Zeeland and Limburg), 1812-1922 n=1,059,348)1614121086420UnskilledworkersSemi-skilledworkersSkilledworkersMiddle class Elite Farmers TotalSource: GENLIAS48
Part IIIFertility and Nuptiality
50Low fertility, economic change and unemployment during theinterbellum periodJan Van BavelIn their recent paper, Schellekens and Van <strong>Poppel</strong> (2012) show that a very high proportion <strong>of</strong>the decline towards low fertility in the 1930 s in the Netherlands can be explained by economicchange, “leaving little room for attitudinal change” (p. 965). More specifically, their results“indicate that unemployment was a major contributing factor to relatively low fertility inthe 1930 s ” (p. 983). The question remains to what extent this conclusion holds for Europeancountries more generally, especially taking into account that the Netherlands experienced anotably late fertility transition (Van <strong>Poppel</strong>, 1983). The aim <strong>of</strong> this contribution is to shed somelight on the matter with descriptive data, hoping to stimulate more sophisticated analyses inthe future. Ideally, to guarantee high quality, these would be supervised by <strong>Frans</strong> <strong>van</strong> <strong>Poppel</strong>.During the interwar period, demographers did not attribute low fertility to economic crisis. Onthe contrary, they generally linked it to continuing economic growth and increasing standards<strong>of</strong> living (Van Bavel 2010). Although unemployment soared during the Great Depression, thiswas not considered a major explanation for low fertility. In the judgment <strong>of</strong> Carr-Saunders(1936), “[a]s a motive for keeping the size <strong>of</strong> family small the fear <strong>of</strong> unemployment isprobably far less important than the ambition <strong>of</strong> parents for their children” (p. 249).Empirically, demographers and economists have shown that economic indicators and fertilityare strongly correlated. However, the positive correlation between economic indicators andfertility only holds for the short-term ups-and-downs, not for the long term trends. “Thesurface waves are indeed much influenced by economic fluctuations, but the underlying tideappears to be an independent and surprisingly stable force” (Kirk, 1960, p. 254).Figure 1 describe unemployment rates, per capita GDP and period total fertility rates (PTFR)for 11 OECD countries for the interwar years. These figures suggest that the mid-term fertilitytrend, in contrast to the short-term ups-and-downs, was not governed by unemployment orby the growth <strong>of</strong> the economy. For example, all countries exhibit declining fertility duringthe 1920 s , irrespective <strong>of</strong> the level <strong>of</strong> unemployment in industry and the growth <strong>of</strong> GDPper capita. And in all countries, the decline <strong>of</strong> fertility halted in the latter part <strong>of</strong> the 1930 s ,irrespective <strong>of</strong> the severity <strong>of</strong> the economic crisis, as indicated by high unemployment and aslackening or even declining GDP.Figure 2 plots the mid-term relations between economic indicators and fertility in a moresystematic way for the same 11 countries. The two figures display the relationship between theaverage net reproduction rate for the years 1930-35 on the vertical axis and average economicindicators for the same years on the horizontal axes. There is no correlation whatsoeverbetween average net reproduction and unemployment (panel A). For example, Canada andthe Netherlands had about the same level <strong>of</strong> unemployment as England and Australia duringthese years, even though the former two countries had much higher reproduction rates. In the
Figure 1. GDP per capita, unemployment in industry, and period total fertility rates in a range <strong>of</strong>Western countries, 1920-1939 (standardized scales)Sources:- Unemployment in industry: Eichengreen and Hatton (1988).- Per Capita GDP: Maddison (2003).- PTFR: same as Figure 1 in Van Bavel (2010).same vein, during the first half <strong>of</strong> the thirties, there was no correlation between the averagenet reproduction rates and the average level <strong>of</strong> GDP per capita (panel C).Maybe the change rather than the level <strong>of</strong> the economic indicators mattered? Maybe peopledrastically restricted their fertility in response to worsening economic conditions, irrespective<strong>of</strong> the level they were used to? The scatter plots on the right hand side <strong>of</strong> figure 2 show thatthis explanation is deficient as well. The drop <strong>of</strong> total fertility during the early 1930 s wasalso not correlated with the mid-term change <strong>of</strong> the economic indicators during the GreatDepression. For example (see panel B), unemployment rose much faster in the Netherlands,Western Germany and particularly in the United States than in Australia or Norway, eventhough the rate <strong>of</strong> decline <strong>of</strong> fertility was stronger in the latter two countries. Or, (see panelD) even though the GDP per capita dropped in the United States, the Netherlands, and France51
Figure 2. Net reproduction rates by unemployment in industry and GDP per capita (average levelsin 1930-35); change in TFR by change in unemployment and GDP per capita between 1929 and1934 **Change in unemployment in industry calculated as the difference between unemployment in industry in 1933 and 1929 inpercentage points; the change in GDP was calculated as the difference between the figures for 1933 and 1929; the changein TFR was calculated as a relative difference: The absolute difference in TFR between 1934 and 1930 divided by the TFRfor 1930.Sources: - Unemployment in industry: Eichengreen and Hatton (1988).- Per Capita GDP: Maddison (2003).- PTFR: same as Figure 1 in Van Bavel (2010).52
while the GDP continued to grow somewhat in Norway, fertility fell more rapidly in the lattercountry than in the former group <strong>of</strong> countries.Western Germany (WDE) is an outlier due to the fact that, according to retrospective estimatesbased on <strong>of</strong>ficial census data, the TFR jumped upward when the Nazis came to power. IfGermany is removed from the picture, the correlation remains very low and not statisticallysignificant.ReferencesBavel, Jan Van (2010), Subreplacement fertility in the West before the baby boom: Past and currentperspectives. Population Studies 64(1), pp. 1-18.Carr-Saunders, Alexander M. (1936), World population. Past growth and present trends. Oxford:Clarendon Press.Kirk, Dudley (1960), The influence <strong>of</strong> business cycles on marriage and birth rates, in National Bureau<strong>of</strong> Economic Research. Demographic and Economic Change in Developed Countries. PrincetonUniversity Press, pp. 241-257.<strong>Poppel</strong>, <strong>Frans</strong> <strong>van</strong> (1983), Differential fertility in the Netherlands: An overview <strong>of</strong> long-term trends withspecial reference to the post-world war I marriage cohorts. Voorburg: <strong>NIDI</strong>.Schellekens, Jona and <strong>Frans</strong> <strong>van</strong> <strong>Poppel</strong> (2012), Marital fertility decline in the Netherlands: Child mortality,real wages, and unemployment, 1860-1939. Demography 49(3), pp. 965-988.53
54Socio-economic status and marriage in Northeast China, 1749-1912Shuang Chen, James Lee and Cameron CampbellMarriage behaviors in historical China, as well as those in other parts <strong>of</strong> the world, are sensitiveto both the underlying socio-economic institutions and the status <strong>of</strong> individual families.Past studies <strong>of</strong> marriage behaviors in historical China have identified a pattern <strong>of</strong> arrangedmarriage by parents and an early age at first marriage, compared to that <strong>of</strong> the populations inWestern Europe (Lee and Wang, 1999 and Wolf and Huang, 1980). This phenomenon <strong>of</strong> earlyfirst marriage is mainly a function <strong>of</strong> the residential arrangement and inheritance practicein historical China. Unlike couples in Western Europe who usually established independenthousehold upon marriage and therefore had to accumulate enough material wealth before theycould marry (Hajnal, 1965 and 1982), in China couples remained in their parents’ householdafter marriage (Lee and Campbell, 1997).While residential arrangement and inheritance practice explained the early age at firstmarriage among Chinese populations, it was also true that considerable variations existed inthe marriage timing. Women married early and universally while men had a relatively highrate <strong>of</strong> celibacy (Lee and Wang, 1999). Moreover, differences also existed across populationswith different social status. For example, daughters <strong>of</strong> the Qing imperial lineage had a meanage <strong>of</strong> first marriage <strong>of</strong> 20.7, which is much higher than 18.3, the mean age <strong>of</strong> first marriagefor daughters <strong>of</strong> banner farmers in Liaoning in Northeast China (Lee and Wang, 1999, p. 67).The mechanisms that lead to this variation still need further exploration.In this paper, we explain how the social and political systems <strong>of</strong> historical China interplayedwith individual and family characteristics to influence the chance <strong>of</strong> marrying. To do so,we summarize our findings based on recent analyses <strong>of</strong> the timing <strong>of</strong> first marriage for 0.36million individuals, living respectively in 700 villages in Liaoning province between 1749and 1909 (map 1) and 120 villages in Shuangcheng in Heilongjiang province between 1866and 1912 (map 2). Both populations were institutionalized under the Qing Eight Bannerssystem (Chen, Campbell and Lee, 2012). To record their membership to the Eight Banners, thegovernment compiled household registers and updated them triennially or annually. Drawingfrom these registers, we construct two datasets, CMGPD-LN and CMGPD-SC, that consist<strong>of</strong> 2.4 million longitudinal observations for these 0.36 million individuals (Lee, Campbell andChen, 2010 and Wang, Campbell, Chen, Dong, Noellert and Lee, 2012).The form <strong>of</strong> major marriage and the denial <strong>of</strong> women’s property rights in late imperial Chinadetermined a pattern <strong>of</strong> female hypergamy and male hypogamy in the marriage practices <strong>of</strong>this period. Despite the existence <strong>of</strong> various forms <strong>of</strong> marriage in historical China, majormarriage, in which the wife moved into the husband’s household to live with his parents andunmarried siblings, was the norm. Moreover, as law did not give women inheritance rights toher parents’ property, it was possible that the wife entered the husband’s family without anyproperty. The unequal property rights resulted in the flow <strong>of</strong> wealth from the groom’s to thebride’s family. At the time <strong>of</strong> engagement, bride price was necessary to secure a marriage.
Map 1. Communities covered by the CMGPD-LN data, 1749-1909Map 2. Communities covered by the CMGPD-SC data, 1866-191255
Therefore, the socio-economic status <strong>of</strong> the groom’s family was important to win him a bride,while that <strong>of</strong> the bride’s family was less important for her to be able to marry.Consequently, a family’s socio-economic status had opposite impacts on the timing <strong>of</strong> firstmarriage for men and women. Men with higher social economic status always married earlier,while women with higher social status tended to marry later. Results from our regressionanalysis reveal that the pattern <strong>of</strong> higher social economic status raising male marriage chancesbut lowering female marriage chances is apparent regardless <strong>of</strong> whether social and economicstatus is measured for father, self, or kin (Chen, Campbell and Lee, 2012). For example,father’s <strong>of</strong>ficial position, which brought a family power and wealth, raised a son’s likelihood<strong>of</strong> marrying by 20.4 per cent in Liaoning and 27.3 per cent in Shuangcheng. However, thesame characteristic reduced a daughter’s likelihood <strong>of</strong> marrying by 25.7 per cent in Liaoningand 21 per cent in Shuangcheng. This striking difference confirmed the pattern <strong>of</strong> malehypogamy and female hypergamy on the marriage market in late imperial China; families <strong>of</strong>lower socio-economic status were more willing to trade their daughter for bride price.Along with this line, the presence <strong>of</strong> parents in the household, which indicated a more stablefamily, also affected the chances <strong>of</strong> marrying for sons and daughters oppositely. Sons withboth parents alive tended to marry early. A son’s likelihood <strong>of</strong> marrying was reduced by25 per cent in Liaoning and by 14.3 per cent in Shuangcheng if none <strong>of</strong> the individual’sparents was alive. By contrast, the absence <strong>of</strong> both parents increased a daughter’s likelihood<strong>of</strong> marrying by 39.2 per cent in Liaoning and 29.3 per cent in Shuangcheng. This is probablybecause, without property rights, women became more vulnerable upon parents’ death, whentheir brothers would equally divide family property among themselves.At the macro level, the differentiation in the timing <strong>of</strong> first marriage based on social economicstatus became less significant among men. However, our results still consistently show thatwomen <strong>of</strong> lower social and political status married earlier. Here we use registration categoryto measure social and political status at the macro level. This is because, under the EightBanners, registration categories defined differentiated entitlement rights to political andeconomic resources <strong>of</strong> the sub-populations. Within the Liaoning population, the daughter’slikelihood <strong>of</strong> marrying increased by 43.8 per cent if she came from the lower status population.Similarly, in Shuangcheng, being from the lower status category increased a daughter’schance <strong>of</strong> marrying by 50.6 per cent.Moreover, not only did gender inequality have significant impacts on marriage behaviors,but also seniority was important in determining the time <strong>of</strong> first marriage. Our results showthat sibling composition and their marital status had significant impact on timing <strong>of</strong> firstmarriage for both men and women. Siblings appear to have married in order <strong>of</strong> seniority:having unmarried older siblings delayed the timing <strong>of</strong> first marriage <strong>of</strong> both men and women.Such effects were strongest for unmarried siblings <strong>of</strong> the same sex, suggesting that sons anddaughters were in separate queues.56
Above all, our empirical study demonstrates that gender is the most important structuralconditions to formulate marriage behaviors. The social system featured by gender inequalityand the family system that honored seniority interacted with individual and householdsocio-economic status to shape the marriage behaviors in Northeast China from the 18 th toearly 20 th centuries. During this process, although some men from lower status registrationcategory still had chances to <strong>of</strong>fset their disad<strong>van</strong>tages on marriage market, women’s marriagebehavior were more likely to be constrained by such structural factors as registration category.ReferencesChen, Shuang, Cameron Campbell and James Lee (2012), Categorical inequality and gender difference:Marriage and remarriage in Northeast China, 1749-1912. Working paper.Hajnal, John (1965), European marriage patterns in perspective. In D.V. Glass and D.E.C. Eversley (eds.),Population in History. London: Edward Arnold, pp. 101-146.Hajnal, John (1982), Two kinds <strong>of</strong> pre-industrial household formation systems. Population andDevelopment Review. 8, pp. 449-494.Lee, James Z. and Cameron Campbell (1997), Fate and fortune in rural China: Social organization andpopulation behavior in Liaoning, 1774-1873. Cambridge: Cambridge University Press.Lee, James Z. and Wang Feng (1999), One quarter <strong>of</strong> humanity: Malthusian mythology and Chineserealities, 1700-2000. Cambridge, Mass.: Harvard University Press.Lee, James Z, Cameron Campbell and Shuang Chen (2010), China multi-generational panel dataset,Liaoning (CMGPD-LN), 1749-1909. User Guide. Ann Arbor, MI: Inter-university Con<strong>sort</strong>ium forPolitical and Social Research.Wang, Hongbo, Cameron Campbell, Shuang Chen, Hao Dong, Matt Noellert and James Z. Lee (2012),China multi-generational panel dataset, Shuangcheng (CMGPD-SC), 1749-1909. User Guide. AnnArbor, MI: Inter-university Con<strong>sort</strong>ium for Political and Social Research.57
The incidence <strong>of</strong> consanguinity in Norway in the late 19 th centuryHilde L. Jåstad and Gunnar ThorvaldsenToday consanguineous marriages are defined as foreign in Norwegian culture, somethingdone by “the others”. Such marriages are more common in other countries, e.g in Pakistanwhose emigrants bring along the custom to Scandinavia where they are criticized for thepractice. This con-temporary context makes it topical to know how common marriagesbetween close kin were earlier. Following the reformation, Protestants generally accepted theguidelines in Leviticus 18, pp. 7-18, which permitted marriage between first cousins until in1687 Christian V’s Law banned such marriage. Kin marriage was only allowed between thirdcousins. If closer kin married without royal license they risked losing their assets and theirhomes. This legislation was removed in Norway in 1800, and to the present marriage betweenfirst cousins, uncles/aunts and nieces is legal in Norway. Since parishes may function asmarriage isolates and marriage patterns may be based on geographical proximity, this mayresult in many consanguineous relationships between spouses, which in the next round willproduce similar genetic structures among descendants (Saugstad and Ødegård, 1977).Several theories attempt to explain the prevalence <strong>of</strong> consanguinity. One focuses on pro-cesses<strong>of</strong> social class formation, where the maintenance <strong>of</strong> family wealth and land holdings wassecured by marriages between close kin (Bras, Van <strong>Poppel</strong> and Mandemakers, 2009).Economic motivation has a strong explanatory power in studies <strong>of</strong> present consanguinity aswell (Stoltenberg, 1997). However, on the one hand maintenance <strong>of</strong> family wealth correlateswith consanguinity. On the other hand the highest levels <strong>of</strong> consanguinity are found in poorrural communities with low levels <strong>of</strong> maternal education, early age at marriage and firstbirth, short birth intervals, and longer reproductive spans (Bittles, 2010). The preservation <strong>of</strong>minority cultures is another theory (Ottenheimer, 1986; 1990 and 1996). A further explanationis related to the demographic transition. When more children survived into adulthood itincreased the opportunities to marry a relative. When family sizes became smaller, rates <strong>of</strong>consanguineous marriages eventually diminished (David<strong>of</strong>f, 2006).Kin intermarriage is usually studied in population registers, but the Norwegian 1891 censuspresents a shortcut since it asked about relationships between spouses who were secondcousins or closer. At the time, the medical pr<strong>of</strong>ession suspected an association betweenconsanguineous marriages and the <strong>of</strong>fspring’s illnesses. In an international context, historicalsources with information about consanguineous marriages in such format are rare. CharlesDarwin in vain tried to lobby a question <strong>of</strong> this kind into the 1871 British census. In Norway,dr. Uchermann and other pr<strong>of</strong>essors <strong>of</strong> medicine were interested in the causes <strong>of</strong> deafness,a variable already implemented in the censuses. The Central Bureau <strong>of</strong> Statistics reluctantlyand only in 1891 agreed to implement the field: “For married women: Are you and yourhusband related as second cousins or closer? Yes, No.” Our national analysis here is basedon aggregates from <strong>of</strong>ficial statistics (NOS 1891), complemented by a 6 per cent clusteredmicrodata sample with circa 120,000 records – a full count <strong>of</strong> 26 municipalities.58
The proportion <strong>of</strong> consanguineous marriages increased from the early 19 th century peakingin the decades after 1850. This was followed by rapid decline in the 20 th century, suchmarriages becoming almost non-existent among ethnic Norwegians. Remarkably, the growthand decline <strong>of</strong> consanguineous marriages occurred almost simultaneously in highly differentlocalities and regions across Europe and America (Bittles and Egerbladh, 2005; Bittles andSmith, 1994; Ottenheimer, 1890; Saugstad, 1977 and Bras et al., 2009). Main findings fromthese studies are related to geographical distribution, the relationship between consanguinityand the proportion <strong>of</strong> non-migrants (i.e. residents in municipality <strong>of</strong> birth) and populationdensity.Map 1. Percentage <strong>of</strong> consanguineous marriages in Norway, 1891. High rate municipalities59
Map 1 shows the proportion <strong>of</strong> consanguineous marriages for municipalities that had a higherproportion <strong>of</strong> marriages between close kin than the national average –6.7 per cent (the yellowareas had a proportion lower than average). Overall, the map shows a coast-inland dichotomywith the highest proportions <strong>of</strong> consanguineous marriages in inland areas– the provinces <strong>of</strong>Telemark, East-Agder, and Hordaland stand out in the south and west with percentages <strong>of</strong>marriages between close kin 10 per cent or higher. Rates were generally low in the middlepart <strong>of</strong> Norway, but the northernmost provinces, Troms and Finnmark, obtained 10.7 and 9.5per cent respectively. Some mu-nicipalities differed substantially from the average: Valle,Sirdal, Suldal, Austevold, Jostedal, Lavik, Brekke and Kistrand had above 20 per cent. Theremote and isolated Røldal parish in the west and Karasjok in the north had above 30 per cent.Another contrast is distinctly urban-rural. In the cities, the proportion <strong>of</strong> consanguineousmarriages was on average 2.5 per cent.Earlier studies have argued that high rates <strong>of</strong> consanguineous marriages correlate with sparselypopulated areas where the majority <strong>of</strong> the population consists <strong>of</strong> non-migrants (Saugstad,1977, p. 338). Saugstad further suggests that some regional variation within Norway wasrelated to differential social structures, since the Eastern municipalities as opposed to Northernand Western Norway differ with respect to mean size <strong>of</strong> farms and proportions <strong>of</strong> cottars asopposed to landowning farmers (Saugstad and Ødegård, 1976). This is not confirmed in themap where municipalities in Eastern Norway had low rates, but is confirmed by the analysis<strong>of</strong> our microdata (Jåstad and Thorvaldsen, 2012). These show that the largest consanguineousgroup is found in the primary sector, and that only 17 per cent were cottars or day workers,meaning that the vast majority <strong>of</strong> consanguineous marriages were among the farmers. Thisanalysis also shows that the probability <strong>of</strong> consanguineous marriage was significantly loweramong the youngest women, proving that the incidence <strong>of</strong> consanguinity was being reducedin the late 19 th century.An interesting ethnic point is that the parts <strong>of</strong> Northern Norway which experienced thehighest levels <strong>of</strong> consanguineous marriages had a majority <strong>of</strong> Sámi inhabitants, especially thetypical Sámi municipalities Karasjok, Kautokeino and Kistrand. Previous studies suggesteda cultural explanation, the Sámi population having a preference for first cousin marriages(Saugstad, 1977a, p. 333). High rates <strong>of</strong> consanguinity were also found in northern regions<strong>of</strong> Sweden, in areas where the majority <strong>of</strong> the population are Sámi (Alström, 1958, Fraccaro,1958 and Böök, 1948). The high proportions <strong>of</strong> consanguineous marriages found amongthe Sámi raises several interesting questions that will be explored in future research. Onequestion is related to source criticism. If kinship had different connotations among the Sámicompared to the Norwegians, this could affect both the economic activity, organization andreporting <strong>of</strong> the household’s composition (Jåstad, 2011). Norwegians depicted the Sámikinship network with expressions such as “to be 17 th cousins like the Sámi”, pinpointingthe extended kin groups among the Sámi. An interesting question is to what extent the Sámireported second cousin relationships when the kin relation was really more remote, thusbiasing the estimates <strong>of</strong> consanguinity reported in the 1891 census. During this period theNorwegian state increased its efforts to assimilate the Sámi population, so in ethnic terms kinmarriage can also be understood as a means <strong>of</strong> identity preservation.60
Earlier studies have shown that parental consanguinity increases the risk <strong>of</strong> infant death(Stoltenberg, 1997 and Surén et al., 2007). However, we know less about how consanguinityaffected infant mortality rates in the late nineteenth century when the average infant mortalityrate in Norway was around ten per cent and the causes were more complex than today. Ithas been suggested that biological heterogeneity or genetic variables may form part <strong>of</strong> theexplanation. However, few countries have available data on consanguinity and mortality inhistorical populations (Guo, 1993). A map published in Thorvaldsen (2002, p. 86) showsinfant mortality rates in Nor-wegian parishes for the period 1876-1880. High rates (between180 to 224 deaths per 1.000 births) were found in the provinces Aust-Agder, Telemark andparts <strong>of</strong> Hordaland in the southern part <strong>of</strong> Norway and in Finnmark province up north. Theseare roughly the same as the high consanguinity areas in the map reproduced here, convincingus <strong>of</strong> the need for further studies <strong>of</strong> connections between consanguinity and infant mortality.The Historical Population Register now being built in Norway will make such studies possiblewith data on the individual and family levels (Thorvaldsen, 2011).ReferencesBittles, A.H. and I. Egerbladh (2005), The influence <strong>of</strong> past endogamy and consanguinity on geneticdisorders in northern Sweden. Annals <strong>of</strong> Human Genetics, 69, 5, pp. 549-558.Bittles, A.H. (1994), The role and significance <strong>of</strong> consanguinity as a demographic variable. PopulationDevelopment Review, 20, pp. 561-584.Bras, H., F. <strong>van</strong> <strong>Poppel</strong> and K. Mandemakers (2009), Relatives as spouses: Preferences and opportunitiesfor kin marriage in a western society. American Journal <strong>of</strong> Human Biology, 21, pp. 793-804.Christian V's Norwegian Law, tredie bog, Cap 18, Om Egteskab.David<strong>of</strong>f, L. (2006), Close marriage in the 19 th and 20 th century middle strata. In F. Ebtehaj, B. Lindley andM. Richards (eds.). Kinship matters. Oxford and Portland: Hart Publishing, pp. 19-46.Guo, G. (1993), Use <strong>of</strong> sibling data to estimate family mortality effects in Guatemala, Demography, 30,pp. 15-33.Jåstad, H.L. (2007), Infant mortality in ethnically mixed parishes in 19 th century Northern Norway,Paper presented at the 32 nd annual conference in Social Science History Association, Chicago 15-18November.Jåstad, H.L. (2011), Coresidence across generations. In Northernmost Norway during the last part <strong>of</strong> the19 th century, Ph. D, University <strong>of</strong> Tromsø.Jåstad, H.L. and G. Thorvaldsen (2012), Consanguinity in Norway in the period 1891-1920. Consanguinityas a determinant <strong>of</strong> infant mortality? Paper presented at the European Social Science HistoryConference, Glasgow, 11-14 AprilOttenheimer, M. (1996), Complementarity and the structures <strong>of</strong> parallel cousin marriage, AmericanAnthropologist, 88, 1986, pp. 934-939.Ottenheimer, M. (1990), Lewis Henry Morgan and the prohibition <strong>of</strong> cousin marriage in the United States.Journal <strong>of</strong> Family History, 15, pp. 325-334.Ottenheimer, M. (1996), Forbidden relatives. The American myth <strong>of</strong> cousin marriage. Urbana: University<strong>of</strong> Illinois Press.Saugstad, L.F. (1977a), Inbreeding in Norway. Annals <strong>of</strong> Human Genetic, 40, pp. 481-491.Saugstad, L.F. (1977b), The relationship between inbreeding, migration and population density in Norway.Annals <strong>of</strong> Human Genetic, 40, pp. 331-341.61
Saugstad, L.F. and Ø. Ødegård (1977a), Predominance <strong>of</strong> extreme geographical proximity <strong>of</strong> the spouses<strong>of</strong> heirs to independent farms in a mountain valley in Norway between 1600 and 1850. Annals <strong>of</strong>Human Genetic, 40, pp. 419-430.Stoltenberg, C. (1997), Birth defects, stillbirth and infant death. Dr. Degree, Oslo: Nasjonalt folkehelseinstitutt.Surén, P., A. Grjibovski and C. Stoltenberg (2007), Inngifte i Norge. Omfang og medisinske konsekvenser,Nasjonalt folkehelseinstitutt, rapport 2.Thorvaldsen, G. (2002), Rural infant mortality in nineteenth century Norway. Hygiea Internationalis, vol.3(1), pp. 75-113. http://www.ep.liu.se/ej/hygiea/ra/013/paperc.pdf accessed 24 November.Thorvaldsen, G. (2011), Using NAPP census data to construct the historical population register for Norway.Historical Methods, 44, 1.62
Verzuiling (‘pillarisation’), ontzuiling (‘de-pillarisation’) and fertility inthe Netherlands (1920-1980)Hans Knippenberg and Sjoerd de VosA deviant caseDuring a large part <strong>of</strong> the 20 th century, the Netherlands have been a deviant case in the general(West-)European pattern <strong>of</strong> fertility decline. Starting in the last quarter <strong>of</strong> the 19 th century,the decline <strong>of</strong> Dutch fertility slowed down from 1910/1920 onwards. In the same period, theregional differences in fertility within the Netherlands increased considerably: In 1931/1935,the southern provinces <strong>of</strong> North-Brabant and Limburg had the highest levels <strong>of</strong> marital fertility,which were 89 and 71 per cent higher than the province <strong>of</strong> North-Holland, which had thelowest level.During the 1960 s and 1970 s the Netherlands lost its deviant demography as a consequence <strong>of</strong>a spectacular decline <strong>of</strong> fertility. It changed from one <strong>of</strong> the countries with the highest fertilitylevels into one with the lowest levels (Van de Kaa, 1987). The total fertility rate changed from3.1 children per woman in 1960 to 1.6 in 1980. The geographical fertility pattern also showed aremarkable turn. At the end <strong>of</strong> the 1970 s the province <strong>of</strong> Limburg had the lowest level and alsoNorth-Brabant now was among the provinces with the lowest fertility levels.ExplanationIt will be clear that general theories on fertility decline cannot fully explain the deviantcharacter <strong>of</strong> the Dutch fertility decline and its changing geographical pattern. These theoriesfocus on (mainly economic and demographic) factors, which make birth-control attractiveand (cultural) factors, which make birth-control also morally and psychologically acceptable(Wilson and Lesthaeghe, 1986 and Engelen and Hillebrand, 1986).Religion is such a factor that potentially influences the acceptation <strong>of</strong> birth-control. Van <strong>Poppel</strong>(1974) showed that from the last quarter <strong>of</strong> the nineteenth century onwards, Roman-Catholicsand orthodox Calvinists (Gereformeerden) had a higher marital fertility than other religiousdenominations and secular couples. That does not explain, however, why during a large part <strong>of</strong>the 20 th century, the Netherlands had a higher fertility than for instance its southern neighbourBelgium, which was almost homogeneously Catholic. Van <strong>Poppel</strong>, therefore, pointed at thespecific kind <strong>of</strong> verzuiling (‘pillarization’) <strong>of</strong> Dutch society, which was relatively strong.Verzuiling means the segmentation in Catholic, orthodox Calvinist, Socialist and <strong>Liber</strong>alsubcultures and institutional networks.The heyday <strong>of</strong> verzuiling started after the 1917 Constitution paved the road for generalsuffrage and equal financing <strong>of</strong> public and confessional primary education (Lijphart, 1968).Roman-Catholic and (orthodox) Protestant political parties strengthened their position inParliament and the number <strong>of</strong> Catholic and Protestant primary schools increased considerably.However, none <strong>of</strong> the confessional ‘pillars’ had a majority position. That minority positionmade them sensitive for their numerical size, not only with regard to the more liberal andsocialist parts <strong>of</strong> the population, but also to each other. In the European context, the Dutch63
verzuiling was unique in the sense that there was a Calvinist pillar alongside a Roman-Catholicone, which both resisted birth-control to a greater or lesser extent. The consequence was arelatively high fertility <strong>of</strong> both pillars.AnalysisKnippenberg and De Vos (2010a and 2010b) recently analysed the municipal differencesin marital fertility at three time cuts: Around 1930, 1960 and 1978. The first two momentsrepresent more or less the beginning and the end <strong>of</strong> the verzuiling <strong>of</strong> Dutch society. The lastmoment represents the ontzuiling (‘de-pillarisation’) <strong>of</strong> society after the cultural revolution <strong>of</strong>the 1960 s and 1970 s . This paper presents the main results <strong>of</strong> their multiple regression analyses.In 1930, by far the main explanatory factor was the rate <strong>of</strong> Roman-Catholic verzuiling measuredby the proportion <strong>of</strong> votes for Roman-Catholics parties at the Second Chamber elections: thehigher the rate <strong>of</strong> verzuiling, the higher the fertility. Almost half the variance (48%) in maritalfertility was explained by only this factor. Infant mortality and Protestant verzuiling alsohad a stimulating impact on fertility. Economic modernization and prosperity had negativeregression coefficients. All significant factors together explained 65 per cent <strong>of</strong> the variance inmarital fertility.In 1960 there were again strong positive effects <strong>of</strong> Roman Catholic (% KVP) and Protestant(% ARP, CHU, SGP) verzuiling on fertility. Also the proportion <strong>of</strong> farmers had a positiveeffect, which indicates an element <strong>of</strong> the traditional agrarian pattern <strong>of</strong> family bound agrarianways <strong>of</strong> production. The proportion <strong>of</strong> high status occupations outside the agrarian sector hada negative impact on fertility. All significant factors together explained 69 per cent <strong>of</strong> thevariance in marital fertility.In 1978, there was a significant change in the results <strong>of</strong> the regression analysis on maritalfertility. Catholic verzuiling was no longer the main explanatory factor, but still had a positiveimpact on fertility. The strongest positive effect came from the proportion <strong>of</strong> SGP voters,which is the most orthodox Calvinist party. Also the proportions <strong>of</strong> votes for the other orthodoxCalvinist parties (ARP and GPV) had independent positive effects on fertility. The proportion<strong>of</strong> the less orthodox Protestant party (CHU) no longer had a significant impact on fertility.Socio-economic status has a negative impact on fertility. Together, all significant factorsexplained 52 per cent <strong>of</strong> the municipal variance in marital fertility.These changes have to do with the strong ontzuiling (‘de-pillarisation’) <strong>of</strong> the Roman Catholicsin this period and a mixed development as far as the Protestant ‘pillar’ is concerned: ontzuiling<strong>of</strong> the least orthodox part and a kind <strong>of</strong> herzuiling (‘re-pillarization’) <strong>of</strong> some <strong>of</strong> the mostorthodox parts resulting in two very orthodox ‘mini-pillars’ <strong>of</strong> bevindelijk gereformeerden(the rank and file <strong>of</strong> the SGP) and vrijgemaakt gereformeerden (the rank and file <strong>of</strong> the GPV)(Janse, 1985, pp. 161-163 and St<strong>of</strong>fels, 1995, pp. 127-152). In Parliament, the Roman Catholicparty almost halved from 32 to 18 per cent, so did the Protestant CHU (from 9 to 5%), whereasthe other more orthodox Protestant parties remained more or less at the same level (around 9%ARP and 2.2% SGP) or even doubled (0.8 to 1.8% GPV).64
The crumbling <strong>of</strong> the Roman Catholic ‘pillar’ becomes the more clear when we look at theresults <strong>of</strong> a regression analysis on the change in marital fertility between 1960 and 1978. Inthis period the marital fertility dropped considerably from 171 to 90 children per 1.000 marriedwomen until 45 year. The municipal differences can be explained for 55 per cent by only onefactor: The proportion <strong>of</strong> Roman Catholics in population (1960): The higher the proportion,the larger the decline <strong>of</strong> fertility.ConclusionThe deviant character <strong>of</strong> the Dutch fertility decline between around 1920 and 1980 and itschanging geographical pattern has almost entirely to do with the specific political-religiousconstellation <strong>of</strong> the verzuiling (‘pillarisation’) and ontzuiling (‘de-pillarisation’) <strong>of</strong> Dutchsociety. The two religious pillars (Roman Catholic and orthodox Protestant) were both ina minority position and had to compete not only with the liberal and socialist segments <strong>of</strong>Dutch society, but also with each other, which resulted in a relatively high fertility until the1960 s . During the 1960 s and 1970 s Dutch society ‘de-pillarised’ as a consequence <strong>of</strong> a strongsecularisation and the cultural revolution <strong>of</strong> de 1960 s . Consequently, Dutch fertility declinedspectacularly. Only two ‘mini-pillars’ <strong>of</strong> orthodox Calvinists, the rank and file <strong>of</strong> the GPV(now merged in Christen Unie) and the SGP resisted and showed high fertility levels until thepresent day.ReferencesEngelen, Th.L.M. and J.H.A. Hillebrand (1986), Fertility and nuptiality in the Netherlands, 1850-1960.Population Studies, 40(3), pp. 487-503.Janse, C.S.L. (1985), Bewaar het pand. De spanning tussen assimilatie en persistentie bij de emancipatie<strong>van</strong> de bevindelijk gereformeerden. Houten: Den Hertog.Kaa, D.J. <strong>van</strong> der (1987), Europe’s second demographic transition. Population Bulletin, 42, pp. 1-57.Knippenberg, H. and S. de Vos (2010a), Tussen crisis en verzuiling: regionale verschillen in vruchtbaarheidtijdens het interbellum. In J. Kok and J. Van Bavel (red.). De levenskracht der bevolking: Sociale endemografische kwesties in de Lage Landen tijdens het interbellum (109-140). Leuven: UniversitairePers.Knippenberg, H. and S. de Vos (2010b), Een opmerkelijke omslag: het veranderde geografisch patroon <strong>van</strong>de huwelijksvruchtbaarheid in Nederland tijdens de culturele revolutie <strong>van</strong> de jaren zestig en zeventig.In K. Matthijs et al. (red.). Leven in de lage landen. Historisch-demografisch onderzoek in Vlaanderenen Nederland (187-209). Leuven: Acco.Lijphart, A. (1968), The politics <strong>of</strong> accommodation: pluralism and democracy in the Netherlands.Berkeley: University <strong>of</strong> California Press.<strong>Poppel</strong>, F.W.A. <strong>van</strong> (1974), De differentiële vruchtbaarheid in Nederland in historisch perspectief: deinvloed <strong>van</strong> de religie. Bevolking en Gezin, pp. 329-347.St<strong>of</strong>fels, H. (1995), Als een briesende leeuw. Orthodox-protestanten in de slag met de tijdgeest. Kampen:Kok.Wilson, Ch. and R. Lesthaeghe, R. (1986), Modes <strong>of</strong> production, secularisation and the pace <strong>of</strong> the fertilitydecline in Western Europe, 1870-1930. In A.J. Coale and S. Cotts Watkins (eds.). The decline <strong>of</strong> fertilityin Europe (pp. 261-293). Princeton: Princeton University Press.65
The main rules governing conscription were also applied in countries occupied by Napoleon(Woolf, 1991, pp. 156-165 and Stoker, 2009). In the Netherlands, conscription came ratherlate, as Louis Napoleon, the King <strong>of</strong> Holland, did not like the system and prevented itsintroduction (his brother Joseph, King <strong>of</strong> Naples, did the same). However, after the annexation<strong>of</strong> Holland by the French Empire on 9 July 1810, conscription was introduced. In the spring<strong>of</strong> 1811, a set <strong>of</strong> municipal Notificaties made clear that no men <strong>of</strong> a given age could avoidmilitary service unless they were very short, handicapped or married, and <strong>of</strong> course drew alow lot number. In the city <strong>of</strong> Groningen, for example, all the conscripts were summoned toappear at the town hall and Martini church on 9 April with good shoes and a sack, ready fordeparture, with the exception <strong>of</strong> married conscripts (University <strong>of</strong> Groningen Library, set <strong>of</strong>municipal notifications, PGB D 465 II).Thus, marriage was indeed a means <strong>of</strong> avoiding active service. Did this affect the number<strong>of</strong> marriages and the age <strong>of</strong> first marriage for men? There was indeed a rise in the number<strong>of</strong> marriages. According to H<strong>of</strong>stee, who analysed the demographic developments in theNetherlands for the first half <strong>of</strong> the nineteenth century, the number <strong>of</strong> marriages in 1810 washigher than in the previous years (H<strong>of</strong>stee, 1978, Table 4). The number <strong>of</strong> marriages per 1,000inhabitants in 1810 was 9.9, while in 1808 it had been 7.8 and in 1809, 8.2. This stimulus formarriage did not last long. In 1811 the number fell to 7.5 per 1,000, and in 1812 to 7.0. Thenthere was a rise again, to a maximum <strong>of</strong> 9.9 in 1815, a development which was <strong>of</strong> courseconnected with the defeats <strong>of</strong> Napoleon and the coming <strong>of</strong> peace.It is difficult to determine whether the rise in marriages in 1810 can be ascribed to Napoleoniclegislation on conscription. This requires research on a local scale focused on the age atfirst marriage for men, which should fall, and the gap between the age <strong>of</strong> the bride and thegroom, which could increase. The difficulty is that in 1810 and part <strong>of</strong> 1811 the registration<strong>of</strong> marriages was undertaken by the churches and they did not record the ages <strong>of</strong> the couples.For this reason, most urban analyses start in 1812. There is only one local study availableon this subject, the outstanding work by Joost Welten, mentioned above. He found somefigures for earlier years because the municipality he studied, Weert, belonged to the SouthernNetherlands at that time, which had been annexed to France in 1795 (Welten, 2007, Ch. 14).In the years after 1810 there is no clear correlation between the regulations concerningconscription and the number <strong>of</strong> marriages. Of course, the number <strong>of</strong> marriages fell duringthe First World War when the army was mobilized, and also during the mobilization on theeve <strong>of</strong> the Second World War (Engelen, 2009, p. 31). These mobilizations also contributed tothe character <strong>of</strong> marriages, but in a different way as, again, my family history demonstrates.During the First World War my grandfather had to leave his small home village in Gelderlandand was mobilized in Dordrecht. He met his future wife there and they married after thewar. The mobilization for the Second World War brought my father from Dordrecht toRoosendaal, where my mother lived. She had been born in Sauwerd in the north <strong>of</strong> the countrybut her father’s career in the railways had brought her south. These two examples show thatconscription also contributed to a greater genetic variation in marriages.67
In the 1970 s , exemption from service for married men was reinstated. In the previous yearsthe drawing <strong>of</strong> lots had been abolished and married men were enlisted, receiving a specialallowance. However, in 1976, Henk Vredeling, the Minister <strong>of</strong> Defence under the socialistPrime Minister, Den Uyl, realized that it was cheaper to exempt married men from servicethan pay these allowances. This exemption was promulgated in 1977 (Staatsblad 323). If yougoogle ‘Vredeling huwelijk’ (‘Vredeling marriage’) on the internet, there appears a number <strong>of</strong>ego-documents in which people confess they married for that reason. I also know that some<strong>of</strong> my students did so at the time. Still, this did not result in a rise in the number <strong>of</strong> marriages.In fact, the numbers kept falling, in accordance with a trend apparent since 1970, from 7.3 in1975, to 7.0 in 1976, 6.7 in 1977 and 6.4 in 1978 (CBS, Statline).These are a few marginal, partly individual comments on the history <strong>of</strong> marriage in theNetherlands, inspired and framed by the authority in this field, <strong>Frans</strong> <strong>van</strong> <strong>Poppel</strong>.ReferencesEngelen, Theo (2009), Van 2 naar 16 miljoen mensen. Demografie <strong>van</strong> Nederland, 1800-nu. Amsterdam:Boom.H<strong>of</strong>stee, E.W. (1978), De demografische ontwikkeling <strong>van</strong> Nederland in de eerste helft <strong>van</strong> de 19 e eeuw.Den Haag: <strong>NIDI</strong>/Van Loghum Slaterus.Jongbloed, Aad (1996), Voor koning(in) en vaderland. Dienstplicht door de jaren heen. Zutphen: Alpha.<strong>Poppel</strong>, <strong>Frans</strong> <strong>van</strong> (1992), Trouwen in Nederland. Een historisch-demografische studie <strong>van</strong> de 19 e - envroeg 20 e eeuw. Wageningen: A.A.G. Bijdragen 33.Stoker, Donald, Frederick C. Schneid and Harold D. Blanton (eds.) (2009), Conscription in the Napoleonicera. A revolution in military affairs? London and New York: Routledge.Welten, Joost (2007), In dienst voor Napoleon’s Europese droom. De verstoring <strong>van</strong> deplattelandssamenleving in Weert. Leuven: Davidsfonds.Woolf, Stuart (1991), Napoleon’s integration <strong>of</strong> Europe. London and New York: Routledge.68
Religious and socio-economic determinants <strong>of</strong> fertility limitation by birthspacing: Results <strong>of</strong> the Historical Sample <strong>of</strong> the NetherlandsAart C. LiefbroerIntroduction<strong>Frans</strong> <strong>van</strong> <strong>Poppel</strong> is a towering figure in Dutch and European historical demography. Hehas made major contributions to our understanding <strong>of</strong> population developments since thenineteenth century. He is one <strong>of</strong> the rare demographers that has studied all major types <strong>of</strong>demographic processes – mortality, fertility, union formation and dissolution, householdcomposition, and migration. I am proud that I, as a fellow researcher at the NetherlandsInterdisciplinary Demographic Institute, have had the privilege to collaborate with <strong>Frans</strong> ona number <strong>of</strong> articles. I have never encountered someone who had read so widely about anytopic, and yet had the amazing ability to combine this vast knowledge with very meticulousquantitative –and sometimes qualitative– research.In this short essay, I will present some new results on religious and socio-economicdifferentials in birth spacing among cohorts born between 1850 and 1920 in the Netherlands.I am a bit hesitant to tackle the topic, given <strong>Frans</strong>’s extensive work on the issue (Schellekensand Van <strong>Poppel</strong>, 2006; Somers and Van <strong>Poppel</strong>, 2010 and Van <strong>Poppel</strong> and Roling, 2003) andthe excellent study by Van Bavel and Kok (2010). Still, I have several reasons to discuss itnonetheless. First, fertility control is a topic that clearly has <strong>Frans</strong>’s interest. Second, I willuse data from the Historical Sample <strong>of</strong> the Netherlands (HSN). <strong>Frans</strong> has been involved in theconstruction and development <strong>of</strong> the HSN from its inception (and has been a Board Member<strong>of</strong> the HSN since the start) and has widely used it in his own research. A big ad<strong>van</strong>tage<strong>of</strong> the HSN is its large sample size, which makes it possible to test whether some <strong>of</strong> thefindings from Schellekens and Van <strong>Poppel</strong> (2006) and Van Bavel and Kok (2010) also holdin a larger dataset. In addition, the data allow a first test whether social differentials in usingbirth spacing as a fertility limitation mechanism changed over time.If individuals and couples wanted to limit their fertility in the Netherlands in the nineteenthcentury, there were basically two ways open to them. First, given the close links betweensexual activity and marriage, they could postpone marriage, thus leading to a relativelylate age at entry into parenthood. Second, they could try to avoid or postpone births oncechildbearing had started. Couples who did so, would have longer periods elapsing betweensubsequent births. An important question relating to the use <strong>of</strong> birth spacing as a method tolimit fertility is whether the use <strong>of</strong> this method was more widespread among some socialgroups than among others. Earlier research (cited above) suggests that the use <strong>of</strong> this methodwas more widespread among liberal Protestants and Jews than among orthodox Protestantsand Roman-Catholics. Results for socio-economic groups were less clear, with Schellekensand Van <strong>Poppel</strong> (2006) in The Hague finding longer birth intervals for the elite and the pettybourgeoisie than for blue collar workers, whereas Van Bavel and Kok (2010) in a study on theprovince <strong>of</strong> Utrecht, the village <strong>of</strong> Akersloot and the city <strong>of</strong> Amsterdam report shorter birthintervals for white collar workers than for blue collar ones.69
DataTo examine this issue, I use data from the HSN (see Van <strong>Poppel</strong> et al., 2012 for informationon sample selection and measurement <strong>of</strong> the variables). I have information on all live birthsto couples. Because <strong>of</strong> my focus on birth spacing, I only select those birth intervals thatend with a live birth. In all, I have information on 23,624 closed birth intervals from 6,051married couples. I performed a multi-level binary logistic regression analysis, comparingbirth intervals <strong>of</strong> more than two years and nine months to birth intervals <strong>of</strong> two years andnine months or less. This cut-<strong>of</strong>f implies that I assume that birth intervals in which it takescouples more than two years to have a conception that leads up to a new birth are indicative<strong>of</strong> conscious efforts <strong>of</strong> birth limitation. In all, 29.6 per cent <strong>of</strong> all birth intervals were longerthan two years and nine months. I also experimented with other cut-<strong>of</strong>fs. Overall, results werepretty similar. In all models, I controlled for wife’s age at previous birth, parity, and birthcohort. In addition, I estimated an individual-level variance term, allowing for a control forunobserved heterogeneity (full results are obtainable from the author on request).ResultsIn figure 1, I present relative odds ratios <strong>of</strong> having a birth interval <strong>of</strong> more than 2¾ year byreligious denomination <strong>of</strong> the couple. <strong>Liber</strong>al Protestants are taken as the reference categorywith a relative odds ratio <strong>of</strong> 1. It turns out that liberal Protestant couples were most likely topostpone a next birth for so long. Catholic couples had an odds ratio to postpone for morethan 2¾ year that was only one third <strong>of</strong> that <strong>of</strong> the liberal Protestants, and mixed couplesand orthodox Protestants also had much lower odds ratios. The odds ratio for Jews was theonly one that is not statistically significant different from that <strong>of</strong> the liberal Protestants. Thissuggests that birth limitation by extending birth spacing was much more common amongliberal Protestant couples than among any other type (with the exception <strong>of</strong> Jewish couples).In additional analyses (results not shown), it turned out that, overall, the odds that coupleshad birth intervals <strong>of</strong> more than 2¾ years increased by birth cohort. However, this increasewas much smaller for Catholics, orthodox Protestants and couples with an ‘other’ religiousbackground, suggesting that liberal Protestants and Jews were not only already more likely toconsciously space their birth midway through the 19 th century, but were also much more likelyto increase the use <strong>of</strong> this method during the demographic transition period under scrutiny.In figure 2, I present the same type <strong>of</strong> results, but now by socio-economic class. Unskilledworkers are the reference category, and have a relative odds ratio <strong>of</strong> 1. Overall, three differentgroups can be distinguished. The elite and the middle class (white-collar workers and pettybourgeoisie) had the highest odds ratios and were thus most likely to use birth spacing as abirth limitation strategy. All types <strong>of</strong> blue-collar workers constituted a middle group, whereasfarmers were clearly least likely to have long birth intervals. All socio-economic classes, withthe exception <strong>of</strong> the farmers, became increasingly likely to use birth spacing as a birth controlstrategy throughout the demographic transition. The farmers were the only socio-economicclass that did not change its behaviour in this regard at all across birth cohorts.70
Figure 1. Relative odds ratios <strong>of</strong> having a next birth more than 2¾ years after a previous one, byreligious denominationFigure 2. Relative odds ratios <strong>of</strong> having a next birth more than 2¾ years after a previous one, bysocio-economic class71
ConclusionThese results confirm the finding <strong>of</strong> Schellekens and Van <strong>Poppel</strong> (2006) that 19 th centuryCatholics were less likely to use birth spacing as a fertility limitation strategy than Protestants.However, the HSN also allows to distinguish between liberal and orthodox Protestants, andthus allows me to qualify that earlier finding. <strong>Liber</strong>al Protestants differed in this respect fromCatholics and orthodox Protestants behaved very much like Catholics did. These latter twogroups were much more reluctant to use birth spacing as a fertility limitation mechanism inthe 19 th century and the most resilient to change. My results also confirm many <strong>of</strong> the findings<strong>of</strong> Van Bavel and Kok (2010), again with one important exception. The higher classes werefound to be more likely to have long birth intervals, thus suggesting that using birth spacingas a fertility limitation strategy was most common among these social classes. Farmers wereclearly least likely to have long birth intervals, and they also were extremely resilient tochange.ReferencesBavel, J. Van and J. Kok (2010), A mixed effects model <strong>of</strong> birth spacing for pre-transition populations. TheHistory <strong>of</strong> the Family, 15(2), pp. 125-138.<strong>Poppel</strong>, F. <strong>van</strong>, D. Reher, A. Sanz-Gimeno, M. Sanchez-Dominguez and E. Beekink (2012), Mortalitydecline and reproductive change during the Dutch demographic transition: Revisiting a traditionaldebate with new data. Demographic Research, 27, pp. 299-338.<strong>Poppel</strong>, F. <strong>van</strong> and H. Roling (2003), Physicians and fertility control in the Netherlands. Journal <strong>of</strong>Interdisciplinary History, 34(2), pp. 155-185.Schellekens, J. and F. <strong>van</strong> <strong>Poppel</strong> (2006), Religious differentials in marital fertility in The Hague(Netherlands) 1860-1909. Population Studies, 60(1), pp. 23-38.Somers, A. and F. <strong>van</strong> <strong>Poppel</strong> (2010), Priest, parishioner and posterity: A Dutch urban legend or historicalfact? The History <strong>of</strong> the Family, 15(2), pp. 174-190.72
Long term trends in social and geographical homogamy:A plea for an integrated approachIneke Maas, Marco H.D. <strong>van</strong> Leeuwen and Richard L. ZijdemanLong term changes and regional variations in social and geographical homogamy havereceived quite some attention in historical, demographic, and sociological research. Studies<strong>of</strong> geographical homogamy in the Netherlands in the 19 th and 20 th century show a strongtendency for people to marry someone living nearby (Ekamper, Van <strong>Poppel</strong> and Mandemakers,2011; Maas and Zijdeman, 2010 and Van <strong>Poppel</strong> and Ekamper, 2005). Most studies show thatduring the 19 th and 20 th centuries geographical homogamy decreased, meaning that peoplefound their partner at a larger distance (Kok and Mandemakers, 2008; Maas and Zijdeman,2010 and Van <strong>Poppel</strong> and Ekamper, 2005).Research on social homogamy shows that grooms who either had a high occupational statusthemselves or came from a high-status family married higher-status brides (Van Leeuwenand Maas, 2002; 2010). The influence <strong>of</strong> the father decreased over time (Zijdeman andMaas, 2010). Trends in social homogamy on achieved characteristics, such as own status andeducation, are less clear (De Graaf, Smeenk, Ultee and Timm, 2003).Most studies on social homogamy do not consider geographical homogamy. The same istrue the other way around. Here we argue in favor <strong>of</strong> an integrated study <strong>of</strong> the two types <strong>of</strong>homogamy.Common explanations for social and geographical homogamyExplanations <strong>of</strong> both types <strong>of</strong> homogamy are <strong>of</strong>ten based on the same general theory <strong>of</strong>preferences, opportunities and third parties (Kalmijn, 1998 and Van Leeuwen and Maas, 2005).Additionally, authors trying to explain decreasing geographical homogamy or decreasinghomogamy <strong>of</strong> social background use similar assumptions. They refer to modernizationprocesses, such as the development <strong>of</strong> new means <strong>of</strong> mass transport and the appearance <strong>of</strong>mass communication (Kok and Mandemakers, 2008; Van <strong>Poppel</strong> and Ekamper, 2005; Uunk,1996 and Zijdeman and Maas, 2010). These two aspects <strong>of</strong> modernization affect homogamythrough different mechanisms. Means <strong>of</strong> mass transport allow people to travel over largerdistances and increase the likelihood <strong>of</strong> finding a partner outside the local region or outsidethe same social stratum: An opportunity based explanation. Mass communication however isthought to be instrumental in spreading information on events, technological developments,fashion, and employment beyond local regions. People from different regions and differentsocial strata may therefore have become more alike and perceived cultural differencesmay have decreased. As a consequence geographical and social homogamy decreased: Apreference based explanation.If two phenomena are hypothesized to vary with the same determinants, analyzing themtogether has the ad<strong>van</strong>tage <strong>of</strong> increasing power. We can have more confidence in either adouble refutation <strong>of</strong> a hypothesis or a double confirmation. If, unexpectedly, hypotheses are73
confirmed for one dependent variable, but not for the other, it has become clear that thetheoretical framework should at least be refined.Regional differences in social homogamySome explanations <strong>of</strong> the likelihood <strong>of</strong> social homogamy predict substantial regionaldifferences. For example according to the thesis <strong>of</strong> industrialism it became more rationalfor employers in industrial labor markets to select employees on the basis <strong>of</strong> achievedcharacteristics, such as the level <strong>of</strong> education, than on the basis <strong>of</strong> ascribed characteristics.Accordingly, in industrializing regions achieved characteristics became more importantpredictors <strong>of</strong> an individual’s success on the labor market than ascribed characteristics (Blauand Duncan, 1967). This is assumed to have consequences for mate selection as well. One<strong>of</strong> the characteristics valued by suitors in each other is (future) economic success (Kalmijn,1998). In industrialized societies and regions, ascribed characteristics should therefore be lessimportant for mate selection and achieved characteristics more important, compared withpreindustrial societies (Uunk, 1996). Macro-level developments such as industrialization didnot occur throughout society at the same time. Some regions remained mainly agriculturallong after industrialization had begun in other regions. Consequently, mate selection isexpected to differ regionally (Bras and Kok, 2005 and Zijdeman and Maas, 2010).To what extent regional differences in social homogamy exist, however, strongly depends onthe extent <strong>of</strong> geographical homogamy. If a couple consists <strong>of</strong> a bride and bridegroom from twodifferent regions, the relationship between regional characteristics and social homogamy iscomplicated. Most studies linking social homogamy to industrialization consider the place <strong>of</strong>marriage as the rele<strong>van</strong>t region. However, according to the male breadwinner model the place<strong>of</strong> socialization <strong>of</strong> the bridegroom might be more rele<strong>van</strong>t. Or, alternatively, one might arguethat the place <strong>of</strong> socialization <strong>of</strong> the bride is most rele<strong>van</strong>t, because she (and her family) selecta spouse most able to give her an economically flourishing future. Characteristics <strong>of</strong> the place<strong>of</strong> marriage may be good predictors <strong>of</strong> the marital choices <strong>of</strong> the couple, because this might bethe place where they are likely to settle after marriage (although customs sometimes requirecouples to marry in the place where the bride was born). Finally, geographical mobility itself–irrespective <strong>of</strong> place <strong>of</strong> origin and destination– has been shown to increase the likelihood <strong>of</strong>a socially heterogamous marriage (Pélissier, Rébaudo, Van Leeuwen and Maas, 2005).Rival hypotheses thus exist, and at the very least, geographical homogamy should betheoretically considered when analyzing regional differences in social homogamy. Evenbetter would be an integrated analysis, in which characteristics <strong>of</strong> places <strong>of</strong> residence beforeand at marriage <strong>of</strong> both bride and bridegroom can explain social homogamy.Social differences in geographical homogamyEarlier studies have shown that marriage partners born in different regions –who marriedgeographically heterogamous– more <strong>of</strong>ten belong to higher than to lower social strata(Ekamper, Van <strong>Poppel</strong> and Mandemakers, 2011; Kok, 1998 and Van <strong>Poppel</strong> and Ekamper,2005). There are several possible explanations for this finding. Higher status groups have74
more resources that they can use to travel over large distances. They more <strong>of</strong>ten attendedhigher education, which is assumed to have taught them more universalistic values. As aconsequence cultural differences between people living in different regions should matterless for them. But one can also reason differently. Higher status groups have more resources,and thus have more to loose when marrying someone from a lower group. Therefore ahomogamous marriage is especially important for them. In small communities, they may notbe able to find an acceptable marriage partner, forcing them to marry someone from furtheraway.There is some research indicating that when the size <strong>of</strong> the marriage market increased duringthe 20 th century differences between the social strata in the likelihood <strong>of</strong> a geographicallyheterogamous marriage became smaller (Van <strong>Poppel</strong> and Ekamper, 2005 and Van <strong>Poppel</strong>,Ekamper and Van Solinge, 2007). In line with the previously mentioned explanations thiscould be the result <strong>of</strong> the spread <strong>of</strong> mass transport, enabling lower classes to travel over longerdistances as well, and it could result from educational expansion and a spread <strong>of</strong> universalisticvalues over all classes.When thinking about differences in geographical homogamy it is almost impossible to ignorehomogamy on other dimensions. Living at a certain distance from each other is inconvenientwhen courting, but, unlike other characteristics, it is not enduring – after marriage the distanceis <strong>of</strong>ten immediately minimized and thus disappears. Geographical homogamy mainlycomes about as a consequence <strong>of</strong> preferences <strong>of</strong> potential spouses for homogamy on othercharacteristics and the varying opportunities to find such a person nearby.ConclusionGeographical and social mobility are intertwined to such an extent that analyzing themseparately leads to incomplete and maybe even misleading conclusions. Researchers interestedin geographical homogamy are well advised to consider homogamy on other dimensions aswell, such as social homogamy, but also religious and age homogamy (Kalmijn, Liefbroer,Van <strong>Poppel</strong> and Van Solinge, 2006; Van <strong>Poppel</strong>, Liefbroer, Vermunt and Smeenk, 2001 andVan <strong>Poppel</strong> and Liefbroer, 2001). Those who are primarily interested in social homogamyshould think about consequences <strong>of</strong> geographical mobility and homogamy, especially whenthey are interested in regional differences and macro-level explanations.This book is devoted to the scholarly work <strong>of</strong> <strong>Frans</strong> <strong>van</strong> <strong>Poppel</strong>. His work is an excellentstepping stone for an integrated approach <strong>of</strong> social and geographical homogamy. He publisheson marriage in general (Van <strong>Poppel</strong>, 1992) and on social, geographical and other types <strong>of</strong>homogamy (cited above). And he plays an important role in the collection <strong>of</strong> micro-historicaldata, such as the Historical Sample <strong>of</strong> the Netherlands, currently as its chairperson. Wepersonally learned a lot from him and have many reasons to be grateful. <strong>Frans</strong>: thank you!75
ReferencesBlau, Peter M. and Otis Dudley Duncan (1967), The American occupational structure. New York: JohnWiley & Sons.Bras, Hilde and Jan Kok (2005), They live in indifference together: Marriage mobility in Zeeland, theNetherlands, 1796-1922. In M.H.D. <strong>van</strong> Leeuwen, I. Maas and A. Miles (eds.). Marriage choices andclass boundaries: Social endogamy in history (pp. 181–211). Cambridge University Press.Ekamper, Peter, <strong>Frans</strong> <strong>van</strong> <strong>Poppel</strong> and Kees Mandemakers (2011), Widening horizons? The geography<strong>of</strong> the marriage market in 19 th - and early-20 th century Netherlands. In M. Gutmann, G. Deane, E.Merchant and K. Sylvester (eds.). Navigating time and space in population studies (pp. 115-160).International Studies in Population 9, Springer.Graaf, Nan Dirk de, Wilma Smeenk, Wout Ultee and Andreas Timm (2003), The when and whom <strong>of</strong> firstmarriage in the Netherlands. In H.-P. Blossfeld and A. Timm (eds.). Who marries whom? Educationalsystems as marriage markets in modern societies (pp. 79-112). Dordrecht/Boston/London: KluwerAcademic Publishers.Kalmijn, Matthijs (1998), Intermarriage and homogamy: causes, patterns, trends. Annual Review <strong>of</strong>Sociology, 24, pp. 395-421.Kalmijn, M., A.C. Liefbroer, F. <strong>van</strong> <strong>Poppel</strong> and H. <strong>van</strong> Solinge (2006), The family factor in Jewish-Gentileintermarriage: A sibling analysis <strong>of</strong> the Netherlands. Social Forces, 84, pp. 1348-1358.Kok, Jan (1998). Vrijt daar je zijt; huwelijk en partnerkeuze in Zeeland tussen 1830 en 1950. Zeeland, 7,pp. 131-143.Kok, Jan and Kees Mandemakers (2008), Free choice from a limited supply. The marriage market in twoDutch provinces, 1840-1940. Romanian Journal <strong>of</strong> Population Studies, 2, pp. 82-104.Leeuwen, Marco H.D. <strong>van</strong> and Ineke Maas (2002), Partner choice and homogamy in the 19 th century: Wasthere a sexual revolution in Europe? Journal <strong>of</strong> Social History, 36, pp.101-123.Leeuwen Marco H.D. <strong>van</strong> and Ineke Maas (2005), Endogamy and social class in history: An overview.International Review <strong>of</strong> Social History, 50, supplement on marriage choices and class boundaries:social endogamy in history, pp. 1-24.Leeuwen Marco H.D. <strong>van</strong> and Ineke Maas (2010), Historical studies <strong>of</strong> social stratification and mobility.Annual Review <strong>of</strong> Sociology, 36, pp. 429-451.Maas, Ineke and Richard Zijdeman (2010), Beyond the local marriage market. The influence <strong>of</strong>modernization on geographical heterogamy. Demographic Research, 23, pp. 933-962.Pélissier, Jean-Pierre, Danièlle Rébaudo, Marco H.D. <strong>van</strong> Leeuwen and Ineke Maas (2005), Migration andendogamy according to social class: France, 1803-1986. In Marco H.D. <strong>van</strong> Leeuwen, Ineke Maas andAndrew Miles (eds.), Marriage choices and class boundaries: Social endogamy in history (pp. 219-246). Cambridge University Press.<strong>Poppel</strong>, <strong>Frans</strong> <strong>van</strong> (1992), Trouwen in Nederland. Een historisch-demografische studie <strong>van</strong> de 19 e envroeg-20 e eeuw. Wageningen A.A.G. Bijdragen 33.<strong>Poppel</strong>, <strong>Frans</strong> <strong>van</strong> and Peter Ekamper (2005), De Goudse horizon verruimd. Veranderingen in de herkomst<strong>van</strong> Goudse bruiden en bruidegoms. In J. Kok and M.H.D. <strong>van</strong> Leeuwen (eds.), Genegenheid engelegenheid. Twee eeuwen partnerkeuze en huwelijk (pp. 181-211). Amsterdam: Aksant.<strong>Poppel</strong>, <strong>Frans</strong> <strong>van</strong>, P. Ekamper and H. <strong>van</strong> Solinge (2007). Farmer looking for a wife: Marital behaviour<strong>of</strong> the farming population in 19 th century Netherlands. In H. Moerbeek, A. Nieh<strong>of</strong> and J. <strong>van</strong> Ophem(eds.), Changing families and their lifestyles (pp. 51-76). Mansholt publication series, Volume 5.Wageningen: Wageningen Academic Publishers.76
<strong>Poppel</strong>, <strong>Frans</strong> <strong>van</strong> and A.C. Liefbroer (2001), Leeftijdsverschillen tussen huwelijkspartners: een interpretatie<strong>van</strong> veranderingen en verschillen in de 19 e en 20 e eeuw. Tijdschrift voor Sociale Geschiedenis, 7, pp.129-152.<strong>Poppel</strong>, <strong>Frans</strong> <strong>van</strong>, A.C. Liefbroer, J.K. Vermunt and W. Smeenk (2001), Love, necessity and opportunity:Changing patterns <strong>of</strong> marital age homogamy in the Netherlands, 1850-1993. Population Studies, 55,pp. 1-14.Uunk, Wilfred (1996), Who marries whom? The role <strong>of</strong> social origin, education and high culture in mateselection <strong>of</strong> industrial societies during the 20 th century. Nijmegen: Thesis.Zijdeman, Richard and Ineke Maas (2010), Changes in mate selection during industrialization: A test<strong>of</strong> modernization hypotheses in a Dutch province, 1811-1915. Research in Social Stratification andMobility, 28, pp. 395-415.77
78Origins <strong>of</strong> the ‘western European marriage pattern’Jona Schellekens<strong>Frans</strong> and I first met through our common interest in historical nuptiality patterns. ThereforeI would like to devote this essay in his honour to reflections on the origins <strong>of</strong> the westernEuropean Marriage Pattern (EMP). As <strong>Frans</strong> would have expected me to do, I will takesocio-economic stratification into account (e.g. Van <strong>Poppel</strong> and Nelissen, 1999a). This essaywill focus on the lower classes.Long before marital fertility started to decline, nuptiality was already low in northwesternEurope. John Hajnal (1965) was the first demographer to draw attention to this phenomenon.He thought an origin <strong>of</strong> the pattern <strong>of</strong> low nuptiality in the 16 th century to be likely. Morerecent research, however, suggests that in England nuptiality was already low in the secondhalf <strong>of</strong> the 14 th century (Smith 1979, pp. 83-4 and Goldberg, 1992, pp. 203-79).Hajnal was also the first to suggest an explanation: “The economic system influences themarriage pattern through the arrangements by which the economic basis for the support <strong>of</strong>a couple and their children is established” (1965, p. 132). Ultimately, Hajnal’s explanationgoes back to Malthus’ model <strong>of</strong> the preventive check. Malthus’ model reflects middle-classvalues, which he and his followers wished to impose on the lower classes (Van <strong>Poppel</strong> andNelissen, 1999b, pp. 59-63). Whereas children <strong>of</strong> middle-class parents could <strong>of</strong>ten count onintergenerational transfers, children from the lower classes were much less likely to receiveenough assets from their parents.In rural areas, agricultural labourers made up the bulk <strong>of</strong> the lower class. Even though farmser<strong>van</strong>ts came from all layers <strong>of</strong> rural society, a disproportionate number were children<strong>of</strong> agricultural labourers (Mitterauer, 1990, p. 21). Peter Laslett (1977) called the type <strong>of</strong>ser<strong>van</strong>t typical <strong>of</strong> northwestern Europe ‘life-cycle’ ser<strong>van</strong>ts, because service usually wasa stage in the life cycle during which they were not allowed to marry. Tony Wrigley andRoger Sch<strong>of</strong>ield (1981) asserted that the timing <strong>of</strong> the marriage <strong>of</strong> farm ser<strong>van</strong>ts was mostlya function <strong>of</strong> the time needed to save enough assets to set up an independent household. Intheir neo-Malthusian model falling real incomes raised the time needed to accumulate enoughresources to set up an independent household. This neo-Malthusian model, however, raises atleast two problems (for more problems see Weir, 1984 and reply by Sch<strong>of</strong>ield, 1985). First,Malthus proposed a different model for ser<strong>van</strong>ts. And second, the neo-Malthusian model doesnot seem to fit the data.Even if farm ser<strong>van</strong>ts were able to save toward marriage, it does not follow from this that theywould marry as soon as they had accumulated sufficient assets to set up a household. Livingin farmhouses, where they were better fed and had more comforts than in a cottage, ser<strong>van</strong>tsenjoyed a relatively high standard <strong>of</strong> living compared with what many <strong>of</strong> them could expectafter marriage. Hence, ser<strong>van</strong>ts were in no rush to get married (Schellekens, 1991 and 1997).Malthus (1826, p. 399) mentions a similar mechanism, when discussing the postponement
<strong>of</strong> marriage among domestic ser<strong>van</strong>ts: “The ser<strong>van</strong>ts who live in the families <strong>of</strong> the rich… possess the necessaries, and even the comforts <strong>of</strong> life, almost in as great plenty as theirmasters. Their work is easy and their food luxurious, compared with the work and food <strong>of</strong> theclass <strong>of</strong> labourers; “ […] The greater number <strong>of</strong> them, therefore, deterred by this uninvitingview <strong>of</strong> their future situation, content themselves with remaining single [...].”In the Middle Ages the degree to which a ser<strong>van</strong>t could save may have been limited. Femaleser<strong>van</strong>ts <strong>of</strong>ten worked purely for their food, lodging, and clothes (Goldberg, 1992, pp.185-86). Hence, Jeremy Goldberg (1992, pp. 345-56) preferred an “anti-Malthusian” model<strong>of</strong> nuptiality, in which an increase in the demand for female ser<strong>van</strong>ts suppresses nuptiality.Thus, after the Black Death the expansion <strong>of</strong> pastoral agriculture suppressed nuptiality byraising the demand for maidser<strong>van</strong>ts (see also Voigtländer and Voth, 2009, pp. 251-52).Wrigley and Sch<strong>of</strong>ield (1981) asserted that long-term trends in real wages explain long-termtrends in English nuptiality (see also Smith 1981). Ann Kussmaul (1981, pp. 111-112), on theother hand, asserted that long-term trends in the demand for farm ser<strong>van</strong>ts explain long-termtrends in nuptiality. Her anti-Malthusian model seems to fit the data for eighteenth-centuryEngland better than the neo-Malthusian model <strong>of</strong> Wrigley and Sch<strong>of</strong>ield (Schellekens, 1997;2001, pp. 5-6).The anti-Malthusian model may explain long-term trends in nuptiality, but it does not explainthe origins <strong>of</strong> the EMP. Carl Hammer (1983, p. 247) noticed that the area where the EMP isto be found in the early modern period is precisely the area <strong>of</strong> the medieval manorial system.Hence, he suggested that the origins <strong>of</strong> the EMP are to be found in restrictions imposed bymanor lords on the nuptial behavior <strong>of</strong> their tenants (see also Mitterauer, 1990, pp. 27-28).The medieval manor was an agricultural estate divided into two parts. The first was thedemesne owned by the lord; the second consisted <strong>of</strong> smaller farms held on terms that requiredtenants to perform labour services for the lord and to make incidental payments to him in kindand cash.To the extent that his model <strong>of</strong> worker exchange fits the ninth-century Bavarian data, Hammer(1983, pp. 245-248) appears to have uncovered the oldest evidence for life-cycle ser<strong>van</strong>ts.They were employed on the demesne and on larger tenant farms. These ser<strong>van</strong>ts were notthe children <strong>of</strong> free tenants, however, but <strong>of</strong> serfs. If Hammer is correct, however, how do weexplain the survival <strong>of</strong> an institution that had its roots in forced labour (Mitterauer, 1990, p.28)? What made farm service so attractive that it survived the manorial system? FollowingMalthus (1826, p. 399), I would like to suggest that farm ser<strong>van</strong>ts who were recruited on afree labour market, replacing the forced labour from the manor, contented themselves withremaining single, because in the farmhouse <strong>of</strong> their employer they were better fed and hadmore comforts than in a cottage.79
ReferencesGoldberg, P.J.P. (1992), Women, work, and life cycle in a Medieval economy: Women in York and Yorkshirec. 1300-1520. Oxford: Clarendon Press.Hajnal, John (1965), European marriage patterns in perspective, pp. 101-38. In D. . Glass and D.E.C.Eversley (eds.), Population in history: Essays in historical demography. London: Edward Arnold.Hammer, Carl I. (1983), Family and familia in early medieval Bavaria, pp. 217-48. In Richard Wall (ed.),Family forms in historic Europe. Cambridge: Cambridge University Press.Kussmaul, Ann (1981), Ser<strong>van</strong>ts in husbandry in early modern England. Cambridge: CambridgeUniversity Press.Laslett, Peter (1977), Characteristics <strong>of</strong> the Western family considered over time. Journal <strong>of</strong> FamilyHistory, 2(2), pp. 89-116.Malthus, Thomas Robert (1826), An essay on the principle <strong>of</strong> population. London: John Murray.Mitterauer, Michael (1990), Ser<strong>van</strong>ts and youth. Continuity and Change, 5(1), pp. 11-38.<strong>Poppel</strong> <strong>Frans</strong> <strong>van</strong> and Jan Nelissen (1999a), Economic opportunities and age at marriage: An analysis <strong>of</strong>19 th -century micro data for the Netherlands, pp.152-78. In Isabelle Devos and Liam Kennedy (eds.),Marriage and rural economy: Western Europe since 1400 (Turnhout: Brepols).<strong>Poppel</strong>, <strong>Frans</strong> <strong>van</strong> and Jan Nelissen (1999b), The proper age to marry: Social norms and behavior in 19 th -century Netherlands. History <strong>of</strong> the Family, 4(1), pp. 51-75.Schellekens, Jona (1991), Determinants <strong>of</strong> marriage patterns among farmers and agricultural laborers intwo 18 th -Century Dutch villages. Journal <strong>of</strong> Family History, 16, pp. 139-55.Schellekens, Jona (1997), Nuptiality during the first industrial revolution in England: Explanations. Journal<strong>of</strong> Disciplinary History, 27(4), pp. 637-54.Schellekens, Jona (2001), Economic change and infant mortality in England, 1580-1837. Journal <strong>of</strong>Disciplinary History, 32(1), pp. 1-13.Sch<strong>of</strong>ield, Roger (1985). English marriage patterns revisited. Journal <strong>of</strong> Family History, 10(1), pp. 2-20.Smith, Richard M. (1979), Some reflections on the evidence <strong>of</strong> the origins <strong>of</strong> the ‘European marriagepattern’ in England, pp. 74-112. In C. Harris (ed.), The sociology <strong>of</strong> the family (Keele: University <strong>of</strong>Keele).Smith, Richard M. (1981), Fertility, economy, and household formation in England over three centuries.Population Development Review, 7(4), pp. 595-622.Voigtländer, Nico and Hans-Joachim Voth (2009), Malthusian dynamism and the rise <strong>of</strong> Europe: Makewar, not love. American Economic Review, 99(2), pp. 248-54.Weir, David R. (1984), Rather never than late: Celibacy and age at marriage in English cohort fertility.Journal <strong>of</strong> Family History, 9(4), pp. 340-54.Wrigley, E.A. and R.S. Sch<strong>of</strong>ield (1981), The population history <strong>of</strong> England 1541-1871: A reconstruction.London: Edward Arnold.80
The West European marriage system in early modern EuropeTony WrigleyAdam Smith, Thomas Malthus and David Ricardo were unanimous and firm in insistingthat while economic growth was possible it was necessarily limited. The path <strong>of</strong> growth wasasymptotic; it could not become exponential. This conclusion stemmed from the fact that,while the supply <strong>of</strong> labour and <strong>of</strong> capital might be extended as required, the supply <strong>of</strong> landcould not be similarly extended. Since the land supplied almost all the raw materials whichentered production as well as all food supplies, economic expansion either meant taking intocultivation poorer land or using existing farmland more intensively which in turn must meandeclining returns both to labour and capital. In short, the very process <strong>of</strong> growth involvedchanges which must at some stage bring it to a halt.The implications <strong>of</strong> this scenario for the standard <strong>of</strong> living <strong>of</strong> the population were gloomy,especially if linked to the argument which Malthus developed about the character <strong>of</strong> thedemography <strong>of</strong> the societies <strong>of</strong> his day. He suggested that at best output might grow byarithmetic progression but population would rise by geometric progression unless checked. Aperiod <strong>of</strong> comparative prosperity would allow fertility rates to stay well clear <strong>of</strong> mortality ratesand the population would increase but at some point this would cause heightened pressure onavailable resources, mortality would rise, and population growth would cease with the bulk <strong>of</strong>the population living close to the subsistence level. Malthus had published the first Essay asa young man aged 32 and subsequently modified the rigour <strong>of</strong> his initial stance considerablybut it was the argument <strong>of</strong> the first Essay which lodged in the public mind.The model which Malthus had sketched proved influential in many contexts. It was, forexample, reading the Essay which suggested to Charles Darwin a simple and invariantmechanism to drive the process <strong>of</strong> natural selection in animal populations. In humanpopulations, however, matters were less simple. Fertility levels were strongly affected bynuptiality and, since marriage customs differed substantially between societies, his model inits simplest form failed to do justice to a complex reality.An account <strong>of</strong> the West European marriage system (WEM) in comparison with other marriagesystems illustrates the limitations <strong>of</strong> a simple model in doing justice to the complexity <strong>of</strong>individual and social behaviour. Even supposing that in organic societies economic growthmust cease because <strong>of</strong> the land constraint and that when this occurs population growth willalso cease with fertility and mortality both at the same level, it does not follow that thisimplies an equal degree <strong>of</strong> misery in different populations. Figure 1 illustrates the point.Where fertility is high invariant mortality must at some point rise to the same level placingthe community in question under great stress and causing a severe decline in living standards.Fertility, however may be invariant but at a lower level. In this case also, mortality will riseto equal it, but growth will cease at a point which leaves living standards at a higher level. Iffertility also is responsive to pressure and declines as living standards deteriorate a still morefavourable outcome is possible. The nature <strong>of</strong> the WEM makes this relatively favourableoutcome more likely.81
Figure 1. Fertility, mortality, and living standardsA key feature <strong>of</strong> this system was that a newly married couple were normally expected tocreate a new household rather than to join an existing one. There was therefore an economichurdle to be surmounted before a marriage could take place which would cause marriage tobe delayed if economic circumstances were unfavourable. For example, figure 2 shows thatin England in the 17 th and 18 th centuries trends in real wages and the average age at marriagemoved in parallel. When conditions were hard marriage age rose; when conditions improvedmarriage age declined. Moreover, whereas in most other societies marriage for women notonly took place soon after attaining sexual maturity (indeed in some societies frequentlybefore this point), it was also virtually universal. In general only women with serious physicalor mental handicaps remained single. But in the WEM a significant proportion <strong>of</strong> each risinggeneration <strong>of</strong> women never married, and the prevalence <strong>of</strong> celibacy might also be sensitive toeconomic conditions. The WEM was therefore conducive to somewhat higher living standardsthan was common in other societies, and given the characteristic income elasticity <strong>of</strong> demand82
Figure 2. Real wages, female age at marriage, and the crude first marriage rate in early modernEnglandfor basic necessities compared to other products, the structure <strong>of</strong> aggregate consumer demandunder the WEM would encourage the development <strong>of</strong> a wider range <strong>of</strong> industrial production.A further benefit <strong>of</strong> a low-pressure demographic system (i.e. one in which both fertility andmortality are relatively low) stems from the fact that where fertility is comparatively lowthe age structure will be such that a higher proportion <strong>of</strong> the population is <strong>of</strong> working agethan where fertility is higher. A lower dependency ratio implies a higher standard <strong>of</strong> living,ceteris paribus. Similarly, since lower mortality meant that a higher proportion <strong>of</strong> each newgeneration survived to working age, the proportion <strong>of</strong> the community’s resources devotedto the sustenance <strong>of</strong> children who do not survive is lower in a low-pressure environment.Furthermore, since unmarried women participated more fully in production activities thanmarried women, late marriage and relatively high celibacy levels were also attended witheconomic benefits.It was not necessarily the case that in societies where marriage for women occurred early inlife and few women remained unmarried fertility and mortality were higher than was normalin a West European setting. A variety <strong>of</strong> practices might result in relatively long birth intervalsand a wide prevalence <strong>of</strong> infanticide might produce a similar result, as, for example, in 18 th83
century Nakahara. 1 Nevertheless, it is reasonable to suppose that the West European marriagesystem was attended by significant economic benefits when compared with the systemsprevalent in much <strong>of</strong> the world before the industrial revolution.1T.C. Smith, Nakahara, Family farming and population in a Japanese village, pp. 1717-183084
Part IVAging and Mortality
86Are we getting sick <strong>of</strong> low incomes?Tommy BengtssonIn the last few years, increasing health differentials between social groups have received a lot<strong>of</strong> attention (Marmot, 2010). It has been argued that we become sick not only because <strong>of</strong> lowincome, but also because <strong>of</strong> increasing income differentials (Wilkinson, 1996; Wilkinson andPicket, 2006). Social differences in health have in recent time diverged not only in low-incomebut also in high-income countries. This is in stark contrast to the early post-war period whenimprovements in life expectancy in many countries made health authorities, health scientistsand politicians believe that social differences in mortality had started to converge. Theconclusion at the time was that inequality, when measured as death rates, was on steadydecline, possibly even on the brink <strong>of</strong> disappearing, the reason being access to prevention andmedication at low costs. Yet another view was that class differences in mortality had alwaysexisted but had stayed more or less constant (Cassel, 1976; Link and Phelan, 1995; 1996 andMarmot, 2004). The underlying hypothesis is that those who have greater access to economicresources will always be less afflicted, regardless <strong>of</strong> disease (Link and Phelan, 1996, p. 472).The question is then whether health differentials have converged, diverged, or stayed moreor less constant. Due to lack <strong>of</strong> coherent data covering long time periods, our knowledge hasbeen based on highly incomplete evidence, from a variety <strong>of</strong> locations, and at various pointsin time. The evidence used is not only fragmentary, but furthermore only partly comparable,as different definitions <strong>of</strong> social class and mortality have been used. Link and colleaguesrightly argued that “a test <strong>of</strong> the fundamental cause idea would ideally make use <strong>of</strong> a largebank <strong>of</strong> historical data about individuals and their disease experience that would also permitthe identification <strong>of</strong> changes in risk factors” (Link et al., 1998, p. 378). And in the pastdecade, historians in a variety <strong>of</strong> countries have indeed taken up anew the study <strong>of</strong> socialclass-mortality differences by going back to the original sources to create such banks <strong>of</strong> data.These data sets allow us to test the hypotheses put forwards by Marmot and Link and Phelan.A recent publication summarizes the results from seven new studies <strong>of</strong> locations in Westernand Southern Europe, the US and Canada, for which individual-level longitudinal data existsfor long time periods (Bengtsson and Van <strong>Poppel</strong>, 2011). Most <strong>of</strong> these studies also coverlarge parts <strong>of</strong> the twentieth century, for which such micro data hitherto has largely beenlacking. Taken together, they have a wide geographic coverage and a very long time horizon.Geneva, with a labour force <strong>of</strong> more than 20,000 in the watch-making industry alone in1800, saw huge but declining social differences in mortality during its 19 th industrialization(Schumacher and Oris, 2010). The workers in the sawmill town <strong>of</strong> Sundsvall in northernSweden faced higher mortality than farmers but had the same levels as the upper classes inthe town itself (Edvinsson and Lindkvist, 2010). As industrialization took place in the lastdecades <strong>of</strong> the 19 th century, no divergence in mortality took place. In Saguenay, Quebec,with a growing aluminium and pulp industry, mortality was about the same for all groupsexcept farmers, who had significantly lower mortality up until recent time (Gagnon et al.,
2010). In a rural area in Scania in southern Sweden, with some emerging industry after 1860,workers and the well-<strong>of</strong>f farmers suffered from the same mortality in working ages up until1950, when they diverged (Bengtsson and Dribe, 2010). In Alghero, a port town in Sardinia,the social differences among children were substantial but did not increase as it becameindustrialized (Breschi et al., 2010). Instead, social differences in mortality either stayedconstant or declined. The situation in the Netherlands, for which data covers a large part <strong>of</strong>the country, both urban and rural, was similar. The social differences found for earlier cohortsstays the same or diminish slightly over time (Schenk and Van <strong>Poppel</strong>, 2010). While theabsolute differences in infant and child mortality between social groups in the US diminishover time, the relative differences persist and possibly expand a bit (Haines, 2010).Taken together, in no case is it possible to find evidence for worsening conditions leadingto higher mortality and/or larger social differences in mortality during the industrializationphase. In one case, rural Scania, we find increasing social differences in adult mortality after1950. We do indeed find a social gradient in mortality in urban areas, notably Geneva andAlghero, but these differences date further back in time, and in Sundsvall there were nodifferences at all. Instead, we discover that mortality was higher in urban than in rural areas, acommon finding referred to as the urban mortality penalty. The findings that social differencesin mortality were small in pre-industrial agricultural societies that are included in the studies<strong>of</strong> this special issue, except for cities, are consistent with findings for historical England bothat macro level (Wrigley and Sch<strong>of</strong>ield, 1981; Hollingsworth, 1957 and Livi-Bacci, 1991) andat micro level (Clark, 2007).Consequently, we find no support for the hypothesis that certain fundamental and generalmechanisms always provided the well-<strong>of</strong>f with longer lives and either made social differencesin mortality stay constant, as anticipated by Link and Phelan (Link et al.,1998; Link andPhelan, 1995; 1996; 2002 Phelan et al., 2004) or persistent, in the sense that well-<strong>of</strong>f groupsalways have lower mortality than less wealthy groups, from one century to the next, as arguedby Marmot (2004). Instead, we found convergence in absolute mortality differences in theUnited States during the 20 th , for the Netherlands and for Alghero after circa 1900 and forGeneva from the 17 th century onwards, and in most cases also a convergence in relativedifferences as well. In Sweden, both in the northern town <strong>of</strong> Sundsvall and in the rural area insouthern Sweden, and also in Saguenay, Canada, we found no social differences in workingage mortality during the industrialization period at all.The reason for the lack <strong>of</strong> social differences in the past is most likely that mortality incommunicable and <strong>of</strong>ten virulent diseases was high during this period. Almost all groupswere exposed, and medical treatment was inefficient. The difference between urban and ruralareas was therefore probably the result <strong>of</strong> differences in exposure, not resistance. Today,the disease pattern is entirely different, even though pandemics strike now and then. Lifestyle factors, such as smoking, diet, and exercise, have become increasingly important.Diseases are treatable and preventions are known. Overall, a consistent causal link betweensocio-economic status/income and mortality is open to serious doubt.87
Neither alone nor neglected:The elderly in a 19 th century Italian cityRenzo DerosasIn an ageing society, the conditions <strong>of</strong> the elderly present and future represent a growingconcern <strong>of</strong> social scientists and policy makers. As for the elderly in the past, they are left to thehands <strong>of</strong> historians, who, for that matter, do not seem to care that much. There are obviouslynotable exceptions, but overall this remains a marginal field <strong>of</strong> enquiry. Regrettably so, sincethe elderly represent a telling <strong>van</strong>tage point from which to observe the society as a whole andits inner mechanisms.As a member <strong>of</strong> both social groups involved here –the historians and the elderly– I wouldlike to <strong>of</strong>fer my tiny contribution, presenting the preliminary results <strong>of</strong> a study on 19 th -centuryVenice. The questions addressed are to what extent the elderly were surrounded by kinrelations –both in the household and outside– who might support them if needed, and whethersuch relations were effectively employed to that purpose. The first question is frequentlydealt with in studies <strong>of</strong> household composition, although kin networks outside the householdare <strong>of</strong>ten neglected. An analysis <strong>of</strong> the demographic outcomes related to the availability <strong>of</strong>kin is even less usual. Anyway, the answer is “yes” to both question: as the title goes, theVenetian elderly were neither alone nor neglected.This study relies on a longitudinal sample <strong>of</strong> the Venetian population, drawn from the citypopulation register and concerning the life-spells <strong>of</strong> 31,000 individuals in the period 1850to 1869. It includes the inhabitants <strong>of</strong> four parishes: Two were extremely poor, inhabitedby fishermen, boatmen, porters, and other unskilled labourers; one was made up by wageworkers, employed in glass factories, at the railway station, or in the communal slaughterhouse;the fourth was in the city centre, and was inhabited by families <strong>of</strong> the middle class and byemployees, artisans and shopkeepers. The dataset also includes the whole Jewish community.One third <strong>of</strong> the Venetian Jews still lived in the Ghetto, while the rest was scattered aroundthe city. Also among the Jews all levels <strong>of</strong> socio-economic status were present. Overall, thesample represents 15 per cent <strong>of</strong> the Venetian population. It includes 6,279 persons aged 60to 79, who constitute the object <strong>of</strong> this study.Living arrangements (figures 1-4).The elderly living without close kin were relatively few, around 20 per cent <strong>of</strong> the total. Mostlived with their spouses (63% <strong>of</strong> males and 42% <strong>of</strong> females), sons (46 and 39% respectively),daughters (42 and 35%), brothers (6 and 4%), sisters (5 and 7%). Furthermore, 42 per cent <strong>of</strong>the males and 36 per cent <strong>of</strong> the females had close kin living in the same parish: sons (11 and13%); daughters (13 and 15%); brothers (11 and 10%); sisters (11 and 14%). Other kin werealso present: the average number present in the parish range was 5.8. Living arrangementsvaried with marital status, gender, and age. The patterns <strong>of</strong> cohabitation <strong>of</strong> widows andwidowers were however remarkably similar: The probability <strong>of</strong> living with a son decreasedwith age, whereas the probability <strong>of</strong> living with a daughter increased. At 60, the percentage89
Figure 1. Percentage <strong>of</strong> elderly cohabiting with kin by gender7060504030MalesFemales20100no kin spouse son daughter brother sisterFigure 2. Percentage <strong>of</strong> elderly with neighbouring kin by gender7060504030MalesFemales20100no kin son daughter brother sister90
Figure 3. Percentage widowers coresiding with children by age403020noneonly sonsonly daughtersboth1060 65 70 75 80Figure 4. Percentage widows coresiding with children by age403020noneonly sonsonly daughtersboth1060 65 70 75 8091
Covariate PropTable 1. Cox regression models <strong>of</strong> old-age mortality (60-79). Venice, 1850-1869Whole sample Ever marriedAll Males Females All Males FemalesEXPEXPEXPEXPEXPEXP(Coeff) p-value Prop (Coeff) p-value Prop (Coeff) p-value Prop (Coeff) p-value Prop (Coeff) p-value Prop (Coeff) p-valueGendermale (ref.) 0,43 1 0,44 1female 0,57 0,72 0,000 0,56 0,72 0,000Marital status n.i. n.i. n.i.never married (ref.) 0,15 1 0,14 1 0,15 1married 0,43 0,91 0,321 0,60 0,97 0,803 0,30 0,84 0,192widowed 0,43 0,96 0,670 0,26 1,06 0,651 0,55 0,87 0,226Socio-economic statusunskilled, day laborer(ref.)0,21 1 0,27 1 0,17 1 0,20 1 0,29 1 0,14 1factory worker 0,15 0,94 0,567 0,24 0,79 0,056 0,09 1,34 0,100 0,16 0,95 0,617 0,25 0,81 0,103 0,09 1,295 0,209shopkeeper, artisan 0,16 1,04 0,659 0,32 0,93 0,535 0,04 1,48 0,106 0,16 0,98 0,867 0,32 0,90 0,401 0,04 1,186 0,548middle class, elite 0,11 0,92 0,417 0,14 0,84 0,219 0,09 1,11 0,585 0,10 0,79 0,060 0,12 0,71 0,032 0,09 0,976 0,909unknown 0,36 1,30 0,004 0,03 0,93 0,769 0,61 1,61 0,000 0,38 1,23 0,043 0,02 0,98 0,920 0,65 1,461 0,009ReligionCatholic (ref.) 0,84 1 0,82 1 0,86 1 0,84 1 0,82 1 0,85 1Jewish 0,16 0,84 0,040 0,18 0,76 0,026 0,14 0,92 0,465 0,16 0,81 0,029 0,18 0,67 0,006 0,15 0,959 0,744Current seasonWinter (ref.) 0,26 1 0,26 1 0,25 1 0,26 1 0,26 1 0,26 1Spring 0,23 1,09 0,307 0,23 1,17 0,200 0,23 1,03 0,778 0,23 1,15 0,106 0,23 1,25 0,086 0,23 1,084 0,510Summer 0,23 0,74 0,001 0,23 0,78 0,070 0,23 0,71 0,004 0,23 0,76 0,005 0,23 0,82 0,168 0,23 0,717 0,010Fall 0,29 0,82 0,018 0,29 0,86 0,237 0,29 0,80 0,051 0,29 0,85 0,074 0,29 0,86 0,266 0,29 0,850 0,193Food pricelow (ref.) 0,73 1 0,74 1 0,73 1 0,73 1 0,73 1 0,73 1high 0,27 1,07 0,327 0,26 1,06 0,519 0,27 1,07 0,464 0,27 1,08 0,260 0,27 1,10 0,341 0,27 1,066 0,500Ongoing cholera epidemicno (ref.) 0,92 1 0,92 1 0,92 1 0,92 1 0,93 1 0,92 1yes 0,08 1,83 0,000 0,08 1,90 0,000 0,08 1,81 0,001 0,08 1,97 0,000 0,07 1,86 0,002 0,08 2,118 0,00092
Spouse n.i. n.i. n.i.absent 0,50 1 0,30 1 0,65 1present 0,50 0,96 0,532 0,70 0,94 0,528 0,35 0,962 0,695Sons n.i. n.i. n.i.none (ref.) 0,47 1 0,44 1 0,50 1coresident 0,44 0,92 0,201 0,49 0,90 0,302 0,41 0,928 0,436non-coresident only 0,09 0,88 0,322 0,07 0,73 0,133 0,09 0,997 0,983Daughters n.i. n.i. n.i.none (ref.) 0,50 1 0,47 1 0,52 1coresident 0,40 0,90 0,159 0,43 0,84 0,102 0,37 0,953 0,629non-coresident only 0,11 0,75 0,023 0,10 0,72 0,083 0,11 0,767 0,114Brothersnone (ref.) 0,87 1 0,87 1 0,88 1 0,88 1 0,88 1coresident 0,03 0,60 0,017 0,04 0,61 0,067 0,88 1 0,02 0,52 0,034 0,03 0,59 0,142 0,02 0,386 0,101non-coresident only 0,09 1,01 0,946 0,09 1,18 0,371 0,03 0,58 0,113 0,10 0,89 0,421 0,09 1,16 0,470 0,10 0,704 0,094Sisters 0,10 0,85 0,399none (ref.) 0,85 1 0,86 1 0,84 1 0,86 1 0,87 1 0,84 1coresident 0,04 1,04 0,823 0,03 1,41 0,120 0,04 0,78 0,282 0,02 1,00 0,986 0,02 1,67 0,085 0,03 0,610 0,168non-coresident only 0,11 0,74 0,011 0,11 0,66 0,026 0,12 0,81 0,155 0,12 0,75 0,019 0,11 0,63 0,024 0,13 0,825 0,219No. <strong>of</strong> adult male kin 0,46 1,00 0,968 0,51 1,07 0,348 0,43 0,93 0,331 0,51 0,03 0,055 0,55 1,10 0,234 0,49 0,969 0,685No. <strong>of</strong> adult female kin 0,46 1,01 0,848 0,51 0,93 0,381 0,42 1,08 0,289 0,51 0,00 0,056 0,56 0,94 0,441 0,48 1,061 0,439Infants below 2absent 0,81 1 0,80 1 0,81 1 0,78 1 0,78 1 0,79 1present 0,19 1,12 0,144 0,20 1,12 0,297 0,19 1,10 0,381 0,22 1,20 0,029 0,22 1,25 0,073 0,21 1,168 0,182Mobility (previous year)none (ref.) 0,85 1 0,85 1 0,86 1 0,85 1 0,84 1 0,85 1intra-parish 0,02 1,66 0,007 0,02 1,70 0,044 0,01 1,57 0,095 0,02 1,73 0,005 0,02 1,77 0,032 0,02 1,667 0,071inter-parish 0,08 1,09 0,430 0,08 0,97 0,864 0,08 1,19 0,210 0,08 1,13 0,269 0,09 0,97 0,864 0,08 1,290 0,085don't know 0,05 0,59 0,001 0,05 0,54 0,013 0,05 0,65 0,041 0,05 0,64 0,010 0,05 0,57 0,037 0,05 0,700 0,113Events 1246 574 672 1055 488 56793
<strong>of</strong> those who lived with only a son was around 22, at 79 around 17; the corresponding figuresfor daughters where 29 and 33 respectively. Those living with both sons and daughters variedfrom 22 to 15 per cent. Elderly widowed without any children were at most 37 per cent <strong>of</strong>the total.Elderly careCare is approximated by differential survival. Cox proportional hazards models are used totest the impact on mortality <strong>of</strong> a set <strong>of</strong> confounding and exposure covariates. The confoundingcovariates are: Gender, marital status, socio-economic status, religion, current season, foodprice level, and cholera epidemic. The exposure covariates concern the presence <strong>of</strong> the spouse,sons, daughters, brothers, sisters, and <strong>of</strong> infants. For siblings and children, a distinction ismade between cohabitation and proximity. The models also include the number <strong>of</strong> other maleand female adult kinsfolk living in the same parish as the index person. Finally, a covariatedescribes whether the household to which the index person belonged had changed address inthe previous year. All covariates but the last one are expected to have had a positive effect onelderly survival as sources <strong>of</strong> potential support. Elderly could also benefit indirectly from thepresence <strong>of</strong> infants, enhancing their value as caregivers. A change <strong>of</strong> residence was expectedto turn out detrimental, causing the disruption <strong>of</strong> one’s social network.The main results can be summarized as follows (table 1). As far as the confounding covariatesare concerned, marital status, socio-economic status, and food price level did not significantlyaffect mortality. Gender, religious affiliation, cholera epidemics, and current season did.Interestingly, the risk <strong>of</strong> death <strong>of</strong> the Jews was 26 per cent less than that <strong>of</strong> the Catholics.Similarly to infants and differently from the other age groups, wintertime was quite harmfulfor elderly survival.When it comes to the exposure covariates, the presence <strong>of</strong> siblings was important for thesurvival <strong>of</strong> the elderly, reducing significantly the risk <strong>of</strong> death. There is however an interestingdifference. Brothers were helpful only when cohabiting with the index person, sisters onlywhen neighboring. Also, siblings were more beneficial to males than to females, suggestinga gendered pattern <strong>of</strong> support. This is confirmed by the effect <strong>of</strong> children’s presence: onlyneighboring daughters significantly reduced the risk <strong>of</strong> death <strong>of</strong> their parents, particularly<strong>of</strong> their mothers (-29%). Surprisingly enough, the spouse’s presence did not affect survival.The condition <strong>of</strong> the elderly was jeopardized by the presence <strong>of</strong> infants, which raised theirrisk <strong>of</strong> death by 25 per cent. Possibly, they were regarded more as competitors than ascaregivers. Yet, I have shown elsewhere that grandmothers were significantly beneficial toinfants’ survival. Less close kinsfolk did not matter at all. On the contrary, a recent change<strong>of</strong> residence was apparently highly detrimental, raising the risk <strong>of</strong> death by 65 per cent. Theincrease is so huge, however, that one suspects the artefact <strong>of</strong> registration practices, wherebyupdates on moves were more likely to happen when an event such as a death was denounced.94
Childbearing and longevity – the contribution <strong>of</strong> historical demographyMartin DribeIn the biological and bio-demographical literature there has been a great interest in the possiblelong term effects <strong>of</strong> childbearing on health and mortality. A number <strong>of</strong> studies, many <strong>of</strong> thempublished in the best scientific journals, have argued for an evolutionary trade-<strong>of</strong>f betweenreproduction and longevity. According to the theory <strong>of</strong> antagonistic pleiotropy (Williams,1957) some genes have contradictory effects at different stages <strong>of</strong> the life course. Geneswith an enhancing effect on the reproductive capacity may at the same time have detrimentaleffects on survival later in life (post reproduction). Natural selection tends to favor thesekinds <strong>of</strong> genes because they maximize fitness, as higher mortality in the post-reproductionstage will have little impact on fitness compared to increased number <strong>of</strong> <strong>of</strong>fspring. From thistheory it follows that higher rates <strong>of</strong> reproduction comes at a cost <strong>of</strong> higher post-reproductivemortality and shorter life span.As an alternative, the disposable soma theory (Kirkwood, 1977) argues for a metabolictrade-<strong>of</strong>f between reproduction and longevity. Reproduction demands resources which couldotherwise be used for physical maintenance and investments. Having more children to bearand rear (e.g. lactation) thus uses some <strong>of</strong> the resources that could have promoted a longerlife, leading to the hypothesis that higher reproduction is associated with shorter life span.These theories have provoked a large number <strong>of</strong> empirical studies on both historical andcontemporary populations. Often data from historical populations have been used because <strong>of</strong>less confounding from deliberate fertility control which could affect the trade-<strong>of</strong>fs studied.A number <strong>of</strong> studies finding an effect <strong>of</strong> number <strong>of</strong> children or the timing <strong>of</strong> first and lastbirth, have also interpreted their findings as supporting the evolutionary models. For exampleWestendorp and Kirkwood (1998), in a study <strong>of</strong> the English peerage spanning a period <strong>of</strong>more than 1,000 years, found that more children and lower ages at first birth were associatedwith shorter life span. In a careful analysis using similar data, however, Doblhammer andOeppen (2003) only found an effect for women. Smith et al. (2002) found similar results forUtah, which they interpreted as consistent with the evolutionary models, and this was againrepeated in a comparative analysis <strong>of</strong> historic Utah and Quebec (Gagnon et al., 2009).At the same time many other studies have failed to find any consistent relationship betweenchildbearing history and later life mortality. In an extensive review <strong>of</strong> empirical studies,Hurt et al. (2006) concluded that there was “no consistent pattern in the association betweenmortality and number <strong>of</strong> births among women who have completed their childbearing”.The interest in these issues was not that great among historical demographers to begin with.One reason for this may have been the strictly biological explanations invoked, leaving littleroom for individual agency or social context. We know that repeated childbearing put womenunder stress in the form <strong>of</strong> poor nutrition, physical and emotional stress, and greater exposureto disease, which in the long term may have detrimental effects on their health. For example,95
eastfeeding affects the nutritional status <strong>of</strong> women as reflected in the quality <strong>of</strong> their teeth(see Christensen et al., 1998). Therefore it seems only logical that the contribution <strong>of</strong> historicaldemographers to this field <strong>of</strong> research has been to bring social science back into the game.Different papers have stressed the important role played by the socio-economic context forthe association between childbearing history and longevity (e.g. Beise and Voland, 2002 andKorpelainen, 2000). A study <strong>of</strong> southern Sweden in the 19 th century looked at the relationshipbetween various reproductive indicators (number <strong>of</strong> children ever born, age at first birth andage at last birth) and mortality after age 50 for men and women separately (Dribe, 2004).The effects were also analyzed separately by socio-economic status, and the results clearlyshowed that number <strong>of</strong> children ever born had a negative impact on longevity. Having fouror five children shortened women’s life span after 50 by about 3.5 years compared to womenwith one child or less. However, this effect could only be found among the poorest women.No effect <strong>of</strong> number <strong>of</strong> children for more well-to do women, or for men, could be found.In a comparative analysis <strong>of</strong> three populations in Belgium, the Netherlands and Sweden inthe 19 th century, Alter et al. (2007) demonstrated the important mediating role played bywidowhood. For women widowed at young ages (before 40) having more children meantsignificantly higher mortality after age 50, while there was no overall association betweennumber <strong>of</strong> children and mortality. This seems to imply that it was not so much the number <strong>of</strong>children born that was important, but the circumstances under which they were raised.In an article using data for a preindustrial Sami population in Finland, Helle et al. (2002)showed that number <strong>of</strong> sons, rather than the total number <strong>of</strong> children, affected women’slongevity, and mainly linked it to biological mechanisms (testosterone levels related topregnancies). Van de Putte et al. (2004) replicated the analysis on a 19 th century Flemishvillage and confirmed the association between number <strong>of</strong> sons born and female age at death,but could also demonstrate that the effect was only present among working class women, andmainly for women whose sons survived to at least to age five. This led to the conclusion thatresource competition, rather than pregnancy related mechanisms, was the main explanation.As shown by these examples, the contribution by historical demography to this importantresearch area has been significant by bringing the social and economic context into theanalysis. Rather than viewing the adverse effects <strong>of</strong> childbearing on longevity as a result <strong>of</strong>evolutionary or metabolic trade-<strong>of</strong>fs, the empirical evidence points strongly to the contextin which women lived as the main explanation. Physical depletion following a combination<strong>of</strong> repeated pregnancies and deliveries, poor nutrition and hard physical labor had long-termadverse effects on the health and longevity <strong>of</strong> women. These negative effects were not presentamong the better nourished women in intact families, and their life spans also seem to havebeen largely unaffected by their reproductive history.96
98Excess mortality during the Dutch famine <strong>of</strong> 1940-45.When, where, and why? Some unresolved questionsBertie LumeyIn a previous study <strong>of</strong> mortality during the Dutch famine, <strong>Frans</strong> <strong>van</strong> <strong>Poppel</strong> concluded that theimmediate effects <strong>of</strong> the famine were so large that they affected the survival <strong>of</strong> the exposedpopulations (Lumey and Van <strong>Poppel</strong>, 1994).As reviewed elsewhere, further studies at the individual level have since been carried outin the Netherlands to estimate possible long-term health effects <strong>of</strong> famine exposure in earlylife (Lumey et al., 2011). Most <strong>of</strong> these studies have looked at the relation between earlylife exposures during the pre-natal period and later morbidity. They have been too smallto reliably evaluate changes in mortality, except for a recent study <strong>of</strong> men born during thefamine (Lumey et al., submitted). A summary <strong>of</strong> mortality changes in relation to early lifeconditions after birth is also available but based on older literature (Elo and Preston, 1992).Outside <strong>of</strong> the Netherlands, the pioneering national cohort study <strong>of</strong> the Great Finnish Famine<strong>of</strong> 1866-1868 (Kannisto et al., 1997) and a regional study <strong>of</strong> the Chinese Famine <strong>of</strong> 1959-1961did not find differences in mortality or survival at older age for cohorts born during famine.Fertility or early mortality selection during the Chinese famine may have changed thecharacteristics <strong>of</strong> the survivors however, masking possible negative long-term effects (Song,2009). This may also have happened in Finland, as suggested by a recent analysis using frailtymodels to account for unobserved cohort heterogeneity (Doblhammer et al., forthcoming).Famine exposure in these studies is based on historical information regarding the timingand geographical distribution <strong>of</strong> the famine, and exposed and unexposed study subjects aredefined by their date and place <strong>of</strong> birth. Sometimes, only year <strong>of</strong> birth is available for study,and accurate information on place <strong>of</strong> birth may also be missing. Timing <strong>of</strong> famine exposurein relation to critical developmental periods is sometimes feasible but the accuracy <strong>of</strong> timingwill depend on available information on date <strong>of</strong> birth and the start and the end <strong>of</strong> the famine.In studies <strong>of</strong> the Dutch famine, such information has been collected and exposures have beenclassified according to distributed food rations in relation to stage <strong>of</strong> pregnancy (Stein et al.,1975 and Lumey et al., 2007). It is worth noting that birth size and body proportions vary onlywith exposure to famine in late pregnancy (Stein et al., 2004). Birth size can therefore neverbe used to reliably estimate maternal nutrition in studies <strong>of</strong> birth weight and adult disease.Famine exposure in nearly all studies is evaluated at the group level, as information onindividuals is not available. In all, the exposure measures used in these studies are rathersimple and given their limitations it is perhaps surprising that they have generated such usefulresults.With regard to critical exposure periods, there has traditionally been a great interest in theperiod around the growth spurt in puberty (Tanner, 1981), but current studies tend to focus on
very early life experiences, even before birth. It is sometimes possible to contrast outcomes<strong>of</strong> the same exposure in very early pregnancy versus late in pregnancy and better understandbiological pathways related to the timing <strong>of</strong> an insult (Heijmans et al., 2008).Questions about long-term effects are important in view <strong>of</strong> the continuing and as yetunresolved debate on the contribution <strong>of</strong> early life factors to adult health and its policyimplications (Ben-Shlomo and Kuh, 2002). Although progress is being made and more datasources are being developed (Lumey and Vaiserman, forthcoming), there are not many welldesigned current studies to reliably estimate long-term effects <strong>of</strong> famine on mortality andlife expectancy in well-defined populations. Fortunately, this is likely to be possible howeverin some studies covering the WWII period from the Netherlands on which <strong>Frans</strong> is makingimportant contributions.Estimates from the NIOD institute in Amsterdam indicate that 250,000 Dutch men andwomen may have lost their lives because <strong>of</strong> WWII (NIOD, 2012). This number includeswar-related casualties in the Netherlands, in the former Dutch East Indies and elsewhere. Itincludes the Jewish citizens who were deported and did not survive German extermination orlabor camps, those who died <strong>of</strong> poor health conditions, civilian casualties <strong>of</strong> war, and deathsduring the Dutch famine <strong>of</strong> 1944-1945, and civilian casualties during the liberation <strong>of</strong> theNetherlands (Klep and Schoenmaker, 1995).With regard to the famine related deaths, the current estimates <strong>of</strong> 15,000-25,000 (De Jong,1981; Trienekens, 1985; Klemann, 2002 and NIOD, 2012) are based on limited information.The reporting <strong>of</strong> vital statistics on births and deaths during the famine was incomplete on anational level and also in the largest affected cities in the Western Netherlands, except forAmsterdam. In addition, a systematic evaluation <strong>of</strong> the quality <strong>of</strong> available reports has neverbeen carried out. The reporting <strong>of</strong> vital statistics was so spotty that it is worth documentingwhat data have actually been published for specific time periods and jurisdictions. For futurereference, I have therefore summarized the available information from the Central Bureau<strong>of</strong> Statistics and from the municipalities <strong>of</strong> Amsterdam, Rotterdam, The Hague and Utrechtregarding the war period <strong>of</strong> interest (table 1). This information should be helpful for futurestudies, although the reported numbers will need careful interpretation.Past war- or famine-related mortality estimates have been based on ad-hoc comparisons<strong>of</strong> excess deaths in exposed municipalities or regions in relation to non-famine years ornon-famine regions (Dols and Van Arcken, 1946; Neurdenburg, 1947 and Burger Drummondand Sandstead, 1948). Using wider time windows, yearly time trends in mortality by genderand cause <strong>of</strong> death from national vital statistics (CBS, 1957) have also been compared, althoughthe findings and the appropriate analysis <strong>of</strong> such data are open to discussion (Futselaar, 2008and Lumey, 2010). A severe limitation <strong>of</strong> published national statistics is that only yearlyfigures at the national level are provided, ignoring that the famine was concentrated in theWestern cities <strong>of</strong> the Netherlands.With the recent availability <strong>of</strong> digitized data files from the statistical <strong>of</strong>fice for the Netherlands,covering overall mortality and causes <strong>of</strong> death by date <strong>of</strong> death in considerable detail, by99
Table 1. Available vital statistics at the national and local level in the Netherlands covering the period <strong>of</strong>the Dutch famine <strong>of</strong> 1944-1945Publication Reported categories Selected data <strong>of</strong> interest Time period <strong>of</strong>interest coveredReference CommentsMaandschriftCentraal Bureauvoor de Statistiek(CBS)Huwelijken, geboorte ensterfte naar den leeftijd ennaar de oorzaken <strong>van</strong> dendood, onder de werkelijkebevolking <strong>van</strong> NederlandLevendgeboren, sterfte, en sterfte
Overzicht <strong>van</strong> de sterfte binnen de gemeente Rotterdam, m/vOverledenen binnen de gemeente in 1944 en 1945 (Fig.)1944 and 1945,by weekOverzicht <strong>van</strong> de geboorten binnen de gemeente Rotterdam in1944, 1945, en een gedeelte <strong>van</strong> 1946.Jan 1944- Jun1946, by weekGeboorten binnen de gemeente Rotterdam in 1944, 1945, en 1946 1944-1946, byweekGeboorte m/v, sterfte m/v, vestiging m/v en vertrek m/v. Bevolkingm/v op de eerste <strong>van</strong> elke maand,Sterfte naar den leeftijdJan-Dec 1946and Jan-Dec1945,by monthOverzicht <strong>van</strong> de geboorten binnen de gemeente Rotterdam in1944, 1945, 1946 en een gedeelte <strong>van</strong> 1947Jan 1944-Jun19471946,1ste kwartaalmet tweebijlagen1946, 1ste,2e, 3e en 4ekwartaalmet driebijlagen‘On judging these data it should be taken intoconsideration, that a great number <strong>of</strong> malepersons were carried <strong>of</strong>f abroad; moreovernumerous persons temporarily left the city inview <strong>of</strong> the food-shortage, resulting in a certainincorrectness <strong>of</strong> the observations. Would thishave not been the case, the general death-ratewould have been still more considerable this yearand the striking difference between the number<strong>of</strong> men and women deceased still greater’ (withFig.) (Bijl. 1)‘The figures show the demographic consequences<strong>of</strong> the deportation <strong>of</strong> a great number <strong>of</strong>persons to Germany mid-November 1944, thegradual deterioration <strong>of</strong> food-conditions sinceSeptember 1944, as well as the return <strong>of</strong> thesemen and the improved food-situation after theliberation’As above(Bijl.2)Mid 1946 update <strong>of</strong> figures not published sincemid-1944During the last years <strong>of</strong> the enemy-occupationand the period after the liberation, birth-ratesshow striking fluctuations in contra-distinctionto the pre-war years. At present the level whichthe rates have reached and still maintain, is reallysurprising. In order to prove this assertion asto the movement <strong>of</strong> the births in recent years,a review is given <strong>of</strong> the weekly birth-rates forthe years 1944 to 1946 inclusive and part <strong>of</strong> thecurrent year. The following factors played animportant part in bringing about the importantdeviations. On the one side the considerablefall <strong>of</strong> births was caused by the lower frequency<strong>of</strong> marriages during the enemy-occupation andby the deportation <strong>of</strong> a great number <strong>of</strong> malepersons to Germany mod-November 1944, thegradually deteriorated conditions <strong>of</strong> life especiallysince the autumn <strong>of</strong> 1944 (September) havingalso contributed to the decrease. On the otherhand the rise was brought about owing to theabnormal high number <strong>of</strong> marriages contracted,the return <strong>of</strong> the deported men and the improvedfood supply after the liberation (May 1945).(Bijl. 2, incl. Fig.)101
Mededeelingen<strong>van</strong> het bureauvoor statistieken voorlichtingder gemeente‘s-GravenhageGeboorten m/v, Bevolking m/v op de 1e <strong>van</strong> de maand, Sterftenaar de oorzaken <strong>van</strong> de dood (28 categorieen)Sterfte naar den leeftijdGeboorten m/v, sterfte m/n, Bevolking m/v op de 1e <strong>van</strong> demaandSterfte naar de oorzaken<strong>van</strong> de dood (28 categorieen)Overzicht <strong>van</strong> enige <strong>van</strong> de voornaamste gegevensOverzicht <strong>van</strong> de geboorten binnen de gemeente Rotterdam in1944, 1945, 1946, 1947 en een gedeelte <strong>van</strong> 1948Sterfte en geboorte Overledenen zonder oorlogsslacht<strong>of</strong>fersbinnen de gemeenteSterfte aan ondervoeding boven de 50 jaar m/v als % total sterfte;Sterfte door oorlogs-geweld per jaar (excl slacht<strong>of</strong>fers in hetbuitenland (w.o. de Joden het grootste aantal leveren)Bevolking m/v per jaarLoop <strong>van</strong> de bevolking, totaal levend geborenen, levenloos aangegeven,en Overleden behorende tot de werkelijke bevolkingGeboortecijfers voor Den Haag, levend en levenloos geborenen,Geboorte en sterfte/1000 inwoners, overledenen, w.v. jonger dan1 jaar, (Fig.)Verloop <strong>van</strong> het aantal geborenen en overledenen, huwelijken enechtscheidingen (Fig.)Jan-Mar 1947and Jan-Mar1946Jan 1946 to Dec1947,by month1946-1947, byquarter1938, 1946 en1947Jan 1944-Apr1948,by weekJan-Sep 1944and Jan-Sep1945,by monthJan-Jun 19451940-451939-44Jan 1945-April1946,By monthJan-Dec 19461936-46,by year1944-46,by month1947,1ste kwartaalmet tweebijlagen1947, 1ste-4de kwartaalmet tweebijlagenYearly population, death, and birth counts(Bijl. 1)See comment above on weekly births Jan 1944-Jun 1947 (Bijl. 2)1946 no.1 Selected data over war periodpublished in 1946, as a summary <strong>of</strong> some experiences<strong>of</strong> the city <strong>of</strong> the Hague under Germanoccupation (‘’s-Gravenhage tijdens de Duitschebezetting. De bevolking <strong>van</strong> ‘s-Gravenhagetijdens de oorlogsjaren”. (pp. 5-12ff.)This summary includes sections on m/f residentsin 1939-44, the deportation <strong>of</strong> the Jewishpopulation in 1942-43; food distribution andrations, hunger edema and deaths from famine1946 no.4 With descriptive summary <strong>of</strong> post-liberationconditions (‘de Haagsche bevolking een jaar nade bevrijding’)1947 no.3 With summary <strong>of</strong> ‘Enige gegevens over deresidentie na de bevrijding’)With continuation <strong>of</strong> the previous summary<strong>of</strong> experiences under German occupation, andbirths and deaths 1939-46 (‘Vergelijkendjaaroverzicht over de jaren 1939 t/m 1946 (pp.26-31)’(continuation <strong>of</strong> Summary in 1946 no.1)102
Statistische Berichtender GemeenteUtrecht;StatistischeMitteilungen derStadt UtrechtStatistischeBerichten derGemeenteUtrecht; Bulletinstatistique de laville d’UtrechtSterfte en geboorte,loop <strong>van</strong> de bevolkingLevend geboren m/v, overleden m/v, vestiging, vertrek, stand derbevolking (m/v), SterfteSterfte naar geslacht (m/v), leeftijd (
gender, and in selected age groups and across all municipalities, the time has finally cometo address some important but unresolved questions about the Dutch famine. It will nowbe possible for instance to evaluate with national mortality data when the birth and deathcounts started to change in well-defined areas, how this relates to changes in energy andmacro-nutrient availability, which effects were immediate and which were delayed, whysome areas were more affected than others in spite <strong>of</strong> comparable food supplies, and if someaffected cities showed greater excess mortality than others.It will also be possible to examine differential effects <strong>of</strong> famine on specific causes <strong>of</strong> deathand on the timing <strong>of</strong> these deaths. With current epidemiologic, demographic, and econometrictechniques it will be possible to address these questions in a comprehensive fashion and t<strong>of</strong>urther quantify excess mortality in relation to the timing, location, and nature <strong>of</strong> specificinsults. These analyses will not only contribute to our knowledge <strong>of</strong> the Dutch famine itself,but may also help us better identify critical exposure periods over the life course for later usein other studies in other parts <strong>of</strong> the world. Much <strong>of</strong> this work is currently being undertakenby <strong>Frans</strong>, together with his colleagues Peter Ekamper and Govert Bijwaard at <strong>NIDI</strong> and withcollaborators Aryeh Stein and myself in the United States.We should all hope that after his <strong>of</strong>ficial retirement <strong>Frans</strong> will not abandon this work. I evenhope that he will then be able to find more time to help solving some <strong>of</strong> these fundamentalquestions.ReferencesBen-Shlomo, Y. and D. Kuh (2002), A life course approach to chronic disease epidemiology: Conceptualmodels, empirical challenges and interdisciplinary perspectives. International Journal <strong>of</strong> Epidemiology,31, pp. 285-93.Burger, G.C.E., J.C. Drummond and H.R. Sandstead (1948), Malnutrition and starvation in WesternNetherlands, September 1944 to July 1945. Pts 1 & 2. 's-Gravenhage: Staatsuitgeverij.Centraal Bureau voor de Statistiek (1957), De sterfte in Nederland naar geslacht, leeftijd en doodsoorzaken1921-1955. Zeist: Uitgeversmaatschappij W. de Haan.Doblhammer, G., G.J. <strong>van</strong> den Berg and L.H. Lumey (2010), Long-term effects <strong>of</strong> famine on lifeexpectancy. Population Studies: In press.Dols, M.J.L. and D.J.A.M. <strong>van</strong> Arcken (1946), Food supply and nutrition in the Netherlands during andimmediately after World War II. Milbank Mem Fund Quart 24, pp. 319-358.Elo, I.T. and S.H. Preston (1992), Effects <strong>of</strong> early-life conditions on adult mortality: A review. PopulationIndex, 58, pp. 186-212.Futselaar, R. (2008), Lard, lice, and longevity. The standard <strong>of</strong> living in occupied Denmark and theNetherlands, 1940-1945. Amsterdam: Aksant.Heijmans BT, Tobi EW, Stein AD, Putter H, Blauw GJ, Susser ES, Slagboom PE, Lumey LH. (2008).Persistent epigenetic differences associated with prenatal exposure to famine in humans. Proc NatlAcad Sci U S A 105: 17046-9.Jong, L. de (1981), Het Koninkrijk der Nederlanden in de Tweede Wereldoorlog, deel 10b. Den Haag:Staatsuitgeverij.104
Kannisto, V., K. Christensen and J.W. Vaupel (1997), No increased mortality in later life for cohorts bornduring famine. American Journal <strong>of</strong> Epidemiology, 145, pp. 987-994.Klemann, H.A.M. (2002), Nederland 1938-1948; economie en samenleving in jaren <strong>van</strong> oorlog enbezetting. Amsterdam: Boom.Klep, C. and B. Schoenmaker (eds.) (1995), De bevrijding <strong>van</strong> Nederland 1944-1945; Oorlog op de flank.Den Haag: SDU.Lumey, L.H., F.W. <strong>van</strong> <strong>Poppel</strong> (1994), The Dutch famine <strong>of</strong> 1944-45: Mortality and morbidity in past andpresent generations. Social History <strong>of</strong> Medicine, 7, pp. 229-46.Lumey, L.H. (2010), Review <strong>of</strong> Ralf Futselaar. Lard, lice and longevity. Bijdragen en Mededelingen derGeschiedenis <strong>van</strong> de Nederlanden, 125, pp. 148-50.Lumey, L.H., A.D. Stein, H.S. Kahn, K.M. <strong>van</strong> der Pal-de Bruin, G.J. Blauw, P.A. Zybert et al. (2007),Cohort pr<strong>of</strong>ile: The Dutch Hunger Winter families study. International Journal <strong>of</strong> Epidemiology, 36,pp.1196-204.Lumey, L.H., A.D. Stein and E. Susser (2011), Prenatal famine and adult health. Annual Review <strong>of</strong> PublicHealth, 32, pp. 237-62.Lumey, L.H., P. Ekamper, A.D. Stein and F. <strong>van</strong> <strong>Poppel</strong>, Prenatal famine exposure and mortality in anational birth cohort with follow-up through age 63 years (Submitted for publication).Lumey, L.H. and A. Vaiserman, Early life nutrition, adult health and development. Lessons from changingdiets, famines and experimental studies. Happauge: Nova Publishers. https://www.novapublishers.com/catalog/product_info.php?products_id=37892 (In press).Neurdenburg, M.G. (1947), Algemene statistiek der mortaliteit en der morbiditeit. In Medische ervaringenin Nederland tijdens de bezetting 1940-1945, I. Boerema (ed.), pp. 321-408. Groningen: J.B.Wolters.NIOD (2012), Cijfers Duitse bezetting. http://www.niod.knaw.nl/nl/CijfermateriaalDuitsebezetting.htm.(Access date November 3, 2012).Song, S. (2009), Does famine have a long-term effect on cohort mortality? Evidence from the 1959-1961great leap forward famine in China. Journal <strong>of</strong> Biosocial Science, 41, pp. 469-491.Stein, Z., M. Susser, G. Sanger and F. Marolla (1975), Famine and human development. The Dutch HungerWinter <strong>of</strong> 1944-1945. New York: Oxford Univ Press.Stein, A.D., P.A. Zybert, M. <strong>van</strong> de Bor and L.H. Lumey (2004), Intrauterine famine exposure and bodyproportions at birth: The Dutch Hunger Winter. International Journal <strong>of</strong> Epidemiology, 33, pp. 831-6.Tanner, J.M. (1981), A history <strong>of</strong> the study <strong>of</strong> human growth. Cambridge: Cambridge University Press.Trienekens, G.M.T. (1985), Tussen ons volk en de honger; de voedselvoorziening, 1940-1945. Utrecht:Matrijs.105
Divergence <strong>of</strong> life expectancy and the epidemiological transition theoryJohan P. MackenbachIntroductionDuring the 20 th century, life expectancy in Europe has risen strongly, but with importantvariations in both time and space, as shown in figure 1. Apart from a steady rise and somemajor interruptions we see an increasing dispersion in recent decades. This recent divergenceis mainly due to stagnation and sometimes decline <strong>of</strong> life expectancy in Central and EasternEurope (McMichael et al., 2004; Leon, 2011; Moser et al., 2005; Zatonski, 2008 and Robineet al., 1995). Studies have shown that recent unfavorable mortality trends in Central andEastern Europe are largely due to unfavorable trends in mortality from cardiovasculardiseases, caused by various circumstances linked to the political and economic situation inthe communist and post-communist era (Rechel et al., 2009; Leon et al., 2009; McKee et al.,2009; Pomerleau et al., 2006 and Stuckler et al., 2009).It is unknown, however, how these recent trends compare to longer term developments inlife expectancy. As figure 1 suggests, this is not the first episode <strong>of</strong> widening <strong>of</strong> the lifeexpectancy gap in Europe. An earlier episode occurred during the 1920 s and 1930 s . Is thecurrent widening more or less severe than the earlier one? Is there a general explanation thatcan account for both episodes <strong>of</strong> widening?The epidemiological transition theoryThe theory that is most <strong>of</strong>ten used to explain long-term trends in mortality is that <strong>of</strong> the‘epidemiological transition’. During the epidemiological transition, which in different parts<strong>of</strong> Europe began between 1850 and 1920 (Riley, 2001), mortality declined precipitously andlife expectancy rose in a spectacular manner, <strong>of</strong>ten in parallel with economic growth. Whatwe generally see is rapid growth <strong>of</strong> life expectancy until about 1950-1970, followed by afew decades <strong>of</strong> stagnation, and then renewed growth <strong>of</strong> life expectancy starting in the period1970-1990 (figure 1).It has been argued that rapid declines in mortality are <strong>of</strong>ten accompanied by growingdisparities, e.g. between countries, regions within the same country, or socio-economicgroups, and that the recent divergence <strong>of</strong> mortality and life expectancy trends in Europeis simply to be expected as a corollary <strong>of</strong> the latest stage in the epidemiologic transition(Vallin et al., 2004 and Meslé et al., 2006). The main reason is that innovations which reducemortality are first implemented in some countries and then slowly diffuse to others (Rogers,1962). This is an appealing notion, but it carries the risk that diverging life expectancy is seenas a ‘normal’ phenomenon that will inevitably disappear when a natural process <strong>of</strong> diffusionis allowed to continue.In order to assess the validity <strong>of</strong> this idea it is necessary to more systematically quantifyvariation in life expectancy in Europe over the whole period 1900-2008, and to assess whetherthe two episodes <strong>of</strong> divergence in life expectancy coincided with rapid but differential declines<strong>of</strong> mortality from infectious diseases and cardiovascular diseases, respectively.106
Figure 1. Life expectancy trends in Europe, 1900-2008, by genderYears908070605040302010Life expectancy trends in Europe, menYearsLife expectancy trends in Europe, women908070605040302010018951902190919161923193019371944195119581965197219791986199320002007018951902190919161923193019371944195119581965197219791986199320002007Convergence and divergence <strong>of</strong> life expectancy and cause-specific mortalityTable 1 shows that during the twentieth century, the inter-quartile range <strong>of</strong> life expectancyin Europe rose substantially between 1900 and 1920 (women) and 1930 (men), and thendeclined to reach its lowest values in 1960. After 1960, however, it started to increase again,to reach values in 2008 that were similar to those seen before World War II. The first episode<strong>of</strong> widening occurred both in Western- and in Central- and Eastern Europe, but the mostrecent episode <strong>of</strong> widening is almost entirely due to developments in Central- and EasternEurope.Figure 2 shows trends in age-standardized mortality from all causes during the sametime-period. The three trend-lines represent the life expectancy values corresponding tothe first, second and third quartiles, respectively. In the first sub-period, all three trend linesdeclined spectacularly, both among men and among women, but at first this decline wasmore rapid in some countries than in others, causing divergence between the trend lines. Thisdivergence occurred both in Europe as a whole and in Western Europe only. In the secondsub-period we see the trend lines starting to decline and diverge again, but in this case a moredetailed analysis shows that the divergence is due to developments in Central- and EasternEurope.Whether we should regard the current divergence as equally severe as the one occurringduring the first decades <strong>of</strong> the 20 t h century depends strongly on the measure used. In absoluteterms, current disparities in life expectancy are almost as large as those observed in 1920 and1930, at least among men, but in relative terms (as a fraction <strong>of</strong> median life expectancy inEurope) the dispersion is much less. With regard to the age-standardized mortality rates, in107
a. MenTable 1. Variation in life expectancy in Europe, 1900-2008, by genderVariability in LEMen ca. 1900 ca. 1910 ca. 1920 ca. 1930 ca. 1939 ca. 1950 ca. 1960 ca. 1970 ca. 1980 ca. 1990 ca. 2000 ca. 2008# Countries 22 20 22 29 28 42 41 40 44 44 44 42Average 43,54 48,89 49,49 52,62 56,47 61,45 66,47 67,35 68,39 70,17 71,70 73,77Minimum 29,49 38,77 38,14 34,37 34,25 52,60 59,00 60,03 60,97 63,47 59,15 61,91Q1 40,22 45,60 45,33 48,73 54,88 58,96 65,40 66,18 66,10 66,61 68,72 70,10Q2 44,04 49,71 50,96 53,77 56,67 61,93 66,69 66,91 68,48 70,82 73,21 75,97Q3 47,01 53,71 53,82 57,83 60,04 64,41 67,92 68.97 70,86 73,42 75,59 77,90Maximum 51,77 56,44 57,52 63,96 66,93 70,32 72,45 72,36 73,59 75,62 77,92 80,14IQR (Q3-Q1) 6,79 8,11 8,49 9,10 5,17 5,46 2,52 2,78 4,77 6,82 6,86 7,79b. WomenVariability in LEWomen ca. 1900 ca. 1910 ca. 1920 ca. 1930 ca. 1939 ca. 1950 ca. 1960 ca. 1970 ca. 1980 ca. 1990 ca. 2000 ca. 2008# Countries 22 20 22 29 28 42 41 40 43 44 44 42Average 45,76 51,14 51,94 56,14 60,90 65,92 71,50 73,54 75,09 77,23 78,58 80,41Minimum 31,73 39,16 40,35 38,60 42,02 54,37 62,80 62,80 67,70 72,02 71,45 73,31Q1 42,02 46,53 46,58 51,40 58,83 63,05 70,64 72,99 73,26 75,39 76,21 77,87Q2 47,53 52,89 54,46 58,04 61,89 67,37 71,99 73,50 75,20 77,66 79,40 80,97Q3 49,45 54,94 56,23 59,47 64,10 69,00 73,32 75,29 77,07 79,25 81,08 83,13Maximum 55,15 59,63 60,17 65,60 69,04 73,53 75,86 77,46 80,55 81,83 83,15 84,84IQR(Q3-Q1) 7,43 8,41 9,65 8,07 5,27 5,95 2,68 2,30 3,80 3,86 4,86 5,26Notes: Q1 = life expectancy at first quartile. Q2 = life expectancy at second quartile or median. Q3 = life expectancy at third quartile.IQR = Inter-quartile range or Q3-Q1.108
Figure 2. Variation in age-standardized death rates in Europe, 1901-2008, by all causus,by gender4500ASDR all causes, men, EuropeASDR (per 100,000)4000350030002500200015001000500Q1Q2Q301901-051911-151921-251931-351936-401951-551961-65197119811990200020084000ASDR all causes, women, Europe3500ASDR (per 100,000)30002500200015001000Q1Q2Q350001901-051911-151921-251931-351936-401951-551961-6519711981199020002008Notes: ASDR = Age-standardized death rate; Q1 = age-standardized death rate at first quartile; Q2 =age-standardized death rate at second quartile or median; Q3 = age-standardized death rate at thirdquartile; IQR = Inter-quartile range or Q3-Q1.109
absolute terms current disparities are still well below those observed in the 1920 s . In relativeterms (as a fraction <strong>of</strong> the median), the variation in 2008 is larger than in the 1920 s for men,and <strong>of</strong> similar magnitude for women.The first episode <strong>of</strong> widening occurred in a period <strong>of</strong> rapid mortality decline, mainly because<strong>of</strong> declining mortality from infectious diseases. Figure 3 shows that some countries laggedbehind in their decline <strong>of</strong> mortality from infectious diseases, which led to a substantial gap inmortality from these causes. The second episode <strong>of</strong> widening occurred in a period <strong>of</strong> beginningmortality decline, driven by declining mortality from cardiovascular disease. Figure 3 showsthat there were substantial differences between countries in the starting year <strong>of</strong> mortalitydecline for cardiovascular diseases, and that mortality still went up in some countries while italready declined in some others, particularly among men. The countries lagging behind wereall in Central- and Eastern Europe. This led to a large gap in mortality from these causes.ConclusionsOur results suggest that both episodes <strong>of</strong> widening differences in life expectancy canplausibly be seen as resulting from differences between countries in timing <strong>of</strong> epidemiologictransitions. Although this suggests a common explanation <strong>of</strong> both episodes, at least at a verygeneral level, we also found an important difference between the two episodes which castsdoubt on a common explanation: the second episode is partly due to rising mortality in somecountries, which we did not observe in the first episode. This second episode <strong>of</strong> wideningdisparities in life expectancy also coincided with a rising gap in national income betweencountries which was caused by the impoverishment <strong>of</strong> a part <strong>of</strong> Europe following the collapse<strong>of</strong> the Soviet Union (Stuckler et al., 2009 and Maddisson, 2003). This did not simply cause adelay in epidemiological transition but appears to have led to an actual setback.Therefore, interpreting the recent widening in terms <strong>of</strong> a ‘normal’ delay <strong>of</strong> epidemiologicaltransitions related to the necessary diffusion <strong>of</strong> innovations across the European subcontinent,may well be a romantic illusion. The current episode <strong>of</strong> widening differences in life expectancyis an alarming phenomenon that should be a main focus <strong>of</strong> European policy making.110
Figure 3. Variation in age-standardized death rates in Europe, 1901-2008, infectious andcardiovascular diseases, men600ASDR infectious diseasesmen, Europe500ASDR (per 100,000)400300200100Q1Q2Q30200820001990198119711961-651951-551936-401931-351921-251911-151901-05900ASDR cardiovascular diseasesmen, EuropeASDR (per 100,000)800700600500400300200100Q1Q2Q30200820001990198119711961-651951-551936-401931-351921-251911-151901-05Notes: ASDR = Age-standardized death rate; Q1 = age-standardized death rate at first quartile; Q2 =age-standardized death rate at second quartile or median; Q3 = age-standardized death rate at thirdquartile.111
ReferencesLeon, D.A., V.M. Shkolnikov and M. McKee (2009), Alcohol and Russian mortality: A continuing crisis.Addiction (Abingdon, England). 104(10), pp. 1630-6. Epub 18 August 2009.Leon, D.A. (2011), Trends in European life expectancy: A salutary view. International Journal <strong>of</strong>Epidemiology, 40(2), pp. 271-7. Epub 19 March 2011.Maddison, A. (2003), The world economy: Historical statistics. Paris: Organisation <strong>of</strong> EconomicCooperation and Development.McMichael, A.J., M. McKee, V. Shkolnikov and T. Valkonen (2004), Mortality trends and setbacks:Global convergence or divergence? Lancet, 363 (9415), pp. 1155-9. Epub 6 April 2004.McKee, M. (2009), Public health in Central- and Eastern Europe and the former Soviet Union. In R.Beaglehole and R. Bonita (eds.). Global public health: A new era. Oxford etc.: Oxford UniversityPress; p. 101-21.Meslé, F. and J. Vallin (2006), Diverging trends in female old-age mortality: The United States and theNetherlands versus France and Japan. Population Development Review, 32(1), pp. 123-45.Moser, K., V. Shkolnikov and D.A. Leon (2005), World mortality, 1950-2000: Divergence replacesconvergence from the late 1980 s . Bulletin <strong>of</strong> the World Health Organization, 83(3), pp. 202-9. Epub31 March 2005.Pomerleau, J., K. Lock and M. McKee (2006), The burden <strong>of</strong> cardiovascular disease and cancer attributableto low fruit and vegetable intake in the European Union: Differences between old and new memberstates. Public Health Nutrition, 9(5), pp. 575-83. Epub 23 August 2006.Rechel, B. and M. McKee (2009), Health reform in central- and eastern Europe and the former SovietUnion. Lancet, 374(9696), pp. 1186-95. Epub 6 October.Riley, J.C. (2001), Rising life expectancy. A global history. Cambridge: Cambridge University Press, 243p.Robine, J.M., S. Le Roy and C. Jagger (1995), Changes in life expectancy in the European Union since1995: Similarities and differences between the 25 EU countries. n.p.: European Health ExpectancyMonitoring Unit (EHEMU); n.d.Rogers, E.M. (1962), Diffusion <strong>of</strong> innovations. Glencoe: Free Press.Stuckler, D., L. King and M. McKee (2009), Mass privatisation and the post-communist mortality crisis:A cross-national analysis. Lancet, 373(9661), pp. 399-407. Epub 20 January 2009.Vallin, J. and F. Mesle (2004), Convergences and divergences in mortality. A new approach to healthtransition. Demographic Research; SPECIAL COLLECTION 2, ARTICLE 2, pp. 11-44.Zatonski, W. (2008), Closing the health gap in the European Union. Warsaw: Maria Sklodowska-CurieMemorial Cancer Center and Institute <strong>of</strong> Oncology, 227 p.112
Heat waves and elderly mortality responses: What about socialdifferential vulnerability?Michel Oris and Mathias Lerch 1In his long and so successful journey across demography and population history, <strong>Frans</strong> <strong>van</strong><strong>Poppel</strong> explored many topics, always bringing original and important contributions. It wasalso the case when he addressed the relations between temperature fluctuations and themodernization <strong>of</strong> human behaviours, this later being apparent in the reduction <strong>of</strong> mortalityresponses. We can wonder if this long historical trend is not reaching its end and if humanpopulations are not becoming again vulnerable to climatic variations. Although heat waveshave a long history, it was in 1995 that temperature peaks emerged as ‘new social risks’ on thepolitical agenda. Indeed, in July <strong>of</strong> that year approximately 750 heat-related deaths occurredin Chicago over a period <strong>of</strong> just five days. Eric Klinenberg’s 2002 book Heat wave: A socialautopsy <strong>of</strong> disaster in Chicago became a bestseller since in 2003 Europe was also hit by asimilarly brutal episode. A so-called Omega block had led to a stagnation <strong>of</strong> the weatherpattern, creating a high-pressure ridge that lasted for several days, mainly in France, Italy andSwitzerland. The resulting record temperatures caused an excess <strong>of</strong> deaths that is estimated torange from 35,000 to 55,000. 2 The large majority <strong>of</strong> the victims were elderly living in urbanagglomerations (Sardon, 2006, p. 292 and Kovatz and Jendritzky, 2006).Those experiences have been traumatic from both a psychosocial and a political point <strong>of</strong>view, and heat wave has since become an issue <strong>of</strong> general concern about the future <strong>of</strong> oursocieties. The challenges for human health are particularly intensified by the changing pattern<strong>of</strong> global warming, which is increasingly driven by an increase in maximum rather thanminimum temperature and therefore mainly concerns summer rather than winter periods whencompared to the past (Rebetez et al., 2008). Human populations are therefore increasinglyexposed to extreme heat events and are expected to be so in the future. Indeed, despite theongoing debate around climate change, predictions <strong>of</strong> an intensification <strong>of</strong> heat wave episodes(in frequency, intensity and duration) appear to be robust (Beniston, 2004). Furthermore, alldemographic scenarios consistently predict a massive increase <strong>of</strong> the share <strong>of</strong> elderly people,thus the expectation <strong>of</strong> a growing number <strong>of</strong> frail people who can be considered vulnerableto the effects <strong>of</strong> climate change.In this context, many teams are elaborating projections combining demographic perspectivesand climate change models. For example, Peng et al. (2011) estimate the yearly excess <strong>of</strong>deaths for the city <strong>of</strong> Chicago for 2081-2100 in seven global climate models. Ouranos (http://ww.www.ouranos.ca/) does the same for Canada. The counter-view <strong>of</strong> these catastrophicscenarios for our future is firstly, that humanity will progressively learn how to cope with1This paper is a contribution <strong>of</strong> the research group 13 to the NCCR LIVES. The NCCRs are a tool <strong>of</strong> the Swiss NationalScience Foundation and we are grateful for this support.2In a 2008 published article, Jean-Marie Robine and his colleagues even estimated that ‘Death toll exceeded 70,000 inEurope during the summer <strong>of</strong> 2003’.113
climate change and secondly, that the decrease <strong>of</strong> winter deaths will compensate the rise <strong>of</strong>summer mortality. The European project Climate Trap, supported by <strong>of</strong> COST Action 730since 2005, has the ambitions to construct a Universal Thermal Climate Index including thehuman capacities for anticipation and acclimatization.Those studies and the debate about our uncertain future provide a typical illustration <strong>of</strong> the‘risk society’ that Ulrich Beck defined as “a systematic way <strong>of</strong> dealing with hazards andinsecurities induced and introduced by modernization itself” (1992, p. 21). We considerhowever that the attempts to predict what will happen in the next decades are premature, andthat we still need to go back to the basis. Indeed, many crucial knots in the causal chain remainunclear. In this short contribution, we consider only the social dimensions <strong>of</strong> vulnerabilitywhen elderly are at risk <strong>of</strong> death during heat waves.Till now few studies were able to control socio-economic factors at the individual level or, ifthey did so, only for a small sample <strong>of</strong> population or deaths. Due to constraints <strong>of</strong> the data,socio-economic characteristics <strong>of</strong> the whole population living in a specific place are <strong>of</strong>tenused as a proxy for status <strong>of</strong> all the inhabitants. Since this approach reduces the concept <strong>of</strong>contextual effects to the aggregation <strong>of</strong> individual effects, it implies an ecological bias. Thismay be one reason for the heterogeneity in conclusions <strong>of</strong> studies that investigated the effect <strong>of</strong>socio-economic status at the aggregate level using local percentages <strong>of</strong> unemployed or lowlyskilled population, median incomes or other composite indexes. No effect on heat-relatedmortality was observed in Rome (Schifano et al., 2009), Brisbane (Yu et al., 2010), Budapestand London (Ishigami et al., 2008). However, poorer neighbourhoods had a higher excessmortality relative to affluent ones during heat-waves in St. Louis (Smoyer, 1998) and medianneighbourhood income was associated to higher heat-related mortality among the non-elderlyin Milano (Ishigami et al., 2008). Excess mortality was also higher in deprived areas <strong>of</strong> thecity <strong>of</strong> Paris and its strongly urbanised suburbs (Rey et al., 2009). Comparing 11 US cities,Curriero (2002) also found a stronger mortality response to heat where the level <strong>of</strong> schoolingwas lower and poverty more prevalent.Canoui-Poitrine et al. (2006) observed a change in both the geographical and thesocio-economic composition <strong>of</strong> the deaths during the heat wave in Paris when comparedto reference years. They therefore concluded that contextual and individual factors bothmatter for heat-related mortality. But in Sao Paulo, regional levels <strong>of</strong> unemployment hadno significant impact (Gouveia et al., 2003), whereas the lower-skilled population indeedhad a higher excess mortality. This contrasted with the findings in Mexico and Chile, whereindividual educational attainment did not have an effect (Bell et al., 2008). However, manualworkers in France had a higher mortality than managers at older ages during heat waves(Vandentorren et al., 2006).Even when the effect <strong>of</strong> socio-economic status is estimated simultaneously at the individual andcontextual level, results diverged. Unemployment levels did not affect heat-related mortalityin Barcelona, but the lowest skilled elderly women were characterized by the highest excessmortality (Borell et al., 2006 and Browning et al. 2006). By contrast the authors showed that114
individual socio-economic characteristics had the same effect on mortality during the 1995heat wave in Chicago when compared to previous summers. But neighbourhood affluenceand commercial vitality protected individuals only during the heat wave. A more dynamicsocial ecology, it was argued, is protective against heat-related mortality since it maintainshealthier social institutions and limits the decay <strong>of</strong> infrastructure in neighbourhoods.Conclusions regarding social risk factors are heterogeneous as well. Social isolation at theindividual level is <strong>of</strong>ten implied from marital status, assuming the single, divorced andwidowed to be more at risk <strong>of</strong> isolation. Unmarried elderly had indeed a higher mortalityin Rome (Schifano et al., 2009) and in Paris (Canoui-Poitrine et al., 2006). In the latterhowever, this may have resulted from a mortality selection effect, as marital status did notplay a role when controlling for several individual and household-level variables indicatingsocial status (Vandentorren et al., 2006). Rather than marital status, living arrangement mayspecifically matter. In Modena, unmarried women did not have a higher mortality whencontrolling for negative effects associated to living in either a single-person household ora care institution (where people are probably frailer and accumulate co-morbidities). At thelocal level, a denser social interaction is usually expected to increase assistance to thosepeople most sensible to heat. Assuming the demographically more stable neighbourhoodsto be characterized by a higher degree <strong>of</strong> social interaction, Smoyer (1998) and Uejio etal. (2011) indeed observed a negative relationship with heat-related mortality in St. Louisand in Philadelphia. The empirical sociological investigation <strong>of</strong> Klinenberg (2002) on the1995 episode in Chicago showed higher vulnerability among African-Americans comparedto Hispanics. The author attributed this difference to the fact that many African-Americanslived in areas <strong>of</strong> sub-standard housing and less cohesive neighbourhoods while Hispanicslived in areas <strong>of</strong> higher density but with more social cohesion. However, Browning et al.(2006) did not find an effect <strong>of</strong> the neighbourhood’s demographic stability.This review <strong>of</strong> a rich literature that includes many excellent studies demonstrates the interest<strong>of</strong> the scientific community for heat episodes related mortality. However, we remain with achallenging puzzle <strong>of</strong> contradictory conclusions. New research designs need to be built, witha multilevel approach.ReferencesBeck, Ulrich (1992), Risk society: Towards a new modernity. New Delhi: Sage.Bell, Michelle L., Marie S. O'Neill, Nalini Ranjit, Victor H. Borja-Aburto, Luis A. Cifuentes and NelsonC. Gouveia (2008), Vunerability to heat-related mortality in Latin America: A case-crossover study inSao Paulo, Brazil, Santiago, Chile and Mexico City, Mexico. International Journal <strong>of</strong> Epidemiology,37, pp. 796-804.Beniston, Martin (2004), The 2003 heat wave in Europe: A shape <strong>of</strong> things to come? An analysis based onSwiss climatological data and model simulations. Geophysical Research Letters, 31, L02202, pp. 1-4.Borell, Carme, Marc Mari-Dell'Olmo, Maica Rodriguez-Sanz, Patricia Garcia-Olalla, Joan Al. Cayla, JoanBenach and Carles Muntaner (2006), Socio-economic position and excess mortality during the heatwave <strong>of</strong> 2003 in Barcelona. European Journal <strong>of</strong> Epidemiology, 21, pp. 633-640.115
Browning, Christopher R., Danielle Wallace, Seth L. Feinberg and Kathleen A. Cagney (2006),Neighborhood social processes, physical conditions, and disaster-related mortality: The case <strong>of</strong> the1995 Chicago heat wave. American Sociological Review, 71 (August), pp. 661-678.Canoui-Poitrine, F., E. Cadot, A. Spira and Groupe Régional Canicule (2006), Excess deaths during theAugust 2003 heat wave in Paris, France. Revue d'Epidemilogie et Santé Publique, 54, pp. 127-135.Curriero, Frank C., Karylin S. Heiner and Jonathan M. Samet (2002), Temperature and mortality in 11cities <strong>of</strong> the Eastern United States. American Journal <strong>of</strong> Epidemiology, 155(1), pp. 80-87.Gouveia, Nelson, Shakoor Hajat and Ben Armstrong (2003), Socio-economic differetials in the temperaturemortalityrelationship in Sao Paulo, Brazil. International Journal <strong>of</strong> Epidemiology, 32, pp. 390-397.Ishigami, Ai, Shakoor Hajat, R. Sari Kovats, Luigi Bisanti, Magda Rognoni, Antonia Russo and AnnaPaldy (2008), An ecological time-series study <strong>of</strong> heat-related mortality in three European cities.Environmental Health, 7(5).Klinenberg, Eric (2002), Heat wave: A social autopsy <strong>of</strong> disaster in Chicago. Chicago, IL: ChicagoUniversity Press.Kovats, S. and G. Jendritzky (2006), Heat waves and human health. In B. Menne and K.L. Ebi (eds.),Climate change and adaptation strategies for human health. Darmstadt, pp. 63-97.Peng, R.D., J.F. Bobb, C. Tebaldi, L. McDaniel, M.L. Bell and F. Dominici (2011), Towards a quantitativeestimate <strong>of</strong> future heat wave mortality under global, climate change. Environmental Health Perspectives,119(5), pp. 701-706.Rebetez, M., O. Dupont and M. Giroud (2008), An analysis <strong>of</strong> the July 2006 heatwave extent in Europecompared to the record year <strong>of</strong> 2003. Theoretical and Applied Climatology.Rey, Grégoire, Anne Fouillet, Pierre Bessemoulin, Philippe Frayssinet, Anne Dufour, Eric Jougla andDenis Hémon (2009), Heat exposure and socio-economic vulnerability as synergistic factors in heatwave-relatedmortality. European Journal <strong>of</strong> Epidemiology, 24, pp. 495-502.Robine, J.M., S.L. Cheung, S. Le Roy, H. Van Oyen, C. Griffiths, J.P. Michel and Fr. Herrmann (2008),Death toll exceeded 70,000 in Europe during the summer <strong>of</strong> 2003. C R Biol, 331(2), pp. 171-178.Sardon, J.P. (2006), Evolutions démographiques récentes des pays développés. Population, 61(3), pp. 227-300.Schifano, Patrizia, Gio<strong>van</strong>na Cappai, Manuela De Sario, Paola Michelozzi, Claudia Marino, Anna MariaBargagli and Carlo A. Perucci (2009), Susceptibility to heat wave-related mortality: A follow-up study<strong>of</strong> a cohort <strong>of</strong> elderly in Rome. Environmental Research, 8(50), pp. 1-14.Smoyer, Karen E. (1998), Putting risk in its place: Methodological considerations for investigating extremeevent health risk. Social Science and Medicine, 47(11), pp. 1809-1824.Uejio, Christopher K., Olga V. Wilhelmi, Jay S. Golden, David M. Mills, Sam P. Gulino and Jason P.Samenow (2011), Intra-urban societal vulnerability to extreme heat: The role <strong>of</strong> heat exposure andthe built environment, socio-economics, and neigborhoods stability. Health & Place, 17, pp. 498-507.Vandentorren, S., P. Bretin, A. Zeghnoun, L. Mandereau-Bruno, A. Croisier, C. Cochet, J. Ribéron, I.Siberan, B. Declercq and M. Ledrans (2006), August 2003. Heat wave in France: Risk factors for death<strong>of</strong> elderly people living at home. European Journal <strong>of</strong> Public Health, 16(5), pp. 583-591.Yu, Weiwei, Pavla Vaneckova, Kerrie Mengersen, Xiaochuan Pan and Shilu Tong (2010), Is the associationbetween temperature and mortality modified by age, gender and socio-economic status? Science <strong>of</strong> theTotal Environment, 408, pp. 3513-3518.116
<strong>Frans</strong> <strong>van</strong> <strong>Poppel</strong> and the study <strong>of</strong> perinatal and childhood mortalityDiego Ramiro-FariñasOne <strong>of</strong> the many areas in which <strong>Frans</strong> <strong>van</strong> <strong>Poppel</strong> has been involved during his fruitful careeris the study <strong>of</strong> mortality and more specifically the study <strong>of</strong> perinatal health and childhoodmortality. His work focused on different aspects <strong>of</strong> this topic: Practices and care <strong>of</strong> delivery,via doctors or midwives, health <strong>of</strong> the mothers or infant and child mortality, among others. One<strong>of</strong> the areas, fetal mortality, attracted his attention during the last years via his collaborationwith Robert Woods. International collaboration is indeed one <strong>of</strong> the gifts that <strong>Frans</strong> gives tothe rest <strong>of</strong> the international academic community, and this area is one <strong>of</strong> many in which hehas shown it.In ‘Two hundred years <strong>of</strong> evidence-based perinatal care: Late fetal mortality in the past’,Robert Woods, Anne Lokke and <strong>Frans</strong> <strong>van</strong> <strong>Poppel</strong> showed the longest possible time series<strong>of</strong> fetal mortality in several countries in Europe and pinpointed the role <strong>of</strong> the improvementsin the quality <strong>of</strong> obstetric care and the registration <strong>of</strong> fetal deaths during that period <strong>of</strong> time.Despite the complications <strong>of</strong> estimating such series, as they mentioned in the paper, thissimple comparison <strong>of</strong> the long-run time series <strong>of</strong>fers some unexpected clues, such as thehill-shaped trend in the middle <strong>of</strong> the 19 th century which also appeared in other early-childhoodmortality estimates and for several countries in Europe. This hill shape pattern from the1820 s to the 1850 s was tentatively explained in different ways: To a certain degree it wasassociated with improvements in the quality <strong>of</strong> stillbirth registration. Iit was connected tosocio-economic factors which were <strong>of</strong> particular importance, such as maternal nutrition, laborforce participation and reproductive history, which has long been known to influence fetalgrowth. The possibility <strong>of</strong> premature birth or the hill shape can also be connected to the risingpercentage <strong>of</strong> poor laborers in the populations, to the famine following the potato blight <strong>of</strong>the 1840 s , to changes in the disease environment in which the mother lived or to somethingelse. In his work, <strong>Frans</strong> used the data on Zeeland, to show that it had an extraordinary highpercentage <strong>of</strong> stillbirths compared with the rest <strong>of</strong> the Netherlands. Zeeland had a late-fetalmortality rate (stillbirth rate) peaking at just over 60 per 1,000 total births in the 1860 s . Thiscalled the attention <strong>of</strong> Dutch authorities and therefore several special committees were set upto investigate the causes. These committees pointed to the absence <strong>of</strong> trained midwives anddoctors in the province as the reasons for such high levels, and this situation did not changeuntil measures to improve birth assistance in these areas were taken from the late 19 th centuryonwards. In later works <strong>Frans</strong> considered the formal and likely causes <strong>of</strong> the Zeeland trend,the quality <strong>of</strong> stillbirth registration, and focused in particular on the clustering <strong>of</strong> fetal deathsin families and social groups, making use <strong>of</strong> a highly detailed database where he exploresboth the correlates and the possible implications for such clustering.In both cases, <strong>Frans</strong> <strong>van</strong> <strong>Poppel</strong> and Robert Woods tried to answer some <strong>of</strong> the key questionsfor research on historical fetal and neonatal mortality patterns, such as to gather directevidence for the level <strong>of</strong> late-fetal mortality in the past, using data from more statiscallyad<strong>van</strong>ced societies. To estimate the age pattern <strong>of</strong> fetal and infant mortality in high-mortality117
populations where life expectancy at birth was less than 40 years. Or to estimate the stillbirthrate from ‘knowledge’ <strong>of</strong> other mortality rates and to try to understand what form <strong>of</strong> predictiveassociation exists between them, and trying to overcome the problems related with languageand definition conventions, blurred age categories, registration practices, the organization <strong>of</strong>the statistical system, the estimation and the proximate causes <strong>of</strong> death and the backgroundcauses.Although in the past there have been studies dealing with differential stillbirth mortality inurban and rural areas or by legitimacy and some examples <strong>of</strong> those studies are given in thetable below, there is still a lack <strong>of</strong> understanding <strong>of</strong> the levels <strong>of</strong> mortality between conceptionuntill birth. How these levels were fluctuating in the past, what was the role <strong>of</strong> natural orintentional abortion through time and what would be the best proxi to estimate such mortalityconsidering that it will be almost impossible to gather complete and detailed information onpregnancy loss for historical times? The attempts carried out to estimate the risk <strong>of</strong> fetal deathby gestation duration in different studies, in follow up studies <strong>of</strong> recognized pregnancies, hasshowed very different results, especially during the first 12 weeks <strong>of</strong> gestation (see figure 1).On the other hand, the attempts to estimate stillbirth mortality from other infant mortalitymeasures, such as neonatal mortality or first week mortality have been unsuccessful.Considering the rele<strong>van</strong>ce <strong>of</strong> the influence <strong>of</strong> fetal mortality over birth outcomes and the size<strong>of</strong> each cohort, it is crucial to find ways in which we can disentangle this conundrum, and Iam sure <strong>Frans</strong> will carry on doing it in the future.118Table 1. Comparative SBR for the 1860 s , 80 s and 1920 sNorway Denmark Sweden France Belgium Finland(1881-85)Spain(1922-31)Japan(1922-31)Total births 36,7 38,9 32,7 34,4 35,9 30,0 54,1Capital 56,5 42,9 (69,6)Towns 42,5 32,2 40,7 41,5 41,7 57,8 62,4Rural areas 34,7 39,6 31,6 29,8 33,7 23,8 53,0Urban/Rural 1,2 0,8 1,3 1,4 1,2 2,4 1,2Legitimate 34,5 37,9 31,3 32,2 34,7 28,3births totalCapital 45,2 37,0 (63,8)Towns 38,0 30,5 35,4 38,2 39,3 28,3 54,4Rural areas 33,6 39,3 30,8 28,4 33,1 26,2 22,8Urban/Rural 1,1 0,8 1,1 1,3 1,2 1,1 2,4Illegitimate 54,7 47,8 46,0 62,0 51,0 56,3births totalCapital 112,6 64,3 (85,6)Towns 85,6 45,9 56,2 67,5 59,4 61,1 79,1Rural areas 49,0 43,3 41,3 53,1 44,1 44,5 44,9Urban/Rural 1,7 1,1 1,4 1,3 1,3 1,4 1,8Source: Woods, 2007, Pitkänen, 1983 and Ramiro and Murakoshi, 2004.
Figure 1. Risk <strong>of</strong> fetal death by gestation duration in different studies. (for 1,000 recognizedpregnancies) per thousand1000100% 01014-7 8-11 12-15 16-19 20-23 24-27 28-31 32-35 36-39 40+Gestation duration , weeksFrench and Bierman (1962) Kauai Island, Hawaii, 1953-1956Schapiro et al. (1962) New York, United States, 1958-1959Erhardt (1963) New York, United States, 1960Taylor (1970) California, United states, 1959-1966Goldhaber and Fireman (1991) California, United States, 1981-1982Gourbin (2002) Hungary, 1984-1988Source: Constructed from Gourbin, 2006.119
120Demographic systems and population change: Restoring mortalityits rightful placeDavid ReherDemographic commonsense suggests that mortality should be a cornerstone –perhaps THEcornerstone- for all demographic systems both past and present. This should be the case withhigh mortality societies but also in societies characterized by moderate or even relativelylow levels <strong>of</strong> mortality. The internal logic underlying demographic systems as defined byMalthus is based on the interplay between the carrying capacity <strong>of</strong> any given society andthe way it interacts with population size and growth. Excess growth leads to falling livingstandards and eventually to demographic adjustment by means <strong>of</strong> what he termed preventiveand positive checks. With the exception <strong>of</strong> exogenous mortality shocks –epidemics–, withinthese systems mortality is determined basically by prevailing living standards and its key roleis how it affects growth rates. Researchers have been hard put to find a more rele<strong>van</strong>t rolefor mortality in pre-industrial societies or even, for that fact, to establish clearly its sensitivityto economic change. Faced with the non-responsiveness <strong>of</strong> mortality to basic swings in realwages in England and Wales, for example, Wrigley and Sch<strong>of</strong>ield (1981) ended up attributingto fertility, and especially to nuptiality, the key to the existing demographic system, especiallyins<strong>of</strong>ar as how they affected population growth rates. Researchers making use <strong>of</strong> distributedlag models have only found weak links between economic fluctuations and mortality inlow-mortality countries like England. Only in higher mortality societies does the situationappear to be different, at least in part (Lee, 1981; Galloway, 1988 and Reher and Ortega,2000).The relative neglect <strong>of</strong> the role <strong>of</strong> mortality has carried over into research on the demographictransition. Contrary to the initial intuitions <strong>of</strong> Notestein, one <strong>of</strong> the most salient results <strong>of</strong> theEuropean Fertility Project was that mortality and mortality change appear to have playedlittle or no role in stimulating fertility change. It is not our purpose here to examine why theyreached such an apparently counter-intuitive conclusion, but rather to show that once againmortality was relegated to a secondary role when explaining major demographic change, anorphan so to speak at the banquet <strong>of</strong> demographic enquiry on a grand scale.Mortality is <strong>of</strong> course central to determining population growth rates and therefore key to theviability and resiliency <strong>of</strong> any demographic system. The way this plays out, however, is nothow Malthus envisioned with prevailing mortality levels oscillating more or less in accordwith short and medium-term economic swings. The key role <strong>of</strong> mortality is not so much inhow it shapes population growth directly but how it influences fertility. There are very directcausal links going from mortality to both fertility and nuptiality. In the past, societies withhigh mortality were invariably ones with high fertility. Women tended to marry early wheninheritance came early and also where there was a social awareness that they needed to havemany childbirths if just a few were to survive. A woman who lost a child tended to haveanother one soon afterward both because she wanted another child and also because losing achild cut breastfeeding short and initiated a rapid return to fecundability (Reher, 1999).
Prevailing mortality levels provide the ultimate explanation <strong>of</strong> why there are high andlow-pressure demographic systems in different parts <strong>of</strong> the pre-industrial world and whythese appear to be so stable over time. It also provides the ultimate explanation <strong>of</strong> why fertilitydeclined during the demographic transition, especially during its initial stages. As childhoodmortality declined, fertility declined as well, <strong>of</strong>ten quite independent <strong>of</strong> whether or not womenwanted smaller families. This has been shown forcefully in two recent publications, one <strong>of</strong>which I was fortunate enough to coauthor with my much-admired friend and colleague <strong>Frans</strong><strong>van</strong> <strong>Poppel</strong> (Reher and Sanz, 2007 and Van <strong>Poppel</strong> et al., 2012). From a historical standpoint,demographic systems may be much more about mortality and mortality change than they areabout nuptiality, fertility, family formation patterns or economic change.This being the case, a key issue requiring the attention <strong>of</strong> demographers and historicaldemographers alike is why mortality tended to be so persistently different in different areasat any given moment in the past and why and how it changed. Here the answers are multiple,intriguing but <strong>of</strong>ten incomplete. Living standards are important <strong>of</strong> course, but so are climate,resource availability and life styles, as well as the incidence <strong>of</strong> epidemics and infectiousdisease. It is also a matter <strong>of</strong> maternal education, especially during the demographictransition. In many ways, childhood mortality is a product <strong>of</strong> parental expectations regardingchild survival and in societies where this was low, parents tended to ‘expect’ their childrento die and thus paid less attention to their health early in life. This last aspect is also a matter<strong>of</strong> culture, as the enormous differences in mortality for different religious groups and socialclasses in Europe has so forcefully shown. Analysis <strong>of</strong> these patterns <strong>of</strong> behavior has been aprominent part <strong>of</strong> much <strong>of</strong> <strong>Frans</strong> <strong>van</strong> <strong>Poppel</strong>’s most incisive work over the years (Van <strong>Poppel</strong>et al., 2012; 2005; 2012; Van <strong>Poppel</strong> and Nelissen, 1999 and Van <strong>Poppel</strong>, 1985). All <strong>of</strong> thesefactors come into play when explaining mortality and mortality change in the past and theyalso contribute to our understanding <strong>of</strong> demographic systems and demographic change.Eventually the ascendancy <strong>of</strong> mortality came to an end, though not before well into the 20 thcentury. The appearance <strong>of</strong> reproductive strategies based on small completed family size isthe beginning <strong>of</strong> the end <strong>of</strong> this hegemony in the developed world though it is instructive torecall that this type <strong>of</strong> change could never have happened before child survival had improvedto a point where it was no longer rele<strong>van</strong>t for reproductive decisions. This also happened inthe developing world, though in the opposite direction, when mortality declined dramaticallyduring the central decades <strong>of</strong> the twentieth century and fertility no longer responded in kind.There too the link between them had been severed, thus marking the end <strong>of</strong> the reign <strong>of</strong>mortality as the key determinant <strong>of</strong> demographic systems and demographic change.ReferencesGalloway, P. (1988), Basic patterns <strong>of</strong> annual variations in fertility, nuptiality, mortality and prices in preindustrialEurope. Population Studies, 42/2, pp. 275-303.Lee, R.D. (1981), Short-term variation: Vital rates, prices and weather. In E.A. Wrigley and R.S. Sch<strong>of</strong>ield,The Population History <strong>of</strong> England, 1541-1871; A Reconstruction. Cambridge Mass.: HarvardUniversity Press, pp. 356-401.121
The impact <strong>of</strong> the 1911 heat wave on mortality in the Dutch province <strong>of</strong>LimburgWillibrord RuttenThe start <strong>of</strong> rapid mortality decline in the Netherlands was determined around 1880. 1 However,in the southern parts <strong>of</strong> the country, in particular the provinces <strong>of</strong> Noord-Brabant and Limburg,the onset <strong>of</strong> the ‘new mortality regime’ came much later. Early childhood mortality declinedless rapidly in these areas. Infant mortality rates did not show any substantial improvementand even increased in the province <strong>of</strong> Limburg until the early 20 th century (figure 1). Culturalfactors played a relatively important role in regional variations in mortality decline. Thehigh percentage <strong>of</strong> Roman Catholics living in these areas was determined as a major factorcontributing to the higher mortality in the South. 2 In those days Catholics gave less emphasisto respect for life and avoidance <strong>of</strong> health hazards. For example, during the 19 th centuryvaccination campaign against smallpox it turned out that Roman Catholics were less infavor <strong>of</strong> active prevention than mainstream Protestants. 3 Hygienic awareness was low. It wasparticular the Catholic mothers who did not breast-feed their babies at all or just for a shorterperiod. It is presumed that the low incidence <strong>of</strong> breast-feeding was part <strong>of</strong> an ideologicalsystem, constructed by the regional clergy and the regional Catholic elite. 4 This Catholicideological system was characterized by extreme prudishness. Misplaced shame <strong>of</strong> thefemale body is said to have incited women to replace breast-feeding by bottle-feeding andweaning <strong>of</strong> children at an early age. 5 However, it is problematic to blame Catholic doctrinefor this. The neglect <strong>of</strong> breast-feeding was contrary to the principles <strong>of</strong> pastoral medicineand pastoral health care. As it was stated in Carl Capellmann’s Medicina pastoralis, anauthoritative textbook for the Catholic clergy and seminary students: “Unde patet, certum esse<strong>of</strong>ficium matris, non fraudare infantem cibo a Deo ipso ad hoc sibi dato, sed suo ipsius lactenutrire”. 6 In translation: Clearly, breast-feeding is a maternal duty. It is an error to deprivethe baby from the mother’s milk, being a nourishment created by the good Lord himself t<strong>of</strong>eed the infants. Exceptionally, in clearly specified circumstances, Catholic doctrine allowedbreast-feeding to be replaced by bottle-feeding, in particular during illness and in case <strong>of</strong> loss<strong>of</strong> earnings, which applies to young working mothers employed outside their homes. 7 Other1Theo Engelen, Van 2 naar 16 miljoen mensen. Demografie <strong>van</strong> Nederland, 1800-nu (Amsterdam 2009) pp. 98-99.2Judith Wolleswinkel-<strong>van</strong> den Bosch, The epidemiological transition in the Netherlands (Rotterdam 1998) p. 170.3Willibrord Rutten, ‘De vreselijkste aller harpijen’. Pokkenepidemieën en pokkenbestrijding in Nederland in de 18 e en19 e eeuw: een sociaal-historische en historisch-demografische studie. AAG-Bijdragen 36 (Wageningen, 1997) p. 342(graph 10.14) and p. 421.4F. <strong>van</strong> <strong>Poppel</strong>, ‘Religion and health: Catholicism and regional mortality differences in 19 th -century Netherlandse’,Social History <strong>of</strong> Medicine, 5:(2) (1992) pp. 229-253.5P. Meurkens, Sociale verandering in het Oude Kempenland; demografie, economie en cultuur <strong>van</strong> een pre-industriëlesamenleving (Nijmegen, 1984).6Carl Capellmann, Medicina pastoralis (Aquisgrani 1877, 3 rd edition 1893) p. 47. The Medicina pastoralis wastranslated into English, French, German, Spanish and had many editions from 1877 until at least 1926.7Idem, pp. 48-49.123
Figure 1. Infant deaths per 1.000 live births in Limburg and the Netherlands. Annual figures,1851-1975 (deceased before registration included from 1918)3002502001501005001851 1861 1871 1881 1891 1901 1911 1921 1931 1941 1951 1961 1971LimburgNetherlandsSource: Verslag <strong>van</strong> den toestand <strong>van</strong> het hertogdom Limburg (1851-); Statistisch Jaarboek voor hetKoninkrijk der Nederlanden (1857-); Jaarcijfers voor het Koninkrijk der Nederlanden (1892-);Statistiek <strong>van</strong> den loop der bevolking in Nederland (1900-); Statistical Yearbook (1970-).factors frustrating the practice <strong>of</strong> breast-feeding must be accounted for. In rural societieslike Limburg the nursery <strong>of</strong> babies was commonly left to older sisters, aunts, grandmothers,allowing the mothers to resume their work on the family farm within a couple <strong>of</strong> weeks afterdelivery.Anyhow, the diminished frequency and duration <strong>of</strong> breast-feeding resulted in a rise in infantmortality in the province <strong>of</strong> Limburg. During hot weather artificial feeding <strong>of</strong> childrenbecame even more difficult than it already was under normal circumstances. The relationshipbetween temperature and mortality in the Netherlands was tested for a long historical periodby <strong>Frans</strong> <strong>van</strong> <strong>Poppel</strong> cum suis in an unique empirical study. 8 They found out that childrenwere by far the most vulnerable group when temperature peaked. Effects <strong>of</strong> heat on mortalitywere observed within one or two days and the impact was strongest for infants below ageone. Delayed effects <strong>of</strong> extremely high temperatures were found among the youngest agegroups too, until four weeks after a heat wave. They also observed strong regional differences8Peter Ekamper, <strong>Frans</strong> <strong>van</strong> <strong>Poppel</strong>, Coen <strong>van</strong> Duin and Kees Mandemakers, ‘Heat waves and cold spells and their effecton mortality: An analysis <strong>of</strong> micro-data for the Netherlands in the 19 th and 20 th centuries’, Annales de DémographieHistorique (2010) pp. 55-104.124
in the effect <strong>of</strong> heat on mortality. However the southern province <strong>of</strong> Limburg, by neglect <strong>of</strong>breast-feeding highly vulnerable for periods <strong>of</strong> heat and drought, was not included in thedataset. In the summer <strong>of</strong> 1911 the people <strong>of</strong> Limburg had to cope with 22 tropical days(≥30°C). 9 What was the impact <strong>of</strong> the 1911 heat wave on Limburg mortality?Mortality data were retrieved from the GENLIAS-database. 10 I used meteorological datafrom the Maastricht weather station. 11 The distance between the weather station and thearea for which the weather measurements were considered indicative was acceptable. Thedistance between the weather station and any <strong>of</strong> the province’s municipalities for which wehad mortality data was about 111 kilometers in straight line.Applying the definition 12 <strong>of</strong> the Netherlands Royal Meteorological Institute to the weatherstation in Maastricht the south <strong>of</strong> the country witnessed in 1911 a prolonged heat wave thatlasted from 20 July to 14 August, including 11 summer days and 15 tropical days. Highestmaximum temperatures were measured on 23 July (36,2°C) and 28 July (36,3°C). The heatwave was followed by a second episode <strong>of</strong> warm weather lasting from 18 August to 13September. The period from 1 September to 13 September almost generated a second heatwave, including 6 summer days and 5 tropical days, but cannot be qualified as such becausethis episode <strong>of</strong> extremely high temperatures was interrupted twice by a one day cooling down(maximum temperature 23,7 and 22,0°C).The impact <strong>of</strong> extreme temperatures on death rates is presented in figure 2, showing the dailymortality ratio (the observed number <strong>of</strong> deaths in a day divided by the average number <strong>of</strong>deaths per day in that year) and the average 24-hour temperature from May to October 1911.The daily mortality ratio was calculated both for all ages and ages below 2. The summer<strong>of</strong> 1911 had devastating effects, with mortality ratios for all ages incidentally exceedingvalues around two (a doubling <strong>of</strong> the expected number <strong>of</strong> deaths). The effects <strong>of</strong> extremeheat consisted <strong>of</strong> a more or less instantaneous effect and a more delayed effect, in particularon early childhood mortality. Temperature peaked for the first time around 7 July which wasfollowed by a peak around 13 July in the number <strong>of</strong> deaths <strong>of</strong> children up to two years. Forthe next few days mortality receded. After the heat wave beginning around 20 July mortalitystarted to increase again, but did not return again on its pre-peak level though temperaturedeclined for a few days. Each new peak in temperature generated a surplus mortality that wasadded to the up-trending mortality level generated by the delayed effects <strong>of</strong> earlier peaks intemperature. A time lag <strong>of</strong> about four weeks is observed between highest temperatures andhighest mortality.9As compared to 12 in the north and the center <strong>of</strong> the Netherlands.10By courtesy <strong>of</strong> Regionaal Historisch Centrum Limburg (Ria Cruts).11KNMI, Daggevens <strong>van</strong> het weer in Nederland. Electronic source retrieved (2012) from http://www.knmi.nl/klimatologie/daggegevens/download.html12According to the <strong>of</strong>ficial definition by the Netherlands Royal Meteorological Institute a heat wave is defined as aperiod <strong>of</strong> at least five days, each with a maximum temperature <strong>of</strong> at least 25°C (called summer days), including atleast three days with a maximum <strong>of</strong> temperature <strong>of</strong> at least 30°C (called tropical days) measured at the De Bilt stationlocated in the centre <strong>of</strong> the Netherlands during a period <strong>of</strong> at least five days.125
Figure 2. Daily mortality ratio (scales left) and average 24-hour-temperature (°C) (scales right) inthe Dutch province <strong>of</strong> Limburg, May to October 191163052542031521015001-mei 15-mei 29-mei 12-jun 26-jun 10-jul 24-jul 7-aug 21-aug 4-sep 18-sep 2-okt 16-okt 30-oktAll ages Deaths < 2 Daily mean temperature Polynoom 6eSource: KNMI and RHCL, Genlias database.The strong effects <strong>of</strong> heat that were observed among infants and young children were causedmainly by high rates <strong>of</strong> gastrointestinal diseases. 13 This was first <strong>of</strong> all a consequence <strong>of</strong> highproportions <strong>of</strong> artificially fed children. The quality <strong>of</strong> foods such as milk and bread porridgedeteriorated at high temperatures; the quality <strong>of</strong> water, used to dilute milk or prepare other foods,was extremely bad as well during periods <strong>of</strong> heat and drought; and purity <strong>of</strong> feeding bottlesand teats could not be guaranteed. These factors played a role in the excessive vulnerability <strong>of</strong>infants in Limburg. These findings largely corroborate the conclusions <strong>of</strong> Van <strong>Poppel</strong> cum suisin relation to the impact <strong>of</strong> 1911 heat wave on mortality in the province <strong>of</strong> Zeeland. 14The heat wave <strong>of</strong> 1911 marked the last episode <strong>of</strong> extreme infant mortality in Limburg. Fromnow on (1912) infant mortality dropped in an unprecedented way (figure 1). The devastating1911 heat wave alarmed political and health care authorities in the province to intervene by amajor campaign to eliminate bottle feeding and other bad nursery practices. 1513Jaarverslag <strong>van</strong> de Gezondheidscommissie ingesteld voor de Gemeenten Baexem, Beegden, Grathem (1911) p.15. Verslag <strong>van</strong> de bevindingen en handelingen der Gezondheidsscommissie gezeteld te Gulpen, ingesteld voor devereeniging <strong>van</strong> gemeenten, omvattend Bocholtz, St. Geertruid, Gulpen (1911) p. 10.14Ekamper et al., ‘Heat waves and cold spells’, p. 73.15J.F.R. Philips, Gezondheidszorg in Limburg. Groei en acceptatie <strong>van</strong> de gezondheidsvoorzieningen 1850-1940 (Assen1261980).
ReferencesCapellmann, Carl (1877), Medicina pastoralis (Aquisgrani, 1877, 3 rd edition, 1893) 47. The Medicinapastoralis was translated into English, French, German, Spanish and had many editions from 1877until at least 1926.Ekamper, Peter, <strong>Frans</strong> <strong>van</strong> <strong>Poppel</strong>, Coen <strong>van</strong> Duin and Kees Mandemakers (2010), Heat waves and coldspells and their effect on mortality: An analysis <strong>of</strong> micro-data for the Netherlands in the 19 th and 20 thcenturies. Annales de Démographie Historique, pp. 55-104.Engelen, Theo (2009), Van 2 naar 16 miljoen mensen. Demografie <strong>van</strong> Nederland, 1800-nu, Amsterdam.Meurkens, P. (1984), Sociale verandering in het Oude Kempenland; demografie, economie en cultuur <strong>van</strong>een pre-industriële samenleving, Nijmegen.Philips, J.F.R. (1980), Gezondheidszorg in Limburg. Groei en acceptatie <strong>van</strong> de gezondheidsvoorzieningen1850-1940.<strong>Poppel</strong>, F. <strong>van</strong> (1992), Religion and health: Catholicism and regional mortality differences in 19 th centuryNetherlands. Social History <strong>of</strong> Medicine, 5(2) pp. 229-253.Rutten, Willibrord (1997), De vreselijkste aller harpijen. Pokkenepidemieën en pokkenbestrijding inNederland in de 18 e en 19 e eeuw: een sociaal-historische en historisch-demografische studie. AAG-Bijdragen 36, Wageningen.Wolleswinkel-<strong>van</strong> den Bosch, Judith (1998), The epidemiological transition in the Netherlands. Rotterdam.127
128
Biography <strong>of</strong> the authorsGeorge Alter is Director <strong>of</strong> the Interuniversity Con<strong>sort</strong>ium for Political and Social Research(ICPSR), Research Pr<strong>of</strong>essor at the Population Studies Center and Pr<strong>of</strong>essor <strong>of</strong> History atthe University <strong>of</strong> Michigan. His research grows out <strong>of</strong> interests in the history <strong>of</strong> the family,demography, and economic history, and recent projects have examined the effects <strong>of</strong> early lifeconditions on health in old age and new ways <strong>of</strong> describing fertility transitions.Jan Van Bavel (1971) is Pr<strong>of</strong>essor <strong>of</strong> demography at the Centre for Sociological Research<strong>of</strong> the University <strong>of</strong> Leuven in Belgium, where he received a PhD in the Social Sciences in2001. From 2005 to 2011, he headed the Interface Demography research unit at the VrijeUniversiteit Brussel. His research focuses on long term trends in reproductive behaviour inEurope.Tommy Bengtsson is Pr<strong>of</strong>essor in demography and economic history and Director <strong>of</strong>the Centre for Economic Demography at School <strong>of</strong> Economics and Management, LundUniversity. His historical studies concern the analyses <strong>of</strong> demographic research on short-termeconomic stress as well as how conditions in early life influence social mobility and longevity.His contemporary studies are on population ageing, determinants <strong>of</strong> fertility and mortalityand integration <strong>of</strong> immigrants. Bengtsson has authored and edited a number <strong>of</strong> books, one<strong>of</strong> which received a prize from American Sociological Association for best publication onAsia in 2005. He has also published a large number <strong>of</strong> articles on international well-knownjournals and is co-editor for a book series at MIT Press. His international publications includePopulation Ageing – A Threat to the Welfare State? The case <strong>of</strong> Sweden (Springer, 2010), LifeUnder Pressure (MIT Press, 2004 and 2009) and Kinship and Demographic Behaviour in thePast (Springer, 2008).Cameron Campbell is Pr<strong>of</strong>essor <strong>of</strong> Sociology at UCLA and Visiting Chair Pr<strong>of</strong>essor <strong>of</strong>History at Shanghai Jiaotong University. His research focuses on the relationships betweenkinship, inequality, and demographic behavior. Campbell has published extensively on family,population, and stratification in 18 th and 19 th century northeast China most notably the bookFate and Fortune in Rural China with James Lee.Shuang Chen is Assistant Pr<strong>of</strong>essor <strong>of</strong> History at the University <strong>of</strong> Iowa. Chen specializesin the social, economic and political history <strong>of</strong> late imperial and modern China. Her researchfocuses on interactions between wealth stratification, demographic processes and institutionalcontext under the setting <strong>of</strong> frontier settlement.Renzo Derosas is Associate Pr<strong>of</strong>essor <strong>of</strong> History at the Department <strong>of</strong> Economics, Ca’Foscari University <strong>of</strong> Venice. He was visiting scholar at UCLA, visiting pr<strong>of</strong>essor at VeniceInternational University, Keio University, Brown University and the University <strong>of</strong> Cambridge,Jean Monnet Fellow at the European University Institute, and by-fellow at Churchill College,Cambridge. His publications include the book ‘Religion and the Decline <strong>of</strong> Fertility in theWestern World’ (2006), co-edited with <strong>Frans</strong> <strong>van</strong> <strong>Poppel</strong>129
Peter Doorn is Director <strong>of</strong> Data Archiving and Networked Services (DANS). He studiedHuman Geography at Utrecht University and received his PhD there. He taught Computingfor Historians at Leiden University from 1985 to 1997. Later, he was the director <strong>of</strong> theNetherlands Historical Data Archive and head <strong>of</strong> department at the Netherlands Institutefor Scientific Information Services (NIWI). He was project leader <strong>of</strong> a number <strong>of</strong> historicalcensus digitization projects in the Netherlands.Martin Dribe is Pr<strong>of</strong>essor <strong>of</strong> Economic History, with special focus on demography at LundUniversity in Sweden. He has worked on economic demography in a historical perspectivecovering the period from mid-18 th century until today. His studies have dealt with migration,marriage, fertility, mortality and social mobility <strong>of</strong>ten using longitudinal micro level data, andhave been published in the leading journals <strong>of</strong> both demography and economic history.Antoinette Fauve-Chamoux is Pr<strong>of</strong>essor at Ecole des Hautes Etudes en Sciences Sociales(EHESS), Centres de Recherches Historiques/CNRS, Paris (France), where she teaches History<strong>of</strong> the Family. She was Researcher at the Polish Academy <strong>of</strong> Sciences, Warsaw, associatePr<strong>of</strong>essor at the University <strong>of</strong> Montréal, Canada, and honorary Pr<strong>of</strong>essor at the University <strong>of</strong>Salta, Argentina. She was editor-in-chief <strong>of</strong> the Revue de la Bibliothèque Nationale de France,Secretary General <strong>of</strong> the International Commission for Historical Demography (1985-2010),and for many years, co-chair <strong>of</strong> the Family/Demography network <strong>of</strong> the European SocialSciences History Conference (ESSHC) with <strong>Frans</strong> <strong>van</strong> <strong>Poppel</strong>. As social historian andhistorical demographer, she has edited fourteen books and published numerous essays on thehistory <strong>of</strong> the family, Malthusianism, domestic service, female migration and labour, genderstudies, social change in Europe, and comparative family transmission systems.Hilde L. Jåstad holds a position as associate pr<strong>of</strong>essor in history at Sogn and FjordaneUniversity College, Norway. Her research centers on historical demography, with a focus onthe late 19 th and early 20 th century. Family history is the nucleus <strong>of</strong> her research, stretchingfrom studies on infant mortality to research on household composition.Dirk J. <strong>van</strong> de Kaa was the Founding Director <strong>of</strong> <strong>NIDI</strong>. He served the institute until 1987when he accepted the post <strong>of</strong> Director <strong>of</strong> the Netherlands Institute for Ad<strong>van</strong>ced Study (NIAS)at Wassenaar. He taught demography at the University <strong>of</strong> Amsterdam (1978-1995) and wasVice-President <strong>of</strong> both the Royal Academy (KNAW) and the Netherlands Organization forScientific Research (NWO). He is widely known internationally; he most famous publicationbeing: Europe’s Second Demographic Transition (Washington, PRB, 1987)Hans Knippenberg is Pr<strong>of</strong>essor Emeritus <strong>of</strong> Political and Cultural Geography at theUniversity <strong>of</strong> Amsterdam. He wrote a lot <strong>of</strong> books and articles at the interface <strong>of</strong> geographyand history with special attention to the relationship <strong>of</strong> politics and religion, including Deeenwording <strong>van</strong> Nederland (The unification <strong>of</strong> the Netherlands) (with Ben de Pater), Dereligieuze kaart <strong>van</strong> Nederland (The religious map <strong>of</strong> the Netherlands) and The changingreligious landscape <strong>of</strong> Europe (with Reinhard Henkel eds.).130
Jan Kok (1959) studied social history at the Free University (Amsterdam). In 1991, hecompleted his dissertation on illegitimate births in the 19 th century. In 1993, he moved to theInternational Institute <strong>of</strong> Social History where he combined post-doc research with workingfor the Historical Sample <strong>of</strong> the Netherlands. He also held positions at the Virtual KnowledgeStudios for the Humanities and Social Sciences and the Center for Sociological Research atKU Leuven. In 2010, he was appointed pr<strong>of</strong>essor in Comparative History <strong>of</strong> the Life Courseat Radboud University Nijmegen.Pim Kooij (1945) studied history at the State University <strong>of</strong> Groningen. He also started hisacademic career there. In 1986 he completed his PhD thesis on the city <strong>of</strong> Groningen around1900. In 1988 he was appointed as pr<strong>of</strong>essor in regional history. From 1998-2010 he was atthe same time pr<strong>of</strong>essor in Economic and Social History at the State University <strong>of</strong> Groningenand pr<strong>of</strong>essor in Rural History at Wageningen University.James Z. Lee is the Chair Pr<strong>of</strong>essor and Dean <strong>of</strong> the School <strong>of</strong> Humanities and SocialScience at Hong Kong University <strong>of</strong> Science and Technology. Lee’s scholarship covers a widerange <strong>of</strong> disciplines, including Chinese history, Chinese society and economy, comparativedemography, sociology <strong>of</strong> populations, as well as historical sociology, genealogy and health.Marco H.D. <strong>van</strong> Leeuwen is Pr<strong>of</strong>essor <strong>of</strong> Historical Sociology at Utrecht University andhonorary research fellow at the International Institute <strong>of</strong> Social History. His field is socialinequality from 1500 to the present. His research on welfare deals with philanthropy, mutualaid, social insurance, and the history <strong>of</strong> risks. His research on social structure deals withresidential segregation, occupational change, and partner choice. He holds the ERC Ad<strong>van</strong>cedInvestigator Grant: Towards Open Societies? Trends, Variations and Driving Forces <strong>of</strong>Intergenerational Social Mobility in Europe over the Past Three Centuries. See www. TowardsOpen Societies.org.Mathias Lerch is a geographer and demographer, he is a scientific collaborator at the GenevaUniversity. He works especially on population and development (fertility and migration) inthe countries in transition, remittances, migration and mortality in Switzerland.Ron Lesthaeghe Emeritus Pr<strong>of</strong>essor <strong>of</strong> demography and social science research methods,Vrije Universiteit Brussels (VUB) and fellow <strong>of</strong> the Royal Flemish Academy <strong>of</strong> Arts andSciences <strong>of</strong> Belgium.Aart Liefbroer is Head <strong>of</strong> the Department <strong>of</strong> Social Demography at the NetherlandsInterdisciplinary Demographic Institute and Pr<strong>of</strong>essor <strong>of</strong> Young Adulthood and IntergenerationalTransmission at VU University Amsterdam. He is scientific coordinator <strong>of</strong> theGenerations and Gender Programme. His research focusses on understanding determinantsand consequences <strong>of</strong> family formation patterns in a comparative perspective.Bertie L.H. Lumey studied medicine at the Universities <strong>of</strong> Leiden and Amsterdam in theNetherlands, history and philosophy <strong>of</strong> science in Cambridge, England and epidemiology131
at Columbia University, New York. He has done much work on clarifying relations betweenearly life exposures and adult health, in particular through studies <strong>of</strong> men and women who atsome period in their lives experienced the Dutch famine <strong>of</strong> 1944-1945.Johan P. Mackenbach (1953) is Pr<strong>of</strong>essor <strong>of</strong> Public Health and Chair <strong>of</strong> the Department <strong>of</strong>Public Health at Erasmus MC in Rotterdam, the Netherlands. He is a member <strong>of</strong> the RoyalDutch Academy <strong>of</strong> Arts and Sciences and <strong>of</strong> the Academia Europaea, and <strong>of</strong> the Dutch HealthCouncil and Council for Public Health and Health Care.Kees Mandemakers (1953) is senior researcher at the International Institute <strong>of</strong> SocialHistory. In 1991 he started the Historical Sample <strong>of</strong> the Netherlands (HSN). He holds theendowed chair for Large Historical Databases at the Erasmus School <strong>of</strong> History, Culture andCommunication <strong>of</strong> the Erasmus University Rotterdam.Ineke Maas is Pr<strong>of</strong>essor at the Departments <strong>of</strong> Sociology <strong>of</strong> Utrecht University andVU University Amsterdam. Her main research interests are international and historicalcomparisons <strong>of</strong> intergenerational, career, and marital mobility. In addition, she has publishedamong others on the integration <strong>of</strong> immigrants, inequality <strong>of</strong> educational opportunities, andgender inequality. She collaborated with <strong>Frans</strong> <strong>van</strong> <strong>Poppel</strong> in the board <strong>of</strong> the HistoricalSample <strong>of</strong> the Netherlands.Michel Oris is Pr<strong>of</strong>essor at the University <strong>of</strong> Geneva since 2000, co-director <strong>of</strong> the NCCRLIVES (Overcoming Vulnerability. Life Course Perspectives), director <strong>of</strong> the Centre for theInterdisciplinary Study <strong>of</strong> Gerontology and Vulnerabilities, and president <strong>of</strong> the Société deDémographie Historique.Diego Ramiro-Fariñas is Tenured Scientist at the Institute <strong>of</strong> Economics, Geography andDemography at the Spanish National Research Council. He was Marie Curie Fellow at theCambridge Group for the History <strong>of</strong> Population and Social Structure at the University <strong>of</strong>Cambridge (UK) from 1998 to 2000. From 2002, he is head <strong>of</strong> the Department <strong>of</strong> Demographyand from 2010, elected member <strong>of</strong> the Historical Demography Committee at IUSSP. From2010 to 2012, he was vice-director at the Center for Human and Social Sciences in Spain andfrom 2011, elected President <strong>of</strong> the Iberian Association <strong>of</strong> Historical Demography.David Reher is Founder <strong>of</strong> the Asociación de Demografía Histórica (ADEH) and formerSecretary and Chair <strong>of</strong> the Historical Demography Committee <strong>of</strong> the IUSSP (1987-1996),Reher is currently Pr<strong>of</strong>essor at the Universidad Complutense de Madrid and Director <strong>of</strong> theGrupo de Estudios Población y Sociedad (GEPS). During his now long career in research,he has made significant contributions to the field <strong>of</strong> historical demography, family history,international migration, social and economic history, urban history and contemporarypopulation issues. In recent years he has published widely on the demographic transition andits implications throughout the world.Willibrord Rutten (1955) is senior researcher at the Sociaal Historisch Centrum voor Limburg,an institute affiliated to Maastricht University. He holds a PhD from Wageningen University.132
His thesis, published in 1997 as AAG-Bijdragen Vol. 36, examines the demographic impact<strong>of</strong> the implementation <strong>of</strong> infant smallpox vaccination in the Netherlands in the 19 th century.These last years the focus <strong>of</strong> his research has turned to the social history <strong>of</strong> industrial coalmining.Jona Schellekens is a demographer at the Department <strong>of</strong> Sociology and Anthropology,the Hebrew University <strong>of</strong> Jerusalem. He is particularly interested in models <strong>of</strong> long-termdemographic change. His latest publication, with <strong>Frans</strong> <strong>van</strong> <strong>Poppel</strong>, is Marital FertilityDecline in the Netherlands: Child Mortality, Real Wages and Unemployment, 1860-1939,Demography, 49 (2012), pp. 965-88.Simon Szreter is Pr<strong>of</strong>essor <strong>of</strong> History and Public Policy in the History Faculty, University<strong>of</strong> Cambridge and Fellow <strong>of</strong> St John’s College, Cambridge. He is a founding member <strong>of</strong> theHistory and Policy Network and Chief Editor <strong>of</strong> its electronic journal, www.historyandpolicy.org. His main fields <strong>of</strong> teaching and research are demographic, social and economic historyand the relationship between history, development and contemporary public policy.Gunnar Thorvaldsen is Pr<strong>of</strong>essor <strong>of</strong> History and Director <strong>of</strong> the Norwegian Historical DataCentre at the University <strong>of</strong> Tromsø. His publications are mainly on migration and infantmortality. He presently heads the effort to turn Norway’s censuses and church records into alongitudinal population register.Sjoerd de Vos studied mathematics and statistics at the University <strong>of</strong> Amsterdam. He islecturer in statistics and geographical information systems at the Department <strong>of</strong> Geography,Planning and International Development Studies <strong>of</strong> the same university. He wrote his PhDdissertation on compositional effects in human geography. His research and publicationsfocus on segregation and neighbourhood effects.Edward Anthony Wrigley was Lecturer in Geography, Cambridge, 1958-1974; Co-director<strong>of</strong> the Cambridge Group for the History <strong>of</strong> Population and Social Structure, 1974-1979;Pr<strong>of</strong>essor <strong>of</strong> Population Studies, LSE, 1979-1988; Senior Research Fellow at the All SoulsCollege, Oxford, 1988-94; Pr<strong>of</strong>essor <strong>of</strong> Economic History, Cambridge, 1994-1997; Master<strong>of</strong> Corpus Christi College, Cambridge, 1994-2000 and President <strong>of</strong> the British Academy,1997-2001. His publications include: Population history <strong>of</strong> England (with R.S. Sch<strong>of</strong>ield);Continuity, chance, and change; Poverty, progress, and population; Energy and the Englishindustrial revolution.Richard L. Zijdeman is a postdoctoral researcher at the Department <strong>of</strong> Sociology at UtrechtUniversity and an honorary research fellow at the School <strong>of</strong> Applied Social Science at StirlingUniversity. He has studied the influence <strong>of</strong> industrialization and other macro level processes onintergenerational status attainment and status attainment through marriage. He is co-developer<strong>of</strong> the HISCAM occupational stratification scales and currently focuses on explaining longterm trends in occupational gender stratification and female labour force participation.133
Forty years <strong>of</strong> groundbreaking research in historical demography did not go unnoticed. Atthe occasion <strong>of</strong> his formal retirement as Senior Researcher at the Netherlands InterdisciplinaryDemographic Institute (<strong>NIDI</strong>), in December 2012, this volume <strong>of</strong> short essays –a<strong>Liber</strong> <strong>Amicorum</strong>– is dedicated to <strong>Frans</strong> <strong>van</strong> <strong>Poppel</strong> and his scholarly work.From the 1970 s onwards, <strong>Frans</strong> <strong>van</strong> <strong>Poppel</strong> has been one <strong>of</strong> the leading academic figuresin the field <strong>of</strong> historical population studies, both at the national and international levels. Heproduced an abundance <strong>of</strong> influential publications in leading scholarly journals and a number<strong>of</strong> volumes dealing with central issues in historical demography. His 1992 doctoral dissertationTrouwen in Nederland. Een historisch-demografische analyse <strong>van</strong> de 19 e en vroeg-20 e eeuwhas been a classic on nuptiality ever since. Throughout his career, which includes a L.G.Rogier Chair at the History Faculty <strong>of</strong> Radboud University Nijmegen (1998-2001) and theKinship Demography Chair at the Department <strong>of</strong> Sociology at Utrecht University in 2012,<strong>Frans</strong> <strong>van</strong> <strong>Poppel</strong> applied and developed a strong interdisciplinary approach combiningelements from demography, sociology, epidemiology, geography, and history.The significance <strong>of</strong> <strong>Frans</strong> <strong>van</strong> <strong>Poppel</strong> as a leading historical demographer is made clear in thevarious contributions to this publication which focus on issues that are central to historicaldemography as a whole and <strong>Frans</strong> <strong>van</strong> <strong>Poppel</strong>’s work in particular: Data and methods, fertilityand nuptiality, and aging and mortality. The authors, all national and international academiccolleagues in the field <strong>of</strong> social and economic history and historical demography –directlyand indirectly– reflect on the influence <strong>of</strong> <strong>Frans</strong> <strong>van</strong> <strong>Poppel</strong> and his scientific work. They alsoreflect on their joint work, present new findings and insights, and propose new research andmethodologies.As stated by the director <strong>of</strong> <strong>NIDI</strong>, Leo <strong>van</strong> Wissen, in his preface: “Without a doubt this<strong>Liber</strong> <strong>Amicorum</strong> is not only a fine tribute to him, but also a welcome addition to demographiclibraries.”