2008 Almond Almanac - Almond Board of California
2008 Almond Almanac - Almond Board of California
2008 Almond Almanac - Almond Board of California
- No tags were found...

Create successful ePaper yourself
Turn your PDF publications into a flip-book with our unique Google optimized e-Paper software.
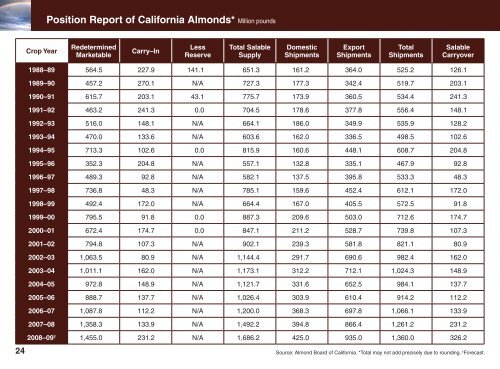
Position Report <strong>of</strong> <strong>California</strong> <strong>Almond</strong>s* Million poundsCrop YearRedeterminedMarketableCarry–InLessReserveTotal SalableSupplyDomesticShipmentsExportShipmentsTotalShipmentsSalableCarryover1988–89 564.5 227.9 141.1 651.3 161.2 364.0 525.2 126.11989–90 457.2 270.1 N/A 727.3 177.3 342.4 519.7 203.11990–91 615.7 203.1 43.1 775.7 173.9 360.5 534.4 241.31991–92 463.2 241.3 0.0 704.5 178.6 377.8 556.4 148.11992–93 516.0 148.1 N/A 664.1 186.0 349.9 535.9 128.21993–94 470.0 133.6 N/A 603.6 162.0 336.5 498.5 102.61994–95 713.3 102.6 0.0 815.9 160.6 448.1 608.7 204.81995–96 352.3 204.8 N/A 557.1 132.8 335.1 467.9 92.81996–97 489.3 92.8 N/A 582.1 137.5 395.8 533.3 48.31997–98 736.8 48.3 N/A 785.1 159.6 452.4 612.1 172.01998–99 492.4 172.0 N/A 664.4 167.0 405.5 572.5 91.81999–00 795.5 91.8 0.0 887.3 209.6 503.0 712.6 174.72000–01 672.4 174.7 0.0 847.1 211.2 528.7 739.8 107.32001–02 794.8 107.3 N/A 902.1 239.3 581.8 821.1 80.92002–03 1,063.5 80.9 N/A 1,144.4 291.7 690.6 982.4 162.02003–04 1,011.1 162.0 N/A 1,173.1 312.2 712.1 1,024.3 148.92004–05 972.8 148.9 N/A 1,121.7 331.6 652.5 984.1 137.72005–06 888.7 137.7 N/A 1,026.4 303.9 610.4 914.2 112.22006–07 1,087.8 112.2 N/A 1,200.0 368.3 697.8 1,066.1 133.92007–08 1,358.3 133.9 N/A 1,492.2 394.8 866.4 1,261.2 231.2<strong>2008</strong>–09 † 1,455.0 231.2 N/A 1,686.2 425.0 935.0 1,360.0 326.224 Source: <strong>Almond</strong> <strong>Board</strong> <strong>of</strong> <strong>California</strong>. *Total may not add precisely due to rounding. † Forecast.