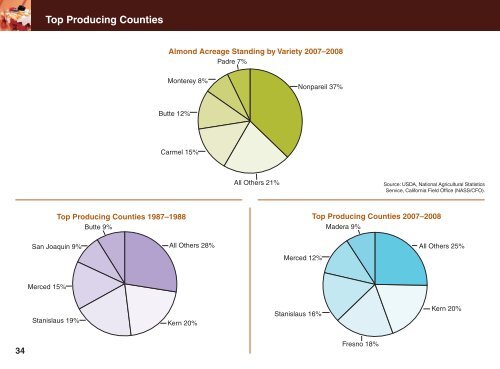
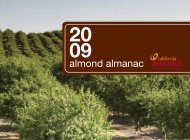
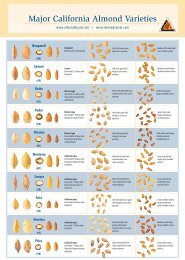
Top Producing Counties<strong>Almond</strong> Acreage Standing by Variety 2007–<strong>2008</strong>Padre 7%Monterey 8%Nonpareil 37%Butte 12%Carmel 15%All Others 21%Source: USDA, National Agricultural StatisticsService, <strong>California</strong> Field Office (NASS/CFO).Top Producing Counties 1987–1988Butte 9%Top Producing Counties 2007–<strong>2008</strong>Madera 9%San Joaquin 9%All Others 28%All Others 25%Merced 12%Merced 15%Stanislaus 19%Kern 20%Stanislaus 16%Kern 20%34Fresno 18%
<strong>Almond</strong> Acreage Planted by Variety*<strong>Almond</strong> <strong>Board</strong> <strong>of</strong> <strong>California</strong> | <strong>2008</strong> <strong>Almond</strong> <strong>Almanac</strong>Variety1998 &EarlierNon-Bearing Years Acres Standing in 20071999 2000 2001 2002 2003 2004 2005 2006 2007 BearingNon-BearingAldrich 5,226 895 891 617 369 410 1,424 987 680 246 9,852 1,894 11,745Butte 48,844 5,125 3,527 1,834 1,060 1,171 2,692 5,650 4,031 2,072 64,254 11,753 76,006Carmel 70,739 2,505 2,838 2,816 2,609 2,319 4,047 2,637 2,002 914 87,873 5,552 93,426Fritz 14,047 2,040 928 1,059 881 1,132 2,470 4,014 2,524 1,105 22,557 7,642 30,200Livingston 1,758 189 52 35 13 7 38 40 41 58 2,092 139 2,231Merced 882 — 3 12 — 6 — — — — 903 — 903Mission 15,039 339 263 52 47 43 52 5 25 2 15,834 32 15,867Monterey 19,273 3,854 1,980 2,046 1,466 2,114 5,983 8,377 7,064 2,136 36,716 17,578 54,293Neplus 3,210 73 132 4 16 15 20 32 6 17 3,470 55 3,525Nonpareil 147,398 12,153 8,023 8,007 6,946 7,840 15,721 17,430 12,870 4,698 206,088 34,998 241,086Padre 24,628 3,505 2,256 996 665 708 1,534 4,525 3,596 1,637 34,292 9,758 44,050Peerless 6,139 291 126 69 66 64 72 81 62 35 6,827 178 7,005Price 15,796 439 404 322 354 294 244 505 174 160 17,854 839 18,692Ruby 3,575 49 217 28 20 25 10 — 5 — 3,924 5 3,929Sonora 11,167 1,456 642 532 557 411 380 274 163 60 15,144 498 15,642Thompson 1,298 — — 1 4 — — — 9 — 15,834 9 1,312Wood Colony 4,268 598 508 341 166 264 403 583 577 165 6,549 1,324 7,873All Others 6,620 257 415 579 618 818 1,130 4,142 1,679 1,077 10,440 6,896 17,335TOTAL 399,907 33,767 23,200 19,348 15,857 17,639 36,220 49,281 35,486 14,381 545,970 99,147 645,118TotalSource: USDA, National Agricultural Statistics Service, <strong>California</strong> Field Office (NASS/CFO).Note: This detailed data by variety and year planted is voluntarily reported by almond growers and is maintained in the NASS/CFO database; therefore,these totals do not match the estimated almond acreage annually forecasted by NASS/CFO. * Totals may not add precisely due to rounding.35