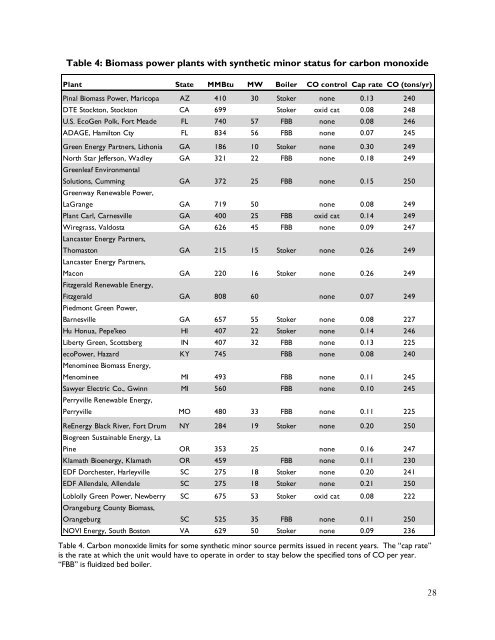
Table 4: Biomass power plants with synthetic minor status for carbon monoxidePlant State MMBtu MW Boiler CO control Cap rate CO (tons/yr)Pinal Biomass Power, Maricopa AZ 410 30 Stoker none 0.13 240DTE Stockton, Stockton CA 699 Stoker oxid cat 0.08 248U.S. EcoGen Polk, Fort Meade FL 740 57 FBB none 0.08 246ADAGE, Hamilton Cty FL 834 56 FBB none 0.07 245Green Energy Partners, Lithonia GA 186 10 Stoker none 0.30 249North Star Jefferson, Wadley GA 321 22 FBB none 0.18 249Greenleaf EnvironmentalSolutions, Cumming GA 372 25 FBB none 0.15 250Greenway Renewable Power,LaGrange GA 719 50 none 0.08 249Plant Carl, Carnesville GA 400 25 FBB oxid cat 0.14 249Wiregrass, Valdosta GA 626 45 FBB none 0.09 247Lancaster Energy Partners,Thomaston GA 215 15 Stoker none 0.26 249Lancaster Energy Partners,Macon GA 220 16 Stoker none 0.26 249Fitzgerald Renewable Energy,Fitzgerald GA 808 60 none 0.07 249Piedmont Green Power,Barnesville GA 657 55 Stoker none 0.08 227Hu Honua, Pepe'keo HI 407 22 Stoker none 0.14 246Liberty Green, Scottsberg IN 407 32 FBB none 0.13 225ecoPower, Hazard KY 745 FBB none 0.08 240Menominee Biomass Energy,Menominee MI 493 FBB none 0.11 245Sawyer Electric Co., Gwinn MI 560 FBB none 0.10 245Perryville Renewable Energy,Perryville MO 480 33 FBB none 0.11 225ReEnergy Black River, Fort Drum NY 284 19 Stoker none 0.20 250Biogreen Sustainable Energy, LaPine OR 353 25 none 0.16 247Klamath Bioenergy, Klamath OR 459 FBB none 0.11 230EDF Dorchester, Harleyville SC 275 18 Stoker none 0.20 241EDF Allendale, Allendale SC 275 18 Stoker none 0.21 250Loblolly Green Power, Newberry SC 675 53 Stoker oxid cat 0.08 222Orangeburg County Biomass,Orangeburg SC 525 35 FBB none 0.11 250NOVI Energy, South Boston VA 629 50 Stoker none 0.09 236Table 4. Carbon monoxide limits for some synthetic minor source permits issued in recent years. The “cap rate”is the rate at which the unit would have to operate in order to stay below the specified tons of CO per year.“FBB” is fluidized bed boiler.28
This problem is acknowledged in many bioenergy air permits, where it is common to see CO limitsset considerably higher than what is achievable when the boiler is operated under ideal conditions.Despite this, however, a great number of bioenergy facilities, claim synthetic minor status for COin order to avoid having to go through PSD permitting (Table 4).How realistic is it that relatively large facilities can keep their CO emissions at less than 250 tonsper year? The average allowable emission rate for the PSD facilities in our database (i.e., those thathad gone through a BACT analysis) was around 0.2 lb/MMBtu. At that emission rate, a relativelysmall boiler of 285 MMBtu (around18 MW) would have the potential to emit 250 tons of CO peryear, suggesting that most facilities, unless they are taking exceptional measures, are likely to bemajor sources for CO. Of the 88 permits in our database, 53 were capped at 250 tons or below forboth CO and NOx – and the majority of these had boilers larger than 285 MMBtu.In Table 4, the “cap rate” is the emission rate that the boiler would need to achieve in order to staybelow its CO limit (assuming that the boiler is the only source of CO at the facility; in fact, the 250ton cap is supposed to include all emissions at the facility, including emissions from fossil fuelsburned at startup, emergency generators, etc). The cap rate is derived by rearranging equation 1,above:Equation 2Only two of the facilities in Table 4 proposed to use oxidation catalysts 39 to reduce CO emissions,with the rest planning to use “good combustion practices.” According to the boiler maker Babcockand Wilcox, baseline CO emissions for stoker boilers (without an oxidation catalyst) are in therange of 0.1 - 0.3 lb/MMBtu when the boiler is being operated optimally at steady-state (i.e. notduring startup and shutdown). 40 Fluidized bed boilers may have lower CO emissions rates of 0.015- 0.15 lb/MMBtu at steady state 41 (the lowest permit limit found for an operating biomass boiler inEPA’s permit clearinghouse 42 is that for the 50 MW Schiller Station bioenergy facility inPortsmouth, New Hampshire, which has a limit of 0.1 lb/MMBtu for a circulating fluidizedbed boiler).It seems unlikely that all of the facilities in Table 4 would be capable of meeting the cap raterequired to actually stay below 250 tons per year, given that in order to do so, many would have toconsistently operate at rates even lower than 0.1 lb/MMBtu (including during periods of startup and39An oxidation catalyst converts CO to CO 2 and thus reduces CO emissions. The chemical reaction is speeded by a metalcatalyst, but this technology has been rarely proposed for use in biomass boilers, because installing and operating CO catalysts isexpensive and because the catalyst can be fouled and deactivated by substances contained in the ash. .40Bowman, J., et al. Biomass combustion technologies: A comparison of a biomass 50MW modern stoker fired system and abubbling fluidized bed system. Presented at POWER-GEN International, December 8-10, 2009. Las Vegas, NV.41 Ibid.42EPA’s BACT Clearinghouse (http://cfpub.epa.gov/rblc/)contains permit limits for a number of facilities, but it is notcomprehensive and does not contain information on recently issued permits.29
- Page 1 and 2: Trees, Trash, and Toxics:How Biomas
- Page 8 and 9: The fix: EPA should regulate bioene
- Page 10 and 11: To test whether the industry emissi
- Page 12 and 13: Verso Bucksport, Bucksport, MEBurge
- Page 14 and 15: cycle technologies is $59 - $86, de
- Page 16 and 17: The physical reasons why bioenergy
- Page 18 and 19: All three facilities went through a
- Page 20 and 21: supposed to use the technology that
- Page 22 and 23: Bioenergy emissions of criteria pol
- Page 24 and 25: CO 2 and conventional air pollutant
- Page 26 and 27: are federally and practically enfor
- Page 30 and 31: shutdown, when emissions can increa
- Page 32 and 33: Table 5: Biomass power plants with
- Page 34 and 35: Nitrogen oxides (tons per year)Figu
- Page 36 and 37: PM 2.5 , including condensable PM,
- Page 38 and 39: Synthetic minor facilities tend to
- Page 40 and 41: material classified as a commercial
- Page 42 and 43: is regulated under the boiler rule,
- Page 44 and 45: As an incinerator, the facility wou
- Page 46 and 47: Table 8: Industry data helps biomas
- Page 48 and 49: permitting authorities, especially
- Page 50 and 51: La Pine, Oregon, used the NCASI fac
- Page 52 and 53: Connecticut, the permit only requir
- Page 54 and 55: then the load is considered to 100%
- Page 56 and 57: elatively high filterable PM standa
- Page 58 and 59: EPA rules compare contaminant conce
- Page 60 and 61: commodity” - therefore, the facil
- Page 62 and 63: emove obviously contaminated materi
- Page 64 and 65: developmental and reproductive effe
- Page 66 and 67: The Evergreen plant is located in t
- Page 68 and 69: Loophole 4: Most biomass plants hav
- Page 70 and 71: Summary case studies: the emerging
- Page 72 and 73: emission limits for HAPs, but does
- Page 74 and 75: company was permitted to use non-EP
- Page 76 and 77: Verso Bucksport, Bucksport, MEWhat:
- Page 78 and 79:
Biogreen Sustainable Energy, La Pin
- Page 80 and 81:
iomass from land clearing operation