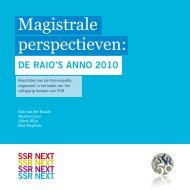
Table 8: Industry data helps biomass plants lowball projected emissions of air toxicsHazardous Air PollutantAP-42 factor(lb/MMBtu)NCASI factor(lb/MMBtu)NCASI as% of AP-42Total lbAP-42Total lbNCASIACETALDEHYDE 8.300E-04 1.90E-04 22.9% 1,352.4 309.6ACETONE 1.900E-04 2.20E-04 115.8% 309.6 358.5ACROLEIN 4.000E-03 7.80E-05 * 2.0% 6,517.4 127.1ANTIMONY 7.900E-06 4.20E-07 5.3% 12.9 0.7ARSENIC 2.200E-05 1.00E-06 4.5% 35.8 1.6BARIUM 1.700E-04 1.60E-04 94.1% 277.0 260.7BENZALDEHYDE 8.500E-07 3.00E-06 352.9% 1.4 4.9BENZENE 4.200E-03 3.30E-03 78.6% 6,843.3 5,376.9BERYLLIUM 1.100E-06 1.90E-06 172.7% 1.8 3.1BIS(2-ETHYLHEXYL)PHTHALATE 4.700E-08 4.70E-08 100.0% 0.1 0.1CADMIUM 4.100E-06 1.90E-06 46.3% 6.7 3.1CARBON TETRACHLORIDE 4.500E-05 8.90E-07 * 2.0% 73.3 1.5CHLOROBENZENE 3.300E-05 1.70E-05 51.5% 53.8 27.7CHLOROFORM 2.800E-05 3.10E-05 110.7% 45.6 50.5CHROMIUM 2.100E-05 6.24E-07 3.0% 34.2 1.0COBALT 6.500E-06 1.90E-07 2.9% 10.6 0.3COPPER 4.900E-05 5.50E-06 11.2% 79.8 9.0DICHLOROMETHANE 2.900E-04 5.40E-04 186.2% 472.5 879.9ETHYL BENZENE 3.100E-05 6.80E-06 * 21.9% 50.5 11.1FORMALDEHYDE 4.400E-03 1.30E-03 29.5% 7,169.2 2,118.2HYDROCHLORIC ACID 1.900E-02 6.70E-04 3.5% 30,957.8 1,091.7LEAD 4.800E-05 5.80E-06 12.1% 78.2 9.5MANGANESE 1.600E-03 1.50E-04 9.4% 2,607.0 244.4MERCURY 3.500E-06 9.90E-07 28.3% 5.7 1.6METHYL ETHYL KETONE 5.400E-06 9.10E-06 168.5% 8.8 14.8NAPHTHALENE 9.700E-05 1.60E-04 164.9% 158.0 260.7NICKEL 3.300E-05 2.90E-06 8.8% 53.8 4.7PENTACHLOROPHENOL 5.100E-08 4.60E-08 90.2% 0.1 0.1PHENOL 5.100E-05 1.40E-05 27.5% 83.1 22.8SELENIUM 2.800E-06 3.00E-06 107.1% 4.6 4.9STYRENE 1.900E-03 6.40E-04 33.7% 3,095.8 1,042.8TOLUENE 9.200E-04 2.90E-05 3.2% 1,499.0 47.3VINYL CHLORIDE 1.800E-05 1.80E-05 100.0% 29.3 29.3Total tonsAP-42Total tonsNCASI31.0 6.2Table 8. HAPs emissions based on potential to emit for a 186 MMBtu boiler. Shaded rows represent air toxicswhere the emissions factor from NCASI is lower than the EPA factor (data from EPA’s AP-42, and NCASI Bulletin858; NCASI emissions factors marked with asterisks are median values, for instances when mean is not presented).46
Whereas EPA’s AP-42 emissions factors are based on data that can be publically reviewed, NCASI’semission factors, and the data upon which they are based, are only available to industry partnerswho pay thousands of dollars per year for membership in NCASI. However, we gained access toNCASI’s emissions factors because the publication that contains the information, NCASI TechnicalBulletin #858, has been reproduced in air permit applications that we have reviewed. Thispublication contains the emission factors but none of the underlying data upon which they arebased.As shown in Table 8, NCASI’s industry-suppliedemission factors tend to be much lower than EPA’sAP-42 factors (shaded rows represent air toxicswhere the emissions factor from NCASI is lower thanCompanies use industry-providedemissions factors to avoid regulationas major sources for air toxicsthe EPA factor). There are only ten instances out of the 33 HAPs shown in the table where NCASIfactors are the same or greater than the EPA factors, and for the HAPs with the highest AP-42factors (acrolein, benzene, formaldehyde, hydrochloric acid, manganese, and styrene, dark shading)the NCASI factors are consistently and significantly lower – for instance, NCASI’s emissions factorfor acrolein is just 2% of the EPA emission factor.The fact that NCASI emissions factors are so much lower than EPA’s makes a real difference whencalculating total HAPs emissions from a bioenergy facility. For example, applying the EPA andNCASI emission factors to the 186 MMBtu boiler at the proposed 11.5 MW Green EnergyResource Center in Lithonia, Georgia produces dramatically different estimates of total tonsof annual HAPs emissions. Estimating HAPs emissions using the EPA-sanctioned factors, the plantwould emit 31tons of HAPs a year, making it a major source and subject to regulation under themajor source boiler rule, whereas under the NCASI factors, the total is 6.2 tons. Because the airpermitting branch of the Georgia Environmental Protection Division uncritically accepts and usesNCASI emissions factors with no independent evaluation, the plant in Lithonia was permitted as anarea source and is subject to no emission limits for air toxics. This was the case for every biomasspower plant permit in Georgia that we have reviewed, with the exception of two facilities. 79While EPA has mostly avoided getting drawn into questions about whether facilities should be usingnon-EPA sanctioned emissions factors for HAPs, the agency has occasionally commented. In theirletter to the Hawaii air permitting authority on the 23.8 MW (gross) Hu Honua coal tobiomass conversion in Pepe’ekeo, Hawaii, 80 EPA Region 9 stated that it was not acceptableto use non-AP-42 emission factors without justifying why these factors were better than the EPAfactors. However, the use of these non-EPA sanctioned factors is widely accepted by state79The Georgia biomass plants we reviewed that have been given area source status for HAPs are: 40 MW Graphic Packaging,Macon; 10 MW Green Energy Partners. Lithonia; 22 MW North Star Jefferson, Wadley ; 25 MW Greenleaf EnvironmentalSolutions, Cumming; 49.8 MW Greenway Renewable Power, LaGrange; 45 MW Wiregrass, Valdosta; 100 MW WarrenCounty Biomass, Warrenton; 15 MW Lancaster Energy Partners, Thomaston; 16 MW Lancaster Energy Partners, Macon; 60MW Fitzgerald Renewable Energy, Fitzgerald; 54.5 MW Piedmont Green Power, Barnesville. The two plants permitted asmajor sources were: 110 MW Yellow Pine Energy, Fort Gaines; 25 MW Plant Carl, Carnesville (poultry-waste burner).80Letter from Gerardo C. Rios, Chief, Permits office EPA Region IX, to Wilfred K. Nagamine, Manager, Clean Air Branch,Hawaii Department of Health. June 30, 2011.47
- Page 1 and 2: Trees, Trash, and Toxics:How Biomas
- Page 8 and 9: The fix: EPA should regulate bioene
- Page 10 and 11: To test whether the industry emissi
- Page 12 and 13: Verso Bucksport, Bucksport, MEBurge
- Page 14 and 15: cycle technologies is $59 - $86, de
- Page 16 and 17: The physical reasons why bioenergy
- Page 18 and 19: All three facilities went through a
- Page 20 and 21: supposed to use the technology that
- Page 22 and 23: Bioenergy emissions of criteria pol
- Page 24 and 25: CO 2 and conventional air pollutant
- Page 26 and 27: are federally and practically enfor
- Page 28 and 29: Table 4: Biomass power plants with
- Page 30 and 31: shutdown, when emissions can increa
- Page 32 and 33: Table 5: Biomass power plants with
- Page 34 and 35: Nitrogen oxides (tons per year)Figu
- Page 36 and 37: PM 2.5 , including condensable PM,
- Page 38 and 39: Synthetic minor facilities tend to
- Page 40 and 41: material classified as a commercial
- Page 42 and 43: is regulated under the boiler rule,
- Page 44 and 45: As an incinerator, the facility wou
- Page 48 and 49: permitting authorities, especially
- Page 50 and 51: La Pine, Oregon, used the NCASI fac
- Page 52 and 53: Connecticut, the permit only requir
- Page 54 and 55: then the load is considered to 100%
- Page 56 and 57: elatively high filterable PM standa
- Page 58 and 59: EPA rules compare contaminant conce
- Page 60 and 61: commodity” - therefore, the facil
- Page 62 and 63: emove obviously contaminated materi
- Page 64 and 65: developmental and reproductive effe
- Page 66 and 67: The Evergreen plant is located in t
- Page 68 and 69: Loophole 4: Most biomass plants hav
- Page 70 and 71: Summary case studies: the emerging
- Page 72 and 73: emission limits for HAPs, but does
- Page 74 and 75: company was permitted to use non-EP
- Page 76 and 77: Verso Bucksport, Bucksport, MEWhat:
- Page 78 and 79: Biogreen Sustainable Energy, La Pin
- Page 80 and 81: iomass from land clearing operation