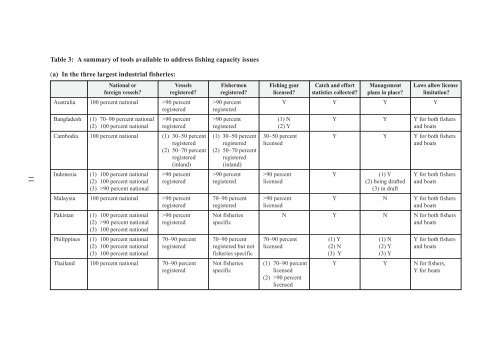
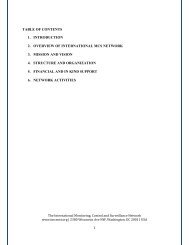
Percent1009080706050403020100Australia Bangladesh Cambodia Pakistan Philipp<strong>in</strong>es Sri Lanka Thail<strong>and</strong> Viet NamIndustrialSmall-scaleInl<strong>and</strong>Figure 1: The percentage of the three largest <strong>in</strong>dustrial, small-scale <strong>and</strong> <strong>in</strong>l<strong>and</strong> fisheries <strong>in</strong>each country where <strong>fish<strong>in</strong>g</strong> <strong>capacity</strong> has been reported to have been assessedbeen paid to the assessment of <strong>fish<strong>in</strong>g</strong> <strong>capacity</strong> <strong>in</strong> <strong>in</strong>l<strong>and</strong> fisheries. Therefore, the situation withregard measur<strong>in</strong>g <strong>fish<strong>in</strong>g</strong> <strong>capacity</strong> <strong>in</strong> <strong>in</strong>dustrial fisheries does not seem to have changed significantlys<strong>in</strong>ce 2002, although there seems to have been <strong>in</strong> <strong>in</strong>crease <strong>in</strong> the number of small-scale fisherieswhere <strong>fish<strong>in</strong>g</strong> <strong>capacity</strong> is be<strong>in</strong>g measured 5 . The proportion of small-scale fisheries for which <strong>fish<strong>in</strong>g</strong><strong>capacity</strong> has been assessed is, however, still only about 50 percent, compared with about 62 percentfor <strong>in</strong>dustrial fisheries but only 33 percent for <strong>in</strong>l<strong>and</strong> fisheries.3.4 What are the legislative <strong>and</strong> <strong>in</strong>stitutional barriers to address<strong>in</strong>g <strong>fish<strong>in</strong>g</strong> <strong>capacity</strong> <strong>in</strong>the region?A review of fisheries legislation <strong>in</strong> the region <strong>in</strong> 2006 (M<strong>org</strong>an, 2006) showed that 56 percent ofcountries of the region did not have the legislative ability with<strong>in</strong> their national fisheries laws to limitthe number of licenses issued to fishers <strong>and</strong>/or vessels. However, of the ten countries that respondedto the current questionnaire, only two responded that they did not have such legislative powers forboth <strong>in</strong>dustrial <strong>and</strong> small-scale, artisanal fisheries (Table 3a <strong>and</strong> 3b). This discrepancy may be dueto the extent of adm<strong>in</strong>istrative powers with<strong>in</strong> national legislation 6 . The ability to limit licenses iscritical to address<strong>in</strong>g <strong>capacity</strong> issues <strong>and</strong> countries that do not have these powers should beencouraged to review their relevant legislation.Management plans, which often have a formal legal status 7 , (see below), are becom<strong>in</strong>g <strong>in</strong>creas<strong>in</strong>glycommon <strong>in</strong> most countries. Of the ten respondents, eight reported that they had developed<strong>management</strong> plans for their major <strong>in</strong>dustrial fisheries (Table 3a). However, <strong>management</strong> plans aremuch less common for small-scale fisheries (Table 3b) with only four countries report<strong>in</strong>g that theyhave these <strong>in</strong> place for their largest small-scale, artisanal fisheries. This contrasts with responses <strong>in</strong>2003, when only two countries reported that they had developed <strong>management</strong> plans for any fishery.It is, however, important that <strong>management</strong> plans for any fishery <strong>in</strong> the region are actually used toguide implementation of <strong>management</strong> measures <strong>and</strong> are widely dissem<strong>in</strong>ated. In this regard, it isencourag<strong>in</strong>g that, of the fisheries that were reported as hav<strong>in</strong>g <strong>management</strong> plans, 86 percent ofthese <strong>management</strong> plans were reported as hav<strong>in</strong>g a formal legal status although <strong>in</strong> 35 percent of5Although this is based on a limited sample of countries.6Ch<strong>in</strong>a <strong>and</strong> India also reported at the workshop that they have the power, at either national or state (prov<strong>in</strong>cial) level to limitlicence numbers <strong>and</strong> have used these powers <strong>in</strong> <strong>capacity</strong> <strong>management</strong> programmes.7S<strong>in</strong>ce some countries are still us<strong>in</strong>g fisheries legislation which dates back more than thirty years, revis<strong>in</strong>g <strong>and</strong> reform<strong>in</strong>g thelegislation is an essential accompany<strong>in</strong>g activity to <strong>in</strong>troduction of <strong>management</strong> measures.10
Table 3: A summary of tools available to address <strong>fish<strong>in</strong>g</strong> <strong>capacity</strong> issues11(a) In the three largest <strong>in</strong>dustrial fisheries:National or Vessels Fishermen <strong>Fish<strong>in</strong>g</strong> gear Catch <strong>and</strong> effort Management Laws allow licenseforeign vessels? registered? registered? licensed? statistics collected? plans <strong>in</strong> place? limitation?Australia 100 percent national >90 percent >90 percent Y Y Y Yregistered registeredBangladesh (1) 70–90 percent national >90 percent >90 percent (1) N Y Y Y for both fishers(2) 100 percent national registered registered (2) Y <strong>and</strong> boatsCambodia 100 percent national (1) 30–50 percent (1) 30–50 percent 30–50 percent Y Y Y for both fishersregistered registered licensed <strong>and</strong> boats(2) 50–70 percent (2) 50–70 percentregistered registered(<strong>in</strong>l<strong>and</strong>)(<strong>in</strong>l<strong>and</strong>)Indonesia (1) 100 percent national >90 percent >90 percent >90 percent Y (1) Y Y for both fishers(2) 100 percent national registered registered licensed (2) be<strong>in</strong>g drafted <strong>and</strong> boats(3) >90 percent national (3) <strong>in</strong> draftMalaysia 100 percent national >90 percent 70–90 percent >90 percent Y N Y for both fishersregistered registered licensed <strong>and</strong> boatsPakistan (1) 100 percent national >90 percent Not fisheries N Y N N for both fishers(2) >90 percent national registered specific <strong>and</strong> boats(3) 100 percent nationalPhilipp<strong>in</strong>es (1) 100 percent national 70–90 percent 70–90 percent 70–90 percent (1) Y (1) N Y for both fishers(2) 100 percent national registered registered but not licensed (2) N (2) Y <strong>and</strong> boats(3) 100 percent national fisheries specific (3) Y (3) YThail<strong>and</strong> 100 percent national 70–90 percent Not fisheries (1) 70–90 percent Y Y N for fishers,registered specific licensed Y for boats(2) >90 percentlicensed