Download Lecture Notes for chapters 8 and 9
Download Lecture Notes for chapters 8 and 9
Download Lecture Notes for chapters 8 and 9

You also want an ePaper? Increase the reach of your titles
YUMPU automatically turns print PDFs into web optimized ePapers that Google loves.
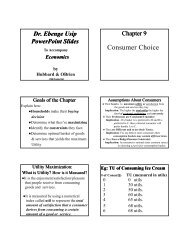
Sampling Distribution & Confidence IntervalA Normal DistributionP(X > 225) = .382 ?X ~ N (µ = 211, σ = 46)Example: Consider the distribution of serumcholesterol levels <strong>for</strong> 40- to 70-year-oldmales living in community A has a mean of211 mg/100 ml, <strong>and</strong> the st<strong>and</strong>ard deviationof 46 mg/100 ml. If an individual is selectedfrom this population, what is the probabilitythat his/her serum cholesterol level is higherthan 225?211 2250 .30x225 − 211z =46z= .30.38212Inferential StatisticsStatistical Inference1. Type of Inference:• Estimation• Hypothesis Testing2. Purpose• Make Decisionsabout PopulationCharacteristicsPopulation?34Inference ProcessEstimatorsIdentifyPopulationDecision&ConclusionFindRepresentativeSampleSampleStatisticEstimates& Tests5Statistics Used to Estimate Population ParametersStatisticsParameters• Sample Mean, x µ population mean• Sample Variance, s 2 σ 2 population variance• Sample Proportion, pˆ…p population proportion6CI -1
Sampling Distribution & Confidence IntervalProbability Related to MeanSampling DistributionTheoretical Probability Distributionof the Sample Statistic.What is the Shape of this distribution?What are the values of the parameterssuch as mean <strong>and</strong> st<strong>and</strong>ard deviation?7Example: Consider the distribution of serumcholesterol levels <strong>for</strong> 40- to 70-year-oldmales living in community A has a mean of211 mg/100 ml, <strong>and</strong> the st<strong>and</strong>ard deviationof 46 mg/100 ml. If a r<strong>and</strong>om sample of100 individuals is taken from this population,what is the probability that the averageserum cholesterol level of these 100individuals is higher than 225?8P(X > 225) = ?X → ? ( µ x = ?, σ x = ?)What is probability thatmean of the sample isgreater than 225?225What is the sampling distribution of sample mean??x9Sampling Distribution of TheMeanIf a r<strong>and</strong>om sample is taken from apopulation that has a mean µ <strong>and</strong> a st<strong>and</strong>arddeviation σ, the sampling distribution of thesample mean, x, will have a mean that is thesame as the population mean, <strong>and</strong> will havea st<strong>and</strong>ard deviation that is equal to thest<strong>and</strong>ard deviation of the population dividedby the square root of the sample size.σµ x =µσx=n10Sampling DistributionSt<strong>and</strong>ard Error of MeanPopulationDistributionSamplingDistribution ofMean(Sample size n=25)µ = 8µ = 8σ = 2x2σ x==0.4425x1. Formulaσx= σ ≈nsn2. St<strong>and</strong>ard Deviation of the samplingdistribution of the Sample Means,⎯X3. Less Than Pop. St<strong>and</strong>ard Deviationσn
Sampling Distribution & Confidence IntervalDistribution ShapeWhat is the shape of the samplingdistribution of mean?A theorem of sampling distribution of mean:If the population to be sampled is normallydistributed then the sampling distribution ofmean would be normally distributed.13P(X > 225) = ?Cholesterol Level hasa mean 211, s.d. 46.Parameters of the µx= µ = 211sampling distribution σ 46of the mean: σx= = = 4.6n 100If the population is normally distributed, thesampling distribution of the mean is normallydistributed.X ~ N(µ x= 211, σx= 4.6)n = 100211x14 Central Limit TheoremCentral Limit TheoremWhat if the population sampledis not normally distributed?If a relative large r<strong>and</strong>om sample is takenfrom a population that has a mean µ <strong>and</strong> ast<strong>and</strong>ard deviation σ, regardless of thedistribution of the population, thedistribution of the sample means isapproximately normal withµ µσx =xσ=n1516Assamplesize getslargeenough(n ≥ 30) ...Central Limit Theoremσσx=nsamplingdistributionbecomesalmostnormal.µ µXx =17Sampling fromNon-Normal PopulationsPopulation Distributionσ = 10µ = 50 XMeanµ x =µSampling Distribution ?St<strong>and</strong>ard Errorn = 4σσx=σ X = 5nµ X- = 50X18CI -3
7060504030201002001000Std. Dev = 8.88Mean = 20.3N = 400.00Std. Dev = 2.23Mean = 19.84N = 400.007060504030201002001000Std. Dev = 5.40Mean = 19.4N = 400.00Std. Dev = 1.64Mean = 19.75N = 400.001008060402003002001000Std. Dev = 4.32Mean = 19.9N = 400.00Std. Dev = 1.20Mean = 19.81N = 400.00Sampling Distribution & Confidence IntervalSampling fromNon-Normal PopulationsPopulation Distributionσ = 10µ = 50 XMeanµ x = µSampling Distribution ?St<strong>and</strong>ard Errorn = 30σσ X = 1.8σx=nµ =50 XX19A R<strong>and</strong>om Sample from Population120100806040200110.0100.090.080.070.060.050.040.030.020.010.00.0R<strong>and</strong>om Sample of Size 400 from PopulationStd. Dev = 12.92Mean = 20.7N = 400.00Population mean = 19.9, st<strong>and</strong>ard deviation = 12.620Simulated Sampling Distribution of MeansProbability Related to Mean77.073.069.065.061.057.053.049.045.041.037.033.029.025.021.017.013.09.05.01.0SIZE277.0073.0069.0065.0061.0057.0053.0049.0045.0041.0037.0033.0029.0025.0021.0017.0013.009.005.001.00SIZE25n=2SIZE4n=25SIZE5077.073.069.065.061.057.053.049.045.041.037.033.029.025.021.017.013.09.05.01.077.0073.0069.0065.0061.0057.0053.0049.0045.0041.0037.0033.0029.0025.0021.0017.0013.009.005.001.00n=4SIZE10n=50SIZE10077.073.069.065.061.057.053.049.045.041.037.033.029.025.021.017.013.09.05.01.077.0073.0069.0065.0061.0057.0053.0049.0045.0041.0037.0033.0029.0025.0021.0017.0013.009.005.001.00n=10n=100Example: Consider the distribution of serumcholesterol levels <strong>for</strong> 40- to 70-year-oldmales living in community A has a mean of211 mg/100 ml, <strong>and</strong> the st<strong>and</strong>ard deviationof 46 mg/100 ml. If a r<strong>and</strong>om sample of100 individuals is taken from this population,what is the probability that the averageserum cholesterol level of these 100individuals is higher than 225?2122P(X > 225) = ?Cholesterol Level hasa mean 211, s.d. 46.X → N ( µ x = 211, σ x = 4.6)n = 100Introduction to Estimation211 225P(X > 225) = P(Z > 3.04)= 0.0010 3.04x225 − 2114.6z= 3.04Confidence Intervals&Sample Size.0012324CI -4
Sampling Distribution & Confidence IntervalDisadvantage of Point EstimationEstimation1. Provides Single ValueBased on Observations from 1 Sample.* Sample Mean⎯X = 98 Is a Point Estimateof Unknown Population Mean.2. Gives No In<strong>for</strong>mation about How Close ValueIs to the Unknown Population ParameterWhich of the following statistics do you prefer?a. 32%b. 32% with a margin of error 3%25You’re interested in finding theaverage body temperature ofhealthy adults in NortheasternOhio (the population). Whatwould you do?How can we estimate this averagewith a measure of reliability?98 ± 1 F° 98 ± .5 F° 98 ± .2 F°26Sampling ErrorInterval EstimationMargin of Error Gives In<strong>for</strong>mationabout How Close Value Is to theUnknown Population Parameter.µxSample statistic(point estimate)27Sampling Error = | µ –x |28Key Elements ofInterval EstimationConfidence Level: : A probability that thepopulation parameter falls somewherewithin the interval.Sample statisticConfidence(point estimate)intervalSampling Distribution of theMeanµσ x_⎯XConfidenceConfidencelimit (lower)limit (upper)x ± Margin of Error98 ± 1 F°29The sampling distribution is normal whensampled from normally distributed populationor having a relatively large sample.30CI -5
Sampling Distribution & Confidence IntervalSampling Distribution of theMean.025.95µσ x_µ - ?σ ⎯x µ + ?σ?⎯xWithin how many st<strong>and</strong>ard deviationsof the mean will have 95% of thesampling distribution?.02531⎯XA Special Notationz α = the z score that the proportion ofthe st<strong>and</strong>ard normal distribution to theright of it is α.Z .05 .06 .07z .025 = ? 1.96z .010 = ?0 z .025.0251.8 .032 .031 .0311.9 .026 .025 .0242.0 .020 .020 .0192.1 .016 .015 .01532The Confidence IntervalConfidence Levelσ_x1.96 = z .025α/2 α/2 = .0251- α = .95⎯Xµ xµ - 1.96σ ⎯xµ + 1.96σ ⎯xConfidence Interval =>95% SampleMeansx - 1.96σ ⎯xx + 1.96σ ⎯x33 Confidence Interval <strong>for</strong> Mean(σ Known)• (1-α)·100% Confidence Interval Estimate<strong>for</strong> mean of a normal populationσσ( X−Zα/ 2⋅,X+Zα/2⋅)nnorσMargin of ErrorX±Zα/2⋅n“σ Known” may mean that we have verygood estimate of σ.It is not practical to assume that we know σ. 34 Confidence Interval of Mean(σ unKnown <strong>and</strong> n ≥ 30)• (1-α)·100% Confidence IntervalEstimate <strong>for</strong> mean of a population whensample size is relative largess( X−Zα/2⋅,X+Zα/2⋅)nnorX± Zα /⋅2sn35The Confidence Intervalµ - 1.96σ ⎯xConfidence Interval =>95% Samplesµxσ x_µ + 1.96σ ⎯x95% ConfidenceIntervalx - 1.96σ ⎯x x + 1.96σ ⎯x36⎯XCI -6
Sampling Distribution & Confidence IntervalThe Confidence Interval2.5%95% Samplesµσ x_2.5%⎯X95 % ofintervalscontain µ.5% do not.1.Data DispersionMeasured by σFactors AffectingInterval Widthσσ−zα/2⋅,X+zα⋅)nn( X /22.Sample SizeAffects st<strong>and</strong>ard error: σ =x3.Level of Confidence (1 - α)Affects Z α/2σn3738µ - 2.58σ x µ - 1.65σ xµ-1.96σ xSize of Intervalµ90% Samples95% Samples99% Samplesσ x_µ + 1.65σ x µ + 2.58σ xµ+1.96σ x39⎯XEstimation ExampleMean (σ Known)The average weight of a r<strong>and</strong>om sample of n = 25subjects is⎯X = 140. Set up a 95% confidenceinterval estimate <strong>for</strong> µ if σ = 10.(Assume Normal population.)1−α=.95,α=.05,α=.025,z1.96.2α=2σσσ(X−Zα/ X2⋅±Zα,/2X⋅+Zα/ 2⋅)nnn101010(140140−1.96±1.96⋅⋅,140⇒140+1.96±3.92⋅)252525(136.08,⇒(136.08,143.92)143.92)or140±3.9240InterpretationWe can be 95% confident that thepopulation mean is in (136.08, 143.92).We can be 95% confident that themaximum sampling error using thisinterval estimate <strong>for</strong> estimating mean iswithin 3.92.41 Confidence Interval of Mean(σ unKnown <strong>and</strong> n ≥ 30)• (1-α)·100% Confidence IntervalEstimate <strong>for</strong> mean of a population whensample size is relative largess( X−Zα/2⋅,X+Zα/2⋅)nnorX± Zα /⋅2sn42CI -7
Sampling Distribution & Confidence IntervalThinking ChallengeExample: A city uses a certain noiseindex to monitor the noise pollutionat a certain area of the city. Ar<strong>and</strong>om sample of 100 observationsfrom r<strong>and</strong>omly selected days aroundnoon showed an average indexvalue of x = 1.99 <strong>and</strong> st<strong>and</strong>arddeviation s = 0.05. Find the 90%confidence interval estimate of theaverage noise index at noon.Confidence Interval Solution*1−α=.90,α=1−.90=.1,α/2=.05Zα/ 2=Z.05=1.64sX±Zα/2⋅n.051.99±1.64⋅⇒1.99±0.008100⇒(1.982 ,1.998)4344Interval Estimation <strong>for</strong> Mean Finding Sample Sizes<strong>for</strong> Estimating µIn a survey on a r<strong>and</strong>om sample of 64individuals who gambled at Las Vegas, theaverage amount of money won <strong>for</strong> the daythat survey was done is –$25.50 with ast<strong>and</strong>ard deviation of $100. Find the 95%confidence interval estimate <strong>for</strong> theaverage amount of money won by peoplegambled at Las Vegas that day.45C.I.:x±z22α22α2σ⋅nMargin ofError=B=Zzn=⋅σBα2σ⋅nB = Margin of Error or BoundI don’t want tosample too muchor too little!46Sample Size ExampleWhat sample size is needed to be 90%confident of being correct within ± 5? Apilot study suggested that the st<strong>and</strong>arddeviation is 45.2222σ( 1.645) ( 45)=22( 5)Z05n= . =219.2≅220BThinking ChallengeYou plan to survey residents inyour county to find the averagehealth insurance premium thatthey are paying. You want to be95% confident that the samplemean is within ± $50.A pilot study showed that σ wasabout $400. What samplesize should you use?4748CI -8
Sampling Distribution & Confidence IntervalSample Size Solution*Zσn=B=220.025222( 1.96) ( 400)2( 50)=245.86≅24649Confidence Interval Mean(σ Unknown & n< 30)1. AssumptionsPopulation St<strong>and</strong>ard Deviation Is UnknownPopulation Must Be Normally Distributed2. Use Student’s t Distribution3. Confidence Interval EstimateSX−tα /2,n−1⋅,X+tα/2,nnSX ± tα⋅, n − 12 nSn( α −1⋅)50Bell-ShapedSymmetricStudent’s t Distribution‘Fatter’ TailsSt<strong>and</strong>ardNormal (Z)0t (df(= 13)x − µt =snt (df(= 5)Zt51Student’s t Tablet valuesFor a 90% C.I.:n = 3df = n - 1 = 2α = .10α/2 =.05t α/2= ? .050t2.92052Estimation ExampleMean (σ Unknown)A r<strong>and</strong>om sample of weights of 25 subjects, has asample mean 140 <strong>and</strong> sample st<strong>and</strong>ard deviation 8.Set up a 95% confidence interval estimate <strong>for</strong> µ.1−α=.95,α=1−.95=.05,α/2=.025,tα/2 ,df= 24=t0.025=2.064SX ± tα/2,n −1⋅n8140±2.064⋅⇒140±3.3125⇒(136.69 ,143.31)53Thinking ChallengeThe numbers of community hospital beds per1000 population that are available in eachdifferent regions of the country is normallydistributed. A r<strong>and</strong>om sample 6 regions wereselected <strong>and</strong> the rates of beds per 1000 wererecorded <strong>and</strong> they are3.6, 4.2, 4.0, 3.5, 3.8, 3.1.Find the 90% confidence interval estimate ofthe mean bed-rate in the country.54CI -9
Sampling Distribution & Confidence IntervalConfidence Interval Solution*x= 3.7s = 0.38987n = 6, df = n − 1 = 6 − 1 = 5t .05,5 = 2.015 (use 90% confidence level)s .38987= = .1592n 6( 3.7 - (2.015)(0.1592), 3.7 + (2.015)(0.1592) )( 3.379, 4.021 )X tn⋅±α / 2, −1Sn55Confidence interval with z-score:The (1− α)% confidence intervalestimate <strong>for</strong> population mean:Assumption: If sampled from normalpopulation with known variance, σ,σx ± zα/ 2⋅nAssumption: If large sample <strong>and</strong> ifunknown variance, s replaces σ,x ± zα / 2⋅sn56Confidence interval with t-score:The (1− α)% confidence intervalestimate <strong>for</strong> population mean:Assumption: If sampled from normalpopulation with unknown variance, σ,xt±α / 2, df = n −1⋅sn(If sample size is large the normality assumption isinsignificant.)t → z as sample becomes large57Average Weight <strong>for</strong> FemaleTen Year Children In USInfo. from a r<strong>and</strong>om sample: n = 10, x = 80 lb,s = 18.05 lb, assume weight is normallydistributed, find the 95% confidence intervalestimate <strong>for</strong> average weight.Data:73.80 50.00 101.40 67.20 102.2097.80 81.00 93.40 63.20 70.00How do we know whether normality assumption is OK?58Average Weight <strong>for</strong> FemaleTen Year Children In USTests of NormalityKolmogorov-Smirnov aShapiro-WilkStatistic df Sig. Statistic df Sig.ght (pounds) of participant .171 10 .200* .930 10 .452. This is a lower bound of the true significance.. Lillie<strong>for</strong>s Significance CorrectionBoth are greater than 0.05,normality assumption is acceptable.Info. from a r<strong>and</strong>om sample: n = 10, x = 80 lb,s = 18.05 lb, assume weight is normallydistributed, find the 95% confidence intervalestimate <strong>for</strong> average weight.t α/2 = t .05/2 = t 0.25 , d.f. = 10 – 1 = 9, t 0.25, 9 = 2.262xs18.05⇒ 80 ± 2.262n1080 ± 12.91 ⇒ (67.09, 92.91)± tα/ 2, df = 9⋅⋅5960CI -10
Sampling Distribution & Confidence IntervalWeight <strong>for</strong> Ten Year Oldht (pounds)articipantWhat is your sex?femaleMeanmaleDescriptives95% ConfidenceInterval <strong>for</strong> MeanLower BoundUpper Bound5% Trimmed MeanMedianVarianceStd. DeviationMinimumMaximumRangeInterquartile RangeSkewnessKurtosisMean95% Confidence Lower BoundInterval <strong>for</strong> MeanUpper Bound80 ± 12.91Statistic Std. Error80.0000 5.7084067.086792.913380.433377.4000325.85818.0515350.00102.2052.2032.5000-.148 .687-1.229 1.33486.8600 3.9604877.90086195.8192Confidence Interval Estimateof Proportion62Proportion EstimationParameter: Population Proportion p (or π)(Percentage of people has no health insurance)xStatistic: Sample Proportion p ˆ =nx is number of successesn is sample size63 Confidence IntervalProportion1. Assumptions• Two Categorical Outcomes• Normal Approximation Can Be Used Ifnp <strong>and</strong> n(1 – p) are both greater than 5.2. Confidence Interval Estimate(<strong>for</strong> large sample)pˆ⋅(1−pˆ)pˆ⋅(1−pˆ)( pˆ−zα2⋅,pˆ+zα2⋅)nnpˆ⋅(1−pˆ)pˆ± zα⋅2n 64Estimation ExampleProportionA r<strong>and</strong>om sample of 400 from a large communityshowed that 32 have diabetes. Set up a 95%confidence interval estimate <strong>for</strong> p, thepercentage of people that have diabetes.32pˆ = =.08,n=400,zα/ 2=z.025=1.9640065Estimation ExampleProportionThe 95% C.I. <strong>for</strong> p, the percentage of peoplethat have diabetes:32pˆ = =.08,n=400400pˆ⋅(1−pˆ )pˆ ± Zα /2⋅n.08±1.96⋅.08⋅(1−.08)400.08 ±.027⇒8%±2.7%⇒(.053,.107)66CI -11
Sampling Distribution & Confidence IntervalThinking ChallengeA member of a health departmentwish to see what percentage ofpeople in a community willsupport an environmental policy.Of 200 survey <strong>for</strong>ms sent <strong>and</strong>received, 35 responded that theysupport the policy <strong>and</strong> the rest ofthem do not support the policy.Find a 90% confidence intervalestimate of the percentage of thepopulation in this community thatsupport the policy?67Confidence IntervalSolution*p 35ˆ = =1.645200.175,n= 200, zα / 2=pˆ⋅(1−pˆ )pˆ ± zα /2⋅n.175⋅(.825 ).175±1.645⋅200.175±.0442=17.5%±4.42%=(13 .08 % ,21 .92 % )68Example:Researchers wish to estimate thepercentage of hospital employees infectedby SARS in a certain country. Out of 500r<strong>and</strong>omly chosen hospital employees, 14were infected. Find the 95% confidenceinterval estimate <strong>for</strong> percentage of hospitalemployees infected by SARS in thiscountry.69 Sample Sizepˆ⋅(1−pˆ)C.I.:pˆ± zα ⋅2n pˆ⋅(1−pˆ)MarginofError= B=Zα⋅2n2z2n = α⋅pˆ⋅(1−pˆ)2Borzn= B 2α2 ⋅20.25if pilot study is done.to get the largest sample toachieve the goal.70Sample Size (No prior in<strong>for</strong>mation on p)Sample Size Example: If one wishes todo a survey to estimate the populationproportion with 95% confidence <strong>and</strong> amargin of error of 3%, how large asample is needed?Z α/2 = 1.96; B = .03n = (1.96 2 /.03 2 ) x .25 = 1067.11A sample of size 1068 is needed.71Sample Size (With prior in<strong>for</strong>mation on p)Sample Size Example: If one wishes to toestimate the percentage of people infected withWest Nile in a population with 95% confidence<strong>and</strong> a margin of error of 3%, how large asample is needed? (A pilot study has been done,<strong>and</strong> the sample proportion was 6%.)Z α/2 = 1.96; B = .03n = (1.96 2 /.03 2 ) x .06 x (1 – .06) = 240.7A sample of size 241 is needed.How large a sample was used <strong>for</strong> pilot study?72CI -12