PUC Annual ReportâFiscal Year 2004-05 - Public Utilities Commission
PUC Annual ReportâFiscal Year 2004-05 - Public Utilities Commission
PUC Annual ReportâFiscal Year 2004-05 - Public Utilities Commission

Create successful ePaper yourself
Turn your PDF publications into a flip-book with our unique Google optimized e-Paper software.
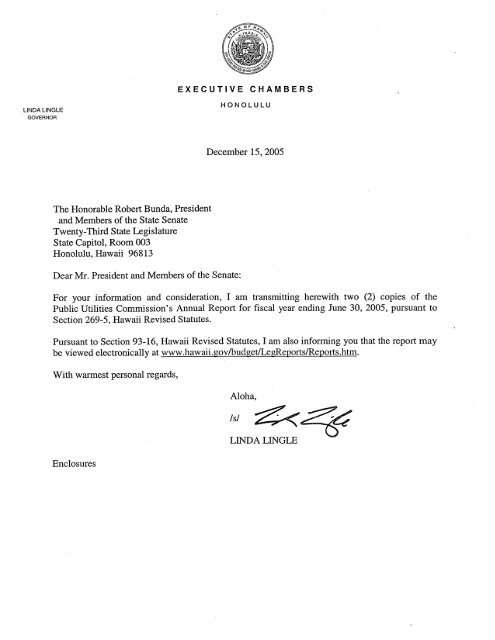
PUBLIC UTILITIES COMMISSIONSTATE OF HAWAIIANNUAL REPORT(HAW. REV. STAT. § 269-5)FISCAL YEAR <strong>2004</strong>-<strong>05</strong>NOVEMBER 20<strong>05</strong>
TABLE OF CONTENTS<strong>Commission</strong> History and Background........................................................................................1Goals and Objectives of <strong>Commission</strong>........................................................................................4Administrative Update................................................................................................................4Regulatory Issues and Proceedings: .........................................................................................5Major Regulatory Issues ...............................................................................................5Electricity and Energy Proceedings ..............................................................................5Gas Proceedings.........................................................................................................16Telecommunications Proceedings ..............................................................................16Private Water and Sewage <strong>Utilities</strong> Proceedings .......................................................22Transportation Carriers Proceedings..........................................................................24One Call Center Proceedings .....................................................................................31Gasoline Price Cap Proceedings ................................................................................32Docket Proceedings....................................................................................................33Enforcement Activities..............................................................................................................36Inquiries....................................................................................................................................47Fiscal Information.....................................................................................................................48Utility Company Operations, Capital Improvements, and Rates..............................................49Utility Company Performance ..................................................................................................66Legislation Enacted by 20<strong>05</strong> Legislature Affecting <strong>Public</strong> <strong>Utilities</strong> ..........................................90Federal Issues and Activities ...................................................................................................93Preview Fiscal <strong>Year</strong> 20<strong>05</strong>-06 ...................................................................................................95
ANNUAL REPORTFISCAL YEAR <strong>2004</strong>-<strong>05</strong>(HAW. REV. STAT. § 269-5)PUBLIC UTILITIES COMMISSIONSTATE OF HAWAIII. INTRODUCTION.<strong>Public</strong> utilities continue to undergo significant changes due to developments intechnology, markets, economic conditions, consumer needs, and environmental concerns.Regulatory commissions throughout the United States must recognize these changes and adaptand adjust regulatory practices to these changes to protect the public interest, while itsimultaneously allows and encourages the public utilities to efficiently operate, grow, and developin their respective industries.The <strong>Public</strong> <strong>Utilities</strong> <strong>Commission</strong> (“<strong>Commission</strong>”) of the State of Hawaii (“State”) submitsthis <strong>Annual</strong> Report pursuant to Section 269-5, Hawaii Revised Statutes, as amended (“HRS”). Inshort, this report summarizes the activities and operations of the <strong>Commission</strong> and the publicutilities it regulates during the July 1, <strong>2004</strong> to June 30, 20<strong>05</strong> fiscal year (“Fiscal <strong>Year</strong>”), as well asthe <strong>Commission</strong>’s goals and objectives.II.COMMISSION HISTORY AND BACKGROUND.The <strong>Commission</strong> is responsible for regulating all chartered, franchised, certificated, andregistered public utility companies that provide electricity, gas, telecommunications, private waterand sewage, and motor and water carrier transportation services in the State. The <strong>Commission</strong>has statutory authority to establish and enforce applicable state statutes, administrative rules andregulations, and to set policies and standards.A. HISTORY.The <strong>Commission</strong> was established in 1913 by Act 89, Session Laws of Hawaii (“SLH”)1913, as a part-time, three-member body with broad regulatory oversight and investigativeauthority over all public utility companies doing business in the Territory of Hawaii. This act,amended over the years and codified in Chapter 269, HRS, is the basis for utility regulation inHawaii. The <strong>Commission</strong>’s authority to regulate various classifications of motor carriers ofpassengers and property is derived from the Hawaii Motor Carrier Law (Chapter 271, HRS)enacted in 1961. Responsibility for all commercial water transportation carriers of persons andproperty within the State is derived from the Hawaii Water Carrier Act of 1974 (Chapter 271G,HRS). Chapter 6-61, “Rules of Practice and Procedure Before the <strong>Public</strong> <strong>Utilities</strong> <strong>Commission</strong>,”of the Hawaii Administrative Rules (“HAR”) sets forth general procedural requirements forintervention and participation in proceedings before the <strong>Commission</strong>. Other HARs and generalorders of the <strong>Commission</strong> set forth the standards, rules, and other procedures governing electric,gas, telecommunications, private water and sewage, and motor and water carrier transportationservices.The <strong>Commission</strong>’s statutory responsibilities also involve establishing the maximumpre-tax wholesale gasoline prices and regulating subsurface installations. The <strong>Commission</strong>’sauthority relating to the determination of the maximum pre-tax wholesale gasoline prices isderived from Chapter 486H, HRS. Responsibility for the establishment and administration of aone call center which will provide advance warning to excavators in the State of the location ofsubsurface installations in the area of an excavation is derived from Chapter 269E, HRS.
<strong>Public</strong> <strong>Utilities</strong> <strong>Commission</strong> <strong>Annual</strong> Report <strong>2004</strong>-<strong>05</strong>State of Hawaii Page 2Today, the <strong>Commission</strong> is a full-time body comprised of three (3) <strong>Commission</strong>ers. TheGovernor, with the consent of the State Senate, appoints the <strong>Commission</strong>ers. They each servesix-year terms on a staggered basis.B. COMMISSIONERS.Carlito P. Caliboso, ChairmanCarlito Caliboso was appointed to the <strong>Public</strong> <strong>Utilities</strong> <strong>Commission</strong> and named Chairmanof the <strong>Commission</strong> by Governor Linda Lingle on April 30, 2003. In <strong>2004</strong>, he was reappointed tothe <strong>Commission</strong> for a term to expire on June 30, 2010.Prior to his appointment, Chairman Caliboso was engaged in private law practice since1991. Currently, Chairman Caliboso is a member of the Federal Communications <strong>Commission</strong>’s(“FCC”) Intergovernmental Advisory Committee, which provides advice to the FCC on a broadrange of telecommunications issues of interest to state, local, and tribal governments. He is alsoa member of the National Association of Regulated <strong>Utilities</strong> <strong>Commission</strong>ers (“NARUC”), andserves on NARUC’s Committee on Energy Resources and the Environment and Committee onInternational Relations. In addition, he serves on the State Energy Emergency PreparednessAdvisory Committee. Chairman Caliboso earned a bachelor of business administration degreefrom the University of Hawaii and a law degree from the William S. Richardson School of Law ofthe University of Hawaii.Wayne H. Kimura, <strong>Commission</strong>erWayne Kimura was appointed to the <strong>Commission</strong> by Governor Benjamin J. Cayetano inDecember 2001. He served as Chairman of the <strong>Commission</strong> from July 2002 until April 2003.Prior to his appointment, <strong>Commission</strong>er Kimura served as the Hawaii State Comptrollerin the Department of Accounting and General Services. He also served as Deputy Director ofFinance and briefly as Interim Director of Finance in the Department of Budget and Finance. Inthe Office of the Governor, he worked as Planning and Policy Analyst. He also held various fiscaland policy analyst positions in the Office of the Lieutenant Governor, the Department of Budgetand Finance, the Department of Social Services and Housing, the Hawaii State Senate, the StateHouse of Representatives, and the 1978 Constitutional Convention. <strong>Commission</strong>er Kimura holdsa bachelor’s degree, with work towards a master’s degree in business administration, at theUniversity of Southern California. His term expires June 30, 2008.Janet E. Kawelo, <strong>Commission</strong>erJanet Kawelo was appointed to the <strong>Commission</strong> by Governor Benjamin J. Cayetano inJanuary 2002.Prior to her appointment, <strong>Commission</strong>er Kawelo served as Deputy Director of the HawaiiState Department of Land and Natural Resources. She also served as Special Assistant andResearch Supervisor in the Office of the Governor, researcher in the Office of the LieutenantGovernor, and Research Officer in the Economic Research Division of First Hawaiian Bank.<strong>Commission</strong>er Kawelo holds a bachelor’s degree in bacteriology from the University of Californiaat Berkeley and a professional diploma in elementary education from the University of Hawaii.Her term expires June 30, 2006.
<strong>Public</strong> <strong>Utilities</strong> <strong>Commission</strong> <strong>Annual</strong> Report <strong>2004</strong>-<strong>05</strong>State of Hawaii Page 3C. ADMINISTRATION AND OFFICES.The <strong>Commission</strong> is comprised of three commissioners and, as of June 30, 20<strong>05</strong>, a staffof 35 employees. These employees include an administrative director, attorneys, engineers,auditors, researchers, investigators, neighbor island representatives for Kauai, Maui County andHawaii, documentation staff, and clerical staff. The <strong>Commission</strong> has four offices locatedthroughout the State:OAHU:<strong>Public</strong> <strong>Utilities</strong> <strong>Commission</strong>Kekuanaoa Building465 South King Street, #103Honolulu, HI 96813Phone: (808) 586-2020Fax: (808) 586-2066KAUAI:<strong>PUC</strong> Kauai District Office3060 Eiwa Street, #302-CLihue, HI 96766Phone: (808) 274-3232Fax: (808) 274-3233MAUI:<strong>PUC</strong> Maui District OfficeState Office Building #154 S. High Street, #218Wailuku, HI 96793Phone: (808) 984-8182Fax: (808) 984-8183HAWAII:<strong>PUC</strong> Hawaii District Office688 Kinoole Street, #106-AHilo, HI 96720Phone: (808) 974-4533Fax: (808) 974-4534Email:Hawaii.<strong>PUC</strong>@hawaii.govWeb:www.hawaii.gov/budget/puc/For administrative purposes, the <strong>Commission</strong> is placed under the Department of Budgetand Finance. 11 Haw. Rev. Stat. §§ 26-8, 26-35, 269-2, as amended.
<strong>Public</strong> <strong>Utilities</strong> <strong>Commission</strong> <strong>Annual</strong> Report <strong>2004</strong>-<strong>05</strong>State of Hawaii Page 4III.GOALS AND OBJECTIVES OF COMMISSION.A. PRIMARY PURPOSE.The <strong>Commission</strong>’s primary purpose is to effectively, fairly, and impartially ensurethat regulated utilities efficiently and safely provide utility customers withadequate and reliable utility services at just and reasonable rates, while providingregulated utilities with a reasonable opportunity to earn a fair rate of return.B. LONG-TERM GOALS.Modernize and re-organize the <strong>Commission</strong> as needed to adapt to changes intechnology, markets, economic conditions, consumer needs, and environmentalconcerns to improve the efficiency and effectiveness of the <strong>Commission</strong>.Foster and encourage competition or other alternatives where reasonablyfeasible in an effort to provide consumers with meaningful choices for services atlower rates that are just and reasonable.Promote and encourage efficient and reliable production and delivery of all utilityservices.Promote and encourage efficient and reliable electricity generation, transmissionand distribution.Promote and encourage the use of alternative or renewable energy resources forthe production of electricity to increase the efficiency, reliability, and sustainabilityof electricity generation and supply for consumers.Assist in creating an environment conducive for healthy economic growth andstability in the public interest.C. SHORT-TERM GOALS.Increase the transparency of the regulatory process and public access to the<strong>Commission</strong> to ensure that the <strong>Commission</strong> efficiently, independently, fairly, andimpartially regulates public utilities.Streamline and modernize the regulatory process whenever reasonably feasibleto increase the efficiency of the <strong>Commission</strong> and regulated utilities.Re-evaluate and update internal <strong>Commission</strong> staff procedures to increase theefficiency and effectiveness of <strong>Commission</strong> activities.IV.ADMINISTRATIVE UPDATE.During the Fiscal <strong>Year</strong>, the <strong>Commission</strong> continued to implement initiatives that aim tomeet our strategic plan’s short and long-term goals, which include increasing the transparency ofthe regulatory process and public access to the <strong>Commission</strong>, streamlining and modernizing theregulatory process, and improving services to the public by increasing operational efficiency. Allof the aforementioned goals will be accomplished with the initiation of an information technologyservices contract in the Fiscal <strong>Year</strong> that will result in development and implementation of a stateof the art document and docket management system (“DMS”) to serve as the electronic backboneof the <strong>Commission</strong>’s operations. Once fully functional, the DMS will enable the <strong>Commission</strong> to,among other things, electronically consolidate and store historical information in one database,
<strong>Public</strong> <strong>Utilities</strong> <strong>Commission</strong> <strong>Annual</strong> Report <strong>2004</strong>-<strong>05</strong>State of Hawaii Page 5share relevant information with the Department of Commerce and Consumer Affairs, Division ofConsumer Advocacy (“Consumer Advocate”), increase the efficiency of internal documentdevelopment and distribution, and allow the public to access public documents in real time via ourwebsite. Additionally, staffing initiatives to fill six (6) existing position vacancies and the creationof two new <strong>Commission</strong> positions, i.e., Chief Engineer and DPSA (Data Processing SystemsAnalyst) IV, occurred in the Fiscal <strong>Year</strong>.Major administrative points of focus for Fiscal <strong>Year</strong> 20<strong>05</strong>-06 will continue to includepersonnel recruitment and training, technological and regulatory process improvements, andpublic education and information transparency enhancements.V. REGULATORY ISSUES AND PROCEEDINGS.A. MAJOR REGULATORY ISSUES.The <strong>Commission</strong> is responsible for regulating 257 utility companies or entities (4 electric,1 gas, 216 telecommunications, and 36 water and sewer companies), 4 water carriers,531 passenger carriers and 384 property carriers in the State. During the Fiscal <strong>Year</strong>, the<strong>Commission</strong> opened 371 new dockets relating to those regulated utilities and transportationcompanies, completed and disposed of 575 dockets from its total case load and issued792 decisions and orders relating to new dockets and to those carried over from prior years.During the Fiscal <strong>Year</strong>, key proceedings in the electric utility area included the<strong>Commission</strong>’s review of Hawaiian Electric Company, Inc.’s (“HECO”) request for a general rateincrease. The <strong>Commission</strong> separated from the rate case docket HECO’s request to modify itsdemand-side management programs and cost recovery. The <strong>Commission</strong> also opened aproceeding to examine Kauai Island Utility Cooperative’s third integrated resource plan.In the telecommunications area, the <strong>Commission</strong> reviewed and conditionally approvedthe proposed sale of Verizon Hawaii Inc., now known as Hawaiian Telcom, Inc., toTC Group L.L.C., dba The Carlyle Group. The <strong>Commission</strong> also approved the merger of SprintCorporation and Nextel Communications, Inc. The <strong>Commission</strong> also granted a certificate ofauthority to Time Warner Cable Information Services (Hawaii) LLC to provide local and longdistance Internet Protocol voice services (aka, Voice over Internet Protocol or VoIP).During the Fiscal <strong>Year</strong>, a key water carrier proceeding related to granting HawaiiSuperferry, Inc. a Certificate of <strong>Public</strong> Convenience and Necessity (“CPCN”) to operate ascommon carrier of passengers and property.Other key proceedings related to establishing the One Call Center advisory committeeand examining the issues and requirements of the gasoline price cap law, Chapter 486H, HRS.The following sections highlight the significant proceedings of the <strong>Commission</strong>.B. ELECTRICITY AND ENERGY PROCEEDINGS.The <strong>Commission</strong> regulates four electric utility companies or entities engaged in theproduction, purchase, transmission, distribution, and sale of electric energy in the State: HECO,serving the island of Oahu; Maui Electric Company, Ltd. (“MECO”), serving the islands of Maui,Lanai, and Molokai; Hawaii Electric Light Company, Inc. (“HELCO”), serving the island of Hawaii;and Kauai Island Utility Cooperative (“KIUC”), serving the island of Kauai. MECO and HELCOare wholly-owned subsidiaries of HECO, which is in turn a wholly-owned subsidiary of HawaiianElectric Industries, Inc.
<strong>Public</strong> <strong>Utilities</strong> <strong>Commission</strong> <strong>Annual</strong> Report <strong>2004</strong>-<strong>05</strong>State of Hawaii Page 61. HECO, MECO, HELCO, AND KIUC PROCEEDINGS:a. COMMISSION REVIEWS HECO’S REQUEST FOR RATEINCREASE.In November <strong>2004</strong>, HECO filed an application requesting a rate increase of 9.9 per centwhich includes the transfer of the cost of existing energy conservation programs from a surchargeline item on electric bills into base electricity charges which appear on another line on electricbills. For HECO customers, the net rate increase is 7.3 per cent. HECO’s request for a rateincrease will be needed to ensure the continuation and expansion of its energy efficiency andconservation programs. The <strong>Commission</strong> issued a decision granting an interim rate increase inFiscal <strong>Year</strong> 20<strong>05</strong>-06. 2In the same rate increase application, HECO also requested approvals and/ormodification of demand-side management (“DSM”) programs and load management programsand recovery of costs and DSM utility incentives. (For a discussion of this part of HECO’srequest, see the section, “HECO Requests Approval of DSM Programs and Cost Recovery.”)b. INTEGRATED RESOURCE PLANNING (“IRP”) ACTIVITIES.IRP has become a key vehicle for state regulatory commissions, electric utilities, energystakeholders, and the public to understand and influence the planning process of identifying andevaluating combinations of demand–side and supply-side energy resources that will achievespecified objectives and meet forecasted demand. Specifically, the goal of IRP is theidentification of the resources or the mix of resources for meeting near and long term consumerenergy needs in an efficient and reliable manner at the lowest reasonable cost.In 1992, the <strong>Commission</strong> required HECO, HELCO, MECO and Citizens CommunicationsCompany, Kauai Electric Division (“KE”) (nka, KIUC) to develop integrated resource plans inaccordance with the IRP Framework. The IRP Framework, which was adopted in May 1992,requires each energy utility to develop a long-range, twenty-year IRP and a medium-range,five-year program implementation schedule (action plan) to be submitted on a three-year planningcycle for the <strong>Commission</strong>’s review and approval. Generally, the IRP Framework furtherprescribes what the utilities are required to do and the factors to be considered in developing theirrespective integrated resource plans. Among other things, it also encourages public participationin the development of each utility’s integrated resource plan, and subject to <strong>Commission</strong> reviewand approval, allows the utility to seek the recovery of all appropriate and reasonable integratedplanning and implementation costs. In addition, the IRP Framework provides the <strong>Commission</strong>with the authority to establish various incentive mechanisms to encourage and reward aggressiveutility pursuits of DSM programs (i.e., shareholder incentives and lost margins 3 ).2 On September 27, 20<strong>05</strong>, the <strong>Commission</strong> issued a decision granting HECO an interimrate increase of $53,288,000 in additional revenues. Interim Decision and Order No. 22<strong>05</strong>0, filedSeptember 27, 20<strong>05</strong>, in Docket No. 04-0113.3 In November 2001, the <strong>Commission</strong> required, consistent with the parties’ stipulation, thatif HECO exceeds its current authorized rate of return of 9.16 per cent on its average rate basedetermined in its last rate case in 1995, as a result of its recovery of lost margins and shareholderincentives, HECO shall refund the amount by which its rate of return on average rate baseexceeds 9.16 per cent, together with interest. D&O Nos. 19019 and 19020, November 15, 2001.The <strong>Commission</strong> issued similar decisions, consistent with the parties’ stipulation, for HELCO(Amended D&O No. 19094, December 11, 2001) and MECO (D&O No. 19093, November 30,2001). Under D&O No. 19658, KIUC waived “all claims they may have to recover earned, butunbilled demand side management shareholder incentives from KE customers.”
<strong>Public</strong> <strong>Utilities</strong> <strong>Commission</strong> <strong>Annual</strong> Report <strong>2004</strong>-<strong>05</strong>State of Hawaii Page 720<strong>05</strong>.Below is a summary of the status of electric utility IRPs and action plans as of June 30,HECO’s first IRP and action plan were approved in March 1995. In January 2001, the<strong>Commission</strong> approved the parties’ agreement that HECO’s second IRP and action plans aresufficient to meet HECO’s responsibilities under the IRP Framework. On December 31, 2002,HECO filed its evaluation report of its second IRP. In September 2003, the <strong>Commission</strong> openeda proceeding to examine HECO’s third IRP. HECO’s third IRP and action plans are due no laterthan October 31, 20<strong>05</strong>. 4MECO’s first IRP and action plan were approved in May 1996. In May 2000, MECO filedits second IRP. In April <strong>2004</strong>, the <strong>Commission</strong> approved the parties’ agreement and requiredMECO to submit two annual evaluation reports. On April 30, <strong>2004</strong>, MECO filed its first evaluationreport of its second IRP. The <strong>Commission</strong> also opened a proceeding to examine MECO’s thirdIRP. MECO’s third IRP and action plan are due no later than October 31, 2006.HELCO’s first IRP and action plan were approved in May 1996. The company’s revisedIRP was filed in September 1998. In February <strong>2004</strong>, the <strong>Commission</strong> approved the parties’agreement. On March 31, <strong>2004</strong>, HELCO filed its evaluation report of its second IRP. The<strong>Commission</strong> also opened a proceeding to examine HELCO’s third IRP. HELCO’s third IRP andaction plans are due no later than October 31, 20<strong>05</strong>. 5KIUC’s first IRP was approved in July 1995. KIUC filed its revised IRP in April 1997. InAugust 2000, KIUC filed its annual update report of the IRP. In April <strong>2004</strong>, the <strong>Commission</strong>approved KIUC’s request to defer the December 31, 2003 proposed revision to the IRP and DSMprograms for one (1) year to allow KIUC the time to examine and recommend an IRP and DSMplan that would address the needs and interests of its new structure as a member-ownedcooperative. The <strong>Commission</strong> also approved KIUC’s request to suspend all other IRP and DSMfilings until such time that a revised framework can be approved by the <strong>Commission</strong>.In December <strong>2004</strong>, KIUC submitted its revisions to its IRP and DSM framework. InMarch 20<strong>05</strong>, the <strong>Commission</strong> opened a proceeding to investigate KIUC’s proposed revised IRPand DSM framework. The issues to be examined are: (1) the changes, if any, that are requiredto the <strong>Commission</strong>’s IRP framework and (2) the effect, impact, and appropriateness of KIUC’sproposed revised framework.c. HECO REQUESTS APPROVAL OF DSM PROGRAMS ANDCOST RECOVERY.As described above, in November <strong>2004</strong>, HECO filed an application requesting a rateincrease and approval and/or modification of DSM and load management programs and recoveryof program costs and DSM utility incentives. In March 20<strong>05</strong>, the <strong>Commission</strong> separated theproposed DSM programs case from the rate case and opened a new docket, the “EnergyEfficiency Docket,” to examine the proposed DSM programs.In its DSM programs application, HECO requests approval to: (1) establish seven (7)new energy efficiency DSM programs and recover the programs’ costs through base rates;(2) extend the residential customer energy awareness (“RCEA”) program duration from two (2) tofive (5) years and modify the cost recovery mechanism so that the program costs are recovered4 HECO filed its third IRP on October 28, 20<strong>05</strong>. Docket No. 03-0253.5 In November 20<strong>05</strong>, the <strong>Commission</strong> granted HELCO an extension to file its third IRP onDecember 29, 20<strong>05</strong>. Order No. 221<strong>05</strong>, filed November 4, 20<strong>05</strong>, in Docket No. 04-0046.
<strong>Public</strong> <strong>Utilities</strong> <strong>Commission</strong> <strong>Annual</strong> Report <strong>2004</strong>-<strong>05</strong>State of Hawaii Page 8entirely through base rates; and (3) modify the cost recovery mechanism for its two (2) approvedload management DSM programs. The <strong>Commission</strong> allowed HECO to temporarily continue itsexisting two (2) residential DSM programs and three (3) commercial and industrial DSMprograms, until further ordered by the <strong>Commission</strong>.d. COMMISSION APPROVES HECO RESIDENTIAL DIRECTLOAD CONTROL (“RDLC”) PROGRAM AND COSTRECOVERY.In October <strong>2004</strong>, the <strong>Commission</strong> approved HECO’s RDLC program as a pilot projectsubject to the conditions stated in the <strong>Commission</strong>’s decision and in the parties’ settlementagreement. The <strong>Commission</strong> also approved recovery of program costs that are accrued throughthe date that estimated costs are incorporated into rates as a result of the next rate case throughthe IRP cost recovery provision. Under the five-year program, HECO will provide participatingcustomers with a monthly electric bill credit of $3.00 and will install a radio-controlled switch nextto their water heating unit, which in turn will turn off the water heater when signaled by HECO.The objective of this program is to provide HECO with approximately 17 megawatts (“MW”) ofinterruptible load from residential water heaters during the system peak.In April 20<strong>05</strong>, the <strong>Commission</strong> approved HECO’s request to amend the RDLC programeligibility criteria to include customers who live in master metered single family homes or mastermetered multi-family homes provided that HECO requires its master metered customersparticipating in the program to notify all persons who may have their water heaters disconnectedof the potential for such an event to occur.e. COMMISSION APPROVES HECO COMMERCIAL ANDINDUSTRIAL DIRECT LOAD CONTROL (“CIDLC”)PROGRAM AND COST RECOVERY.In October <strong>2004</strong>, the <strong>Commission</strong> approved HECO’s CIDLC program as a pilot programsubject to the conditions stated in the <strong>Commission</strong>’s decision and in the parties’ settlementagreement. The <strong>Commission</strong> also approved recovery of program costs that are accrued throughthe date that estimated program costs are incorporated into rates as a result of the next rate casethrough the IRP cost recovery provision.The CIDLC program offers eligible commercial and industrial electric customers theopportunity to nominate all or a portion of their demand as directly controllable or “controlled” (i.e.,able to be controlled or interrupted by HECO under specific circumstances). HECO considers theremaining demand to be the customer’s “firm service level.” In exchange for agreeing to reduceelectrical usage to their designated firm service level when required, HECO will provideparticipating customers with a monthly controlled demand incentive based on recorded usageabove their firm service level, whether or not an interruption of load occurs. The objective of thisprogram is to provide HECO with approximately 21 MW of interruptible load, beyond thatprovided by the existing customers on Rider I.In April 20<strong>05</strong>, the <strong>Commission</strong> approved HECO’s request to amend its standard CIDLCprogram contract for participating customers to include two (2) inadvertently omitted provisions.The omitted provisions relate to HECO’s methodology for determining “Demand” and terminationof a customer’s participation in the CIDLC program.
<strong>Public</strong> <strong>Utilities</strong> <strong>Commission</strong> <strong>Annual</strong> Report <strong>2004</strong>-<strong>05</strong>State of Hawaii Page 9f. COMMISSION APPROVES HELCO AND APOLLO ENERGYCORPORATION (“APOLLO”) RESTATED POWERPURCHASE AGREEMENT (“PPA”).Apollo operates the Kamaoa wind farm on the island of Hawaii. Under the terms of aPPA, Apollo sells its as-available energy to HELCO. The PPA was scheduled to expire on orabout June 29, 2002. The PPA continued in effect by the parties’ mutual agreement. InAugust <strong>2004</strong>, the <strong>Commission</strong> ordered Apollo and HELCO to submit their final executed restatedand amended contract (“RAC”) for <strong>Commission</strong> approval.In March 20<strong>05</strong>, the <strong>Commission</strong> approved the RAC between HELCO and Apollo. TheRAC will commence when Apollo first starts to sell energy to HELCO from Apollo’s new windturbines. Apollo will design, construct, own, and operate its expanded wind farm. Apollo’s windfarm will have a total capacity of 21 MW. Apollo’s projected date of operating in parallel withHELCO’s system is March 2006. HELCO is allowed to include, in its energy cost adjustmentclause (“ECAC”), the purchased energy costs and related revenue taxes that it incurs under theRAC.The <strong>Commission</strong> also approved HELCO’s request to construct its two (2) 69 kV linedrops above the surface of the ground, as part of its interconnection facilities. Apollo willconstruct, operate, and maintain the interconnection facilities it owns. Apollo will also design andconstruct certain HELCO-owned interconnection facilities and, upon completion, transfer title ofthese facilities to HELCO. HELCO will design and construct the other HELCO-ownedinterconnection facilities.g. COMMISSION APPROVES MECO AND KAHEAWA WINDPOWER, LLC (“KWP”) POWER PURCHASE CONTRACT(“PPC”).In March 20<strong>05</strong>, the <strong>Commission</strong> approved the as-available energy PPC between MECOand KWP. KWP’s wind farm will be located at Kaheawa Pastures, Ukumehame, on the island ofMaui. KWP is negotiating a lease with the State Board of Land and Natural Resources for theland. KWP will design, construct, own, operate, and maintain its wind farm with a total facilitycapacity of 30 MW, for the production of electrical energy. KWP will provide energy to MECO onan unscheduled basis as KWP determines energy to be available from the wind farm. MECO isallowed to include, in its ECAC, the purchased energy costs and related revenue taxes that itincurs under the PPC, for the term of the PPC, to the extent such payments are not recovered inits base rates.The <strong>Commission</strong> approved MECO’s request to construct its two (2) new 69 kVtransmission line drops above the surface of the ground, as part of its interconnection facilities.KWP will construct, operate, and maintain the KWP-owned interconnection facilities. KWP willalso design and construct certain MECO-owned interconnection facilities and transfer title to suchfacilities to MECO.h. COMMISSION APPROVES HECO AND KALAELOAPARTNERS, L.P. (“KP”) PPA AMENDMENTS.In May 20<strong>05</strong>, the <strong>Commission</strong> approved Amendments No. 5 and No. 6 of the amendedPPA between HECO and KP. Under the amended PPA, HECO is obligated to purchase 180 MWof firm capacity and energy supplied by KP’s cogeneration facility. Amendments No. 5 and No. 6of the amended PPA address certain issues relating to additional capacity, energy chargecomponents, reliability, capacity evaluation protocol, and financial accounting. The amendmentsalso memorialize the PPA parties’ clarification and interpretation of certain provisions in theamended PPA and update certain attachments to the amended PPA.
<strong>Public</strong> <strong>Utilities</strong> <strong>Commission</strong> <strong>Annual</strong> Report <strong>2004</strong>-<strong>05</strong>State of Hawaii Page 10The <strong>Commission</strong> also allowed HECO to include, in its ECAC, the fuel component and theadditive component of the purchased energy costs and related revenue taxes to be incurred byHECO pursuant to the PPA amendments, to the extent such costs are not included in its baserates. HECO may include the costs of the additional capacity and the purchased power incurredby HECO pursuant to the PPA amendments, in its revenue requirements for ratemaking purposesand for the purposes of determining the reasonableness of HECO’s rates.i. COMMISSION APPROVES MODIFICATION OF NET ENERGYMETERING AND INTERCONNECTION TARIFF RULES.In June 20<strong>05</strong>, the <strong>Commission</strong> approved HECO, HELCO, MECO, and the ConsumerAdvocate's stipulated revisions to HECO’s, HELCO’s, and MECO’s Rule 18, Net EnergyMetering, and Rule 14H, Interconnection of Distributed Generating Facilities Operating in Parallelwith the Company’s Electrical System. Rules 18 and 14H amendments are in conformance withAct 99, SLH <strong>2004</strong>, which amended Section 269-101, HRS, by revising the definition of eligiblecustomer-generator to include government entities and increase the capacity of a qualifyingeligible customer-generator’s facility from ten (10) to fifty (50) kW. Rule 18 amendments are alsoin accord with Act 98, SLH <strong>2004</strong>, which amends Section 36-41, HRS, by including leasepurchase,financing agreements, and third-party joint ventures as additional financing options forenergy performance contracts for public facilities.Rule 18 is revised by amending the definition of an eligible customer-generator to includequalifying facilities with a capacity of not more than fifty (50) kilowatts (“kW”) and customers thatcontract with a third-party to operate a qualifying facility. The revisions to Rule 18 alsoincorporate: (1) a standard net energy metering agreement form for qualifying facilities of 10 kWor less; (2) a standard net energy metering and interconnection agreement form for qualifyingfacilities greater than 10 kW, but no more than 50 kW; and (3) a step-by-step energy meteringinterconnection overview process. The revisions to Rule 14H include non-substantive, stylisticchanges and cross-referencing Rule 14H to the new Rule 18.j. COMMISSION APPROVES REFUNDING SPECIAL PURPOSEREVENUE BONDS (“SPRBs”) FOR HECO, HELCO, ANDMECO.In December <strong>2004</strong>, the <strong>Commission</strong> authorized HECO, HELCO, and MECO to participatein the sale by the Department of Budget and Finance of refunding SPRBs for up to a total of$40 million, $5 million, and $2 million, respectively. The proceeds from the sale will be used toredeem, in whole or in part, the Series 1995A Bonds. Act 228, SLH 1992, authorized theissuance of the Series 1995A Bonds and refunding SPRBs.k. COMMISSION APPROVES CHANGES IN HECO’SDEPRECIATION RATES AND VINTAGE AMORTIZATIONACCOUNTING.In September <strong>2004</strong>, the <strong>Commission</strong> approved the settlement agreement between HECOand the Consumer Advocate (“the parties”) regarding HECO’s application requesting approval tochange its depreciation rates and approval of a procedure change to vintage amortizationaccounting for certain accounts. In addition, the <strong>Commission</strong> approved HECO’s request to usevintage amortization accounting for the accounts identified in the <strong>Commission</strong> decision and order.The new depreciation rates and use of vintage amortization accounting for certain assets becameeffective on September 3, <strong>2004</strong>.
<strong>Public</strong> <strong>Utilities</strong> <strong>Commission</strong> <strong>Annual</strong> Report <strong>2004</strong>-<strong>05</strong>State of Hawaii Page 11l. COMMISSION APPROVES KIUC’S DEPRECIATIONACCRUAL RATES.In June 20<strong>05</strong>, the <strong>Commission</strong> approved KIUC’s proposed depreciation accrual rates setforth in the depreciation study. KIUC is allowed to simultaneously utilize the approveddepreciation accrual rates and remove the lost gross margin component from its 20<strong>05</strong> resourcecost adjustment (DSM and IRP) surcharge. KIUC is required to separately identify the future netsalvage value component in KIUC’s depreciation rates and account for the amounts recoveredthrough the depreciation expense consistent with the requirements of the Federal EnergyRegulatory <strong>Commission</strong>. The changes proposed by KIUC are expected to effectively retain theexisting revenue stream and mitigate and/or offset any potential adverse financial impacts toKIUC.m. COMMISSION APPROVES PROJECT EXPENDITURES ANDACCOUNTING TREATMENT OF COMPUTER SOFTWAREDEVELOPMENT COSTS.During the Fiscal <strong>Year</strong>, the <strong>Commission</strong> approved the expenditures and proposedaccounting treatment for the following computer software development projects:Customer Information System (“CIS”) Project. In May 20<strong>05</strong>, the <strong>Commission</strong>approved a request by HECO, HELCO, and MECO (“utilities”) to expendapproximately $20,350,000 for the CIS project. The CIS project involves thepurchase and installation of a new, commercially available, customer informationsystem that will provide basic service functions, such as producing bills,collecting payments, establishing service, and fulfilling customer requests. Theutilities’ existing customer information system is outdated and many of itscomponents are difficult and costly to maintain.The <strong>Commission</strong> also approved the utilities’ request to defer certain computersoftware developments costs, accumulate the allowance for funds used duringconstruction (“AFUDC”) on the deferred costs during the deferral period, amortizethe deferred costs over a twelve (12)-year period, and include the unamortizeddeferred costs in rate base. The utilities are required to file the following reportsor information with the <strong>Commission</strong>: (1) information on the performance andquality of service measures that are produced automatically by the new CIS;(2) information on the performance and quality of service measures the utilitieswill track on a going forward basis after the CIS project is placed into service;(3) annual report on five performance measures - same day billing, bills perbilling representative, bills per customer, credit arrangements, and billingaccuracy; (4) after completion of the bid process, an interim supplemental report;(5) prompt notification if there is a significant change in either the functionality orcost of the CIS project; and (6) a cost report providing the appropriate workorders that state whether the CIS costs were capitalized , deferred, or expensed.Outage Management System (“OMS”) Project. In June 20<strong>05</strong>, the <strong>Commission</strong>approved HECO’s request to expend approximately $5.8 million for the OMSproject. The OMS project involves the purchase and installation of a new,commercially available OMS. OMS is an information technology system that hascapabilities such as collecting trouble information, providing updates of anoutage, and identifying work crews capable of addressing the outage. The OMSwill replace many of the functions performed manually by HECO.The <strong>Commission</strong> also approved HECO’s request to defer certain computersoftware development costs for the OMS, accumulate an AFUDC on the deferred
<strong>Public</strong> <strong>Utilities</strong> <strong>Commission</strong> <strong>Annual</strong> Report <strong>2004</strong>-<strong>05</strong>State of Hawaii Page 13In April 20<strong>05</strong>, the <strong>Commission</strong> approved HECO’s request for the overhead constructionof a temporary 46 kV subtransmission line and the underground conversion of an existing 46 kVoverhead line for the Palehua East 46 kV relocation project. The project was initiated toaccommodate Castle & Cooke Homes Hawaii, Inc.’s plans to construct new residential units onits property in Makakilo, on the island of Oahu.In June 20<strong>05</strong>, the <strong>Commission</strong> approved HECO’s request to relocate a segment of itsMakalapa 42 46 kV overhead subtransmission line above ground. The relocation of the line isneeded to allow for the construction of a housing project on Hickam Air Force Base.In February 20<strong>05</strong>, the <strong>Commission</strong> approved HELCO’s request to reconstruct a 69 kVtransmission line above ground. The Kuakini Highway improvement project requires HELCO toreconstruct a segment of the 69 kV overhead transmission line.In January 20<strong>05</strong>, the <strong>Commission</strong> approved KIUC’s request to construct portions of theKukui’ula relocation project overhead as well as underground. KIUC will relocate portions of a69 kV overhead transmission line overhead and underground running from KIUC’s Port Allenpower plant to its Koloa Substation.q. HECO FILES REQUEST FOR A NEW GENERATINGSTATION.In June 20<strong>05</strong>, HECO filed an application to commit approximately $134,310,260 to installa combustion turbine generating unit at its proposed Campbell Industrial Park (“Campbell”) sitelocated adjacent to the AES Substation. The proposed generating facility project will addapproximately 76 MW to 107 MW of peaking generating capacity on HECO’s system. The projectincludes the construction and acquisition of the equipment necessary to generate additionalelectrical power, expansion of HECO’s existing Barbers Point Tank Farm site, construction of asecond 138 kV transmission line between two of the substations in Campbell, and upgrade ofthree substations. It will be the first power plant on Oahu in 17 years by the time of its plannedoperation in 2009.r. HECO FILES REQUEST FOR A COMMUNITY BENEFITSPACKAGE FOR THE NEW GENERATING STATIONPROJECT.In conjunction with the Campbell generating station project, HECO conducted communitymeetings to discuss the impact that the proposed project would have on the surroundingcommunities. As a result of the community meetings, a set of community benefits was agreedupon as the appropriate “give back.”In June 20<strong>05</strong>, HECO filed an application, as part of a community benefits package,requesting approval for: (1) funds for the purchase and installation of a water pipeline fromCampbell to Kahe Power Plant; (2) funds for the purchase and installation of equipment neededfor environmental monitoring; (3) the accounting and ratemaking treatment of the water pipelineand environmental monitoring programs; and (4) a rate reduction program. The cost of thecommunity benefits package will be shared by HECO customers, the Board of Water Supply, andHECO’s current operations and/or shareholders.s. COMMISSION APPROVES CAPITAL IMPROVEMENTS.Prior to July 1, <strong>2004</strong>, electric utilities were required by the <strong>Commission</strong>’s administrativerules to obtain approval for all capital improvement project (“CIP”) expenditures over $500,000.Effective July 1, <strong>2004</strong>, the threshold increased from $500,000 to $2.5 million for the electric andtelecommunications utilities. Beginning this Fiscal <strong>Year</strong>, only those applications requesting
<strong>Public</strong> <strong>Utilities</strong> <strong>Commission</strong> <strong>Annual</strong> Report <strong>2004</strong>-<strong>05</strong>State of Hawaii Page 14approval for CIP expenditures over $2.5 million must be submitted to the <strong>Commission</strong> for review.In this Fiscal <strong>Year</strong>, the <strong>Commission</strong> approved expenditures totaling over $40 million for electricutility CIPs.During this Fiscal <strong>Year</strong>, HECO was authorized to expend $36.8 million for its capitalimprovements. Expenditures include $22.9 million for the new dispatch center project,$9.1 million for the Ford Island substation project, $1.2 million for the Kahe Power Plant sanitarysewer replacement project, $1.2 million for the Waiau 9 exhaust duct replacement project,$1.1 million for the Waiau fuel oil tank 4 renovation project, $0.7 million for installation of theKahe 6 fan enclosure, and $0.6 million for the Honolulu 8 generator rotor rewind project.HELCO was authorized to expend $2.6 million for the Keahole CT-2 noise mitigationmeasures project.KIUC was authorized to expend $0.6 million for the Port Allen steam plant automationproject.A comparison of prior fiscal years shows that the total dollar value of<strong>Commission</strong>-approved electric utility CIPs (i.e., projects in excess of $500,000) peaked in the2002-03 and 2003-04 fiscal years, as shown in Figures 1 and 2. The peak in the 2002-03 fiscalyear was due in large part to HECO’s $26.9 million approved expenditure for the Waiau fuelpipeline project, while the peak in 2003-04 was due, in large part, to KIUC’s $41.8 millionapproved expenditure for the purchase of the Kauai Power Partners facility. This Fiscal <strong>Year</strong>’sprojects approved by the <strong>Commission</strong> included those submitted under the $500,000 threshold aswell those submitted under the $2.5 million threshold.
<strong>Public</strong> <strong>Utilities</strong> <strong>Commission</strong> <strong>Annual</strong> Report <strong>2004</strong>-<strong>05</strong>State of Hawaii Page 15Figure 1Five-<strong>Year</strong> Comparison of <strong>Commission</strong>-ApprovedElectric Utility CIPs$90,000,000$80,000,000$70,000,000CIP Amount$60,000,000$50,000,000$40,000,000$30,000,000$20,000,000$10,000,000$-FY 2000-01 FY 2001-02 FY 2002-03 FY 2003-04 FY <strong>2004</strong>-<strong>05</strong>KE/KIUC $10,150,835 $- $2,958,900 $41,750,000 $580,000MECO $2,435,540 $2,046,452 $3,379,707 $5,984,591 $-HELCO $2,311,179 $3,788,695 $6,502,973 $8,221,363 $2,585,463HECO $23,379,569 $9,109,866 $41,639,829 $26,999,323 $36,835,359Total CIP $38,277,123 $14,945,013 $54,481,409 $82,955,277 $40,000,822Fiscal <strong>Year</strong> ("FY")
<strong>Public</strong> <strong>Utilities</strong> <strong>Commission</strong> <strong>Annual</strong> Report <strong>2004</strong>-<strong>05</strong>State of Hawaii Page 16Figure 2Five-<strong>Year</strong> Comparison of <strong>Commission</strong>-ApprovedElectric Utility CIPs$45,000,000$40,000,000$35,000,000CIP Amount$30,000,000$25,000,000$20,000,000$15,000,000$10,000,000$5,000,000$-FY 2000-01 FY 2001-02 FY 2002-03 FY 2003-04 FY <strong>2004</strong>-<strong>05</strong>KE/KIUC $10,150,835 $- $2,958,900 $41,750,000 $580,000MECO $2,435,540 $2,046,452 $3,379,707 $5,984,591 $-HELCO $2,311,179 $3,788,695 $6,502,973 $8,221,363 $2,585,463HECO $23,379,569 $9,109,866 $41,639,829 $26,999,323 $36,835,359FYC. GAS PROCEEDINGS.The Gas Company, LLC (“TGC”) is a duly franchised public utility providing gas servicefor residential, commercial, and industrial uses throughout the State. TGC’s operations consist ofthe purchase, production, transmission, and distribution of gas through gas pipelines, and sale ofsynthetic natural gas (“SNG”) and liquid propane gas.During the Fiscal <strong>Year</strong>, TGC filed an application requesting approval of a new residentialrate on the island of Lanai. The application was pending at the end of the Fiscal <strong>Year</strong>. 6D. TELECOMMUNICATIONS PROCEEDINGS.The <strong>Commission</strong> oversees the intrastate cellular, paging, mobile telephone, and otherservices of telecommunications providers in addition to the services of Hawaiian Telcom, Inc.(“Hawaiian Telcom”), formerly known as Verizon Hawaii Inc. (“Verizon Hawaii”), the State’s onlyincumbent local exchange carrier and largest provider of intrastate services.Key activities in telecommunications are highlighted below.1. COMMISSION APPROVES MERGER TRANSACTION AMONGVERIZON HAWAII, CERTAIN VERIZON AFFILIATES, AND6 In July 20<strong>05</strong>, the <strong>Commission</strong> approved TGC’s request to establish a rate schedule toprovide gas utility service to residential customers on the island of Lanai. Decision and OrderNo. 21913, filed July 8, 20<strong>05</strong>, in Docket No. <strong>05</strong>-0131.
<strong>Public</strong> <strong>Utilities</strong> <strong>Commission</strong> <strong>Annual</strong> Report <strong>2004</strong>-<strong>05</strong>State of Hawaii Page 17HAWAIIAN TELCOM COMMUNICATIONS, INC.(“HT COMMUNICATIONS”).In March 20<strong>05</strong>, the <strong>Commission</strong> approved, by a 2-1 vote, the merger transaction bywhich TC Group L.L.C., dba The Carlyle Group (“Carlyle”), through its affiliates, acquired controlover Verizon Hawaii and other assets. HT Communications, which was formed expressly for thepurpose of consummating the proposed merger transaction, owns all of the outstanding stock ofVerizon Hawaii, now known as Hawaiian Telcom. HT Communications is wholly-owned byHT HoldCo which is controlled by affiliates of Carlyle. The base purchase price of the transfer ofcontrol was initially proposed as $1.65 billion, but was voluntarily adjusted to $1.6 billion followingthe <strong>Commission</strong>'s conditional approval of the merger transaction.The <strong>Commission</strong> approved the merger transaction provided that the following conditions,among other things, are adhered and/or agreed to: (1) Hawaiian Telcom commits to not submit ageneral utility rate increase application utilizing a prospective test year earlier than calendar year2009; (2) the general rate increase moratorium shall not preclude the filing of proposed tariffchanges for regulated services that are revenue neutral; (3) each residential and business retailaccess line customer shall receive a customer appreciation bill credit of approximately $20.70 perqualifying access line; (4) the terms and conditions of the stipulation filed by HT Communicationsand Time Warner Telecom of Hawaii, L.P., dba Oceanic Communications (“Oceanic”), asamended; (5) infusion of additional equity as necessary to achieve a consolidated capitalstructure of 76.3 per cent debt and 23.7 per cent equity; (6) any dividend proceeds shall beearmarked specifically and used only for debt repayment and dividend payments shall not bemade until Hawaiian Telcom’s debt is reduced to 65 per cent, without prior <strong>Commission</strong> approval;and (7) to obtain the <strong>Commission</strong>’s approval before selling, divesting, transferring, mortgaging, orencumbering the directory assets.2. COMMISSION APPROVES MERGER OF SPRINT CORPORATION(“SPRINT”) AND NEXTEL COMMUNICATIONS, INC. (“NEXTEL”).In April 20<strong>05</strong>, the <strong>Commission</strong> approved an application filed by Sprint CommunicationsCompany, L.P. (“Sprint Communications”), Sprint Payphone Service, Inc. (“Sprint Payphone”),and ASC Telecom, Inc. (“ASC Telecom”) which proposed the merger of Sprint and Nextel. Sprintwill be renamed Sprint-Nextel Corporation upon completion of the merger. SprintCommunications is authorized to provide intrastate telecommunications services in Hawaii as afacilities-based carrier and reseller. It also is the exclusive provider of intrastatetelecommunications relay services (“TRS”) in Hawaii from July 1, 2003 to June 30, 2006. SprintPayphone holds a certificate of registration (“COR’) to provide intrastate pay telephone servicesin the State. ASC Telecom is authorized to provide intrastate telecommunications services withinthe State as a reseller. Nextel is not providing any intrastate telecommunications services in theState.3. COMMISSION APPROVES MERGER OF SBC COMMUNICATIONSINC. (“SBC”) AND AT&T CORP. (“AT&T”).In May 20<strong>05</strong>, the <strong>Commission</strong> approved the merger of AT&T and a wholly-ownedsubsidiary of SBC. The merged entity will retain the AT&T name. AT&T Communications ofHawaii, Inc. (“AT&T Hawaii”) will remain a wholly-owned subsidiary of AT&T. AT&T Hawaii is anauthorized provider of intrastate telecommunications services in the State on a facilities-basedand resold basis.
<strong>Public</strong> <strong>Utilities</strong> <strong>Commission</strong> <strong>Annual</strong> Report <strong>2004</strong>-<strong>05</strong>State of Hawaii Page 184. COMMISSION CERTIFICATES NEW TELECOMMUNICATIONSCARRIERS.The <strong>Commission</strong> certificated 19 new telecommunications companies in the Fiscal <strong>Year</strong>,including 14 resellers of various intrastate wireless, calling card, and interexchange(long-distance) telecommunications services; 1 provider of wireless services; 1 facility-basedprovider/reseller; and 3 providers of payphone services.5. COMMISSION APPROVES INTERNET PROTOCOL (“IP”) VOICESERVICES.In October <strong>2004</strong>, the <strong>Commission</strong> granted Time Warner Cable Information Services(Hawaii) LLC (“TWCIS”) a certificate of authority (“COA”) to provide intrastate telecommunicationsservices in the State as a reseller and facilities-based carrier. TWCIS plans to provide local andlong distance IP voice services (aka, Voice over Internet Protocol or VoIP) targeted to Hawaiicustomers who reside in Time Warner Entertainment Company, L.P., dba Oceanic Time WarnerCable’s Road Runner service areas. In addition to calling other subscribers, subscribers of theVoIP services will be able to call and be called by anyone connected to the public switchedtelephone network.6. COMMISSION APPROVES REQUEST TO DISCONTINUECONFERENCE CONNECTIONS SERVICE.In July <strong>2004</strong>, the <strong>Commission</strong> approved Verizon Hawaii’s request to discontinue itsConference Connections service. Conference Connections is a discretionary service usednormally by Verizon Hawaii’s business customers to connect three (3) or more users through aconference bridge to converse with one another simultaneously. The manufacturer of VerizonHawaii’s Conference Connections service equipment discontinued the line of equipment used byVerizon Hawaii and ended all technical support by the end of June <strong>2004</strong>. The demand for thisservice has dramatically declined due to the existence of more efficient and convenientconferencing services.7. COMMISSION APPROVES INTERCONNECTION AGREEMENTS.The Federal Telecommunications Act of 1996 and Section 6-80-54, HAR, requiretelecommunications service providers to submit to the <strong>Commission</strong> for review and approval anyagreements for access, interconnection, unbundling, or network termination adopted bynegotiation or arbitration.During the Fiscal <strong>Year</strong>, the <strong>Commission</strong> approved the following interconnectionagreements and amended agreements between telecommunications service providers andVerizon Hawaii:Think 12 Corporation, dba Hello Depot (“Hello Depot”). In July <strong>2004</strong>, the<strong>Commission</strong> approved the negotiated interconnection agreement andamendment to the interconnection agreement between Verizon Hawaii and HelloDepot. The scope of the agreement includes interconnection, resale, networkelements, collocation and other services. The amendment proposes to giveeffect to the provisions of the FCC Triennial Review Order. Hello Depot is areseller of telecommunications services in the State.Pacific LightNet Inc. (“Pacific LightNet”). In August <strong>2004</strong>, the <strong>Commission</strong>approved the fourth amendment to the interconnection agreement betweenVerizon Hawaii and Pacific LightNet. The amendment proposes to give effect toprovisions of the FCC Triennial Review Order. Pacific LightNet is authorized to
<strong>Public</strong> <strong>Utilities</strong> <strong>Commission</strong> <strong>Annual</strong> Report <strong>2004</strong>-<strong>05</strong>State of Hawaii Page 19provide facilities-based local exchange and long distance telecommunicationsservices in the State.AT&T Wireless of Hawaii Inc. (“AWS”). In September <strong>2004</strong>, the <strong>Commission</strong>approved the third amendment to the interconnection agreement betweenVerizon Hawaii and AWS. The amendment allows AWS to provide enhanced911 (“E911”) service to its end users and customers using systems anddatabases established and maintained by Verizon Hawaii. AWS is a certifiedprovider of commercial radio mobile services (“CMRS”) in the State.American Fiber Network, Inc. (“AFN”). In December <strong>2004</strong>, the <strong>Commission</strong>approved the amendment to the interconnection agreement between VerizonHawaii and AFN. The amendment clarifies that Verizon Hawaii is only obligatedto provide AFN access to unbundled network elements (“UNEs”) andcombinations of UNEs to the extent as required by the Federal unbundling rules.AFN is an authorized provider of facilities-based and resold telecommunicationsservices in the State.Southwestern Bell Communications, Inc., dba SBC Long Distance(“SBCS”). In January 20<strong>05</strong>, the <strong>Commission</strong> approved SBCS’ adoption of thenegotiated interconnection agreement between Hello Depot and Verizon Hawaiiand the amendment to the interconnection agreement. SBCS is a reseller andfacilities-based carrier of intrastate telecommunications services in the State.Level 3 Communications, LLC (“Level 3”). In January 20<strong>05</strong>, the <strong>Commission</strong>approved the second amendment to the interconnection agreement betweenVerizon Hawaii and Level 3. The amendment establishes new terms andconditions that govern the rights and obligations of Verizon Hawaii and Level 3with regards to intercarrier compensation and interconnection architecture.Level 3 is an authorized provider of facilities-based and resoldtelecommunications services in the State.CommPartners, LLC (“CommPartners”). In February 20<strong>05</strong>, the <strong>Commission</strong>granted approval of CommPartners’ adoption of the negotiated interconnectionagreement between Hello Depot and Verizon Hawaii and the amendment to theinterconnection agreement. CommPartners is an authorized reseller andfacilities-based carrier of telecommunications services in the State.AT&T Communications of Hawaii, Inc. (“AT&T”). In March 20<strong>05</strong>, the<strong>Commission</strong> approved the second amendment to the interconnection agreementbetween Verizon Hawaii and AT&T. The amendment reflects changes to certainintercarrier compensation, interconnection architecture and other related matters.AT&T is an authorized provider of intrastate telecommunications services in theState.Coral Wireless (“Coral”). In May 20<strong>05</strong>, the <strong>Commission</strong> granted approval ofCoral’s adoption of the negotiated interconnection agreement between VerizonHawaii and NPCR Inc., dba Nextel Partners and the amendment to theinterconnection agreement. Coral is an authorized CMRS provider of intrastatewireless telecommunications services in the State.MCImetro Access Transmission Services LLC (“MCImetro”). In June 20<strong>05</strong>,the <strong>Commission</strong> approved the second amendment to the interconnectionagreement between Verizon Hawaii and MCImetro. The amendment modifiesthe interconnection agreement by establishing new monthly recurring chargesthat MCImetro agrees to pay Verizon Hawaii for DS0 UNE-P (or unbundled
<strong>Public</strong> <strong>Utilities</strong> <strong>Commission</strong> <strong>Annual</strong> Report <strong>2004</strong>-<strong>05</strong>State of Hawaii Page 20network element-platform) lines in service in the State as of March 10, 20<strong>05</strong>.MCImetro is an authorized provider of telecommunications services in the State.8. COMMISSION APPROVES TARIFF CHANGES.During the Fiscal <strong>Year</strong>, the <strong>Commission</strong> approved the following tariff changes for VerizonHawaii:Local Package Plus (“LPP”). In August <strong>2004</strong>, the <strong>Commission</strong> approvedVerizon Hawaii’s request to make LPP (now known as Verizon RegionalPackage Extra (“VRPE”)) a permanent offering. In May 2003, the <strong>Commission</strong>initially approved Verizon Hawaii’s LPP offering on a one-year promotional basis.LPP telecommunications services includes residential line, touch call, unlimiteddirectory assistance (“DA”), up to 14 custom calling features, optional residentialhome voice mail, and unlimited inter-island toll.Wireless E911 Service. In March 20<strong>05</strong>, the <strong>Commission</strong> approved VerizonHawaii’s tariff proposal to establish wireless E911 service throughout the State.Verizon Hawaii proposes to establish wireless E911 service in accordance withPhases I and II of Title 47, Part 20, Code of Federal Regulations, CommercialMobile Radio Services. Phases I and II addresses the problem of identifying thelocation of wireless telephones by enabling the transfer of location informationfrom the wireless service providers to a <strong>Public</strong> Safety Answering Point (“PSAP”).A PSAP routes a 911 telephone call to the appropriate emergency responseteam (i.e., police, fire department, ambulance).9. COMMISSION OVERTURNS POOLING ADMINISTRATOR’S(“PA’s”) DENIAL.In August <strong>2004</strong>, the <strong>Commission</strong> overturned the PA’s denial of MCImetro’s June 16, <strong>2004</strong>request for numbering resources, provided that MCImetro is only authorized to receive and/orretain 1,000 numbers from each of the six (6) central office code thousands-block codes to servethe six (6) rate centers of Honolulu, Hilo, Lihue, Wailuku, Kaunakakai, and Lanai City on theislands of Oahu, Hawaii, Kauai, Maui, Molokai, and Lanai, respectively. MCImetro’s new Hawaiiswitch will be used to provide voice service to customers in these rate centers.10. COMMISSION ESTABLISHES TRS CONTRIBUTION FACTORAND FUND SIZE.In May 2003, the <strong>Commission</strong> required every telecommunications carrier in Hawaii tocontribute to the intrastate TRS fund. A carrier’s contribution to the TRS fund is a product of itsgross operating revenues from the retail provision of intrastate telecommunications service duringthe preceding calendar year and a contribution factor determined annually by the <strong>Commission</strong>.For the period July 1, <strong>2004</strong> to June 30, 20<strong>05</strong>, the contribution factor was 0.0010.In April 20<strong>05</strong>, the <strong>Commission</strong> initiated a proceeding to examine whether to modify theTRS carrier contribution factor and fund size for the period July 1, 20<strong>05</strong> to June 30, 2006. InMay 20<strong>05</strong>, the <strong>Commission</strong> adopted its proposal to continue the existing carrier contributionfactor and TRS fund size. The contribution factor for the period July 1, 20<strong>05</strong> to June 30, 2006is 0.0010. The projected TRS fund size for the same period is approximately $680,000.
<strong>Public</strong> <strong>Utilities</strong> <strong>Commission</strong> <strong>Annual</strong> Report <strong>2004</strong>-<strong>05</strong>State of Hawaii Page 2111. COMMISSION APPROVES TIME WARNER TELECOM OF HAWAIIDBA OCEANIC COMMUNICATIONS (“OCEANIC”) FINANCING.In April 20<strong>05</strong>, the <strong>Commission</strong> approved the issuance by Time Warner Telecom,Holdings, Inc. (“TWTH”), Oceanic’s general partner, of a proposed debt financing. In the firstquarter of <strong>2004</strong>, TWTH closed on the debt financing approved by the <strong>Commission</strong> during lastfiscal year and, as part of the debt financing, offered $200 million in the 2014 unsecured notes.TWTH intends to follow up on the <strong>2004</strong> offering by an additional offering of the 2014 unsecurednotes. In the proposed debt financing, the additional offering, when combined with the <strong>2004</strong>offering, may result in the total issuance of up to $600 million of the 2014 unsecured notes. Theproceeds will be used to redeem a significant portion, or all, of Time Warner Telecom, Inc.’ssenior notes that are due in 2008.12. COMMISSION APPROVES CAPITAL EXPENDITURES.Prior to July 1, <strong>2004</strong>, telecommunications carriers were required by the <strong>Commission</strong>’sadministrative rules to obtain approval for all CIP expenditures over $500,000. Similar to thethreshold applicable to electric utilities, effective July 1, <strong>2004</strong>, the threshold fortelecommunications utilities increased from $500,000 to $2.5 million. Accordingly, beginning thisFiscal <strong>Year</strong>, only those applications requesting approval for CIP expenditures over $2.5 millionmust be submitted to the <strong>Commission</strong> for review. In the Fiscal <strong>Year</strong>, the <strong>Commission</strong> approvedexpenditures totaling over $17 million for Verizon Hawaii’s CIPs.Verizon Hawaii was authorized to expend $15.5 million for the Alakea fire sprinklerproject, $0.9 million for the construction of feeder facilities in lower Mapunapuna and airportareas, and $0.7 million for the E911 service replacement project. Figure 3 shows the total dollarvalue of <strong>Commission</strong>-approved telecommunications utility CIPs during the past five (5) years.
<strong>Public</strong> <strong>Utilities</strong> <strong>Commission</strong> <strong>Annual</strong> Report <strong>2004</strong>-<strong>05</strong>State of Hawaii Page 22Figure 3Five-<strong>Year</strong> Comparison of <strong>Commission</strong>-ApprovedTelecommunications Utility CIP$18,000,000$16,000,000$14,000,000$12,000,000CIP Amount$10,000,000$8,000,000$6,000,000$4,000,000$2,000,000$-FY 2000-01 FY 2001-02 FY 2002-03 FY 2003-04 FY <strong>2004</strong>-<strong>05</strong>Verizon Hawaii/Hawaiian Telcom $6,089,171 $3,019,288 $1,734,200 $- $17,090,401FYE. PRIVATE WATER AND SEWAGE UTILITIES PROCEEDINGS.The <strong>Commission</strong> regulates 36 privately owned water and sewage treatment utilities thatserve suburban, rural, and resort areas throughout the State. The majority of these utilities arelocated on the neighbor islands.During the Fiscal <strong>Year</strong>, the <strong>Commission</strong>’s key proceedings in this area included ratecases and requests for Certificates of <strong>Public</strong> Convenience and Necessity (“CPCNs”).1. COMMISSION APPROVES RATE INCREASES.During this Fiscal <strong>Year</strong>, the <strong>Commission</strong> approved rate increases for the following waterand sewage utilities:MOSCO, Inc (“MOSCO”). In August <strong>2004</strong>, the <strong>Commission</strong> approvedMOSCO’s request for a rate increase of $92,928 in additional revenues.MOSCO’s increase in rates consist of increases in its monthly flat rate chargefrom $22 to $44 per unit and its minimum charge for inspecting a serviceconnection and its deposit fee. MOSCO provides wastewater service in itsservice area of Kaluakoi on the island of Molokai.
<strong>Public</strong> <strong>Utilities</strong> <strong>Commission</strong> <strong>Annual</strong> Report <strong>2004</strong>-<strong>05</strong>State of Hawaii Page 23Hawaii Water Service Company, Inc. (“HWSCI”). In February 20<strong>05</strong>, the<strong>Commission</strong> approved a rate increase of $238,500 in additional revenues forHWSCI. The <strong>Commission</strong> approved the parties’ stipulation, in part, and denied it,in part. It disallowed the inclusion of the costs of the two (2) new wells inHWSCI’s test year plant-in-service and rejected the parties’ proposed ratedesign. The <strong>Commission</strong> instructed HWSCI to submit a new rate schedule. InApril 20<strong>05</strong>, the <strong>Commission</strong> approved the parties’ primary rate design, asproposed in their stipulated rate design. The rate increase consists of increasesin the monthly standby charge by 22.4 per cent and the monthly waterconsumption charge by 6.5 per cent. HWSCI provides water service in itsservice area of Kaanapali on the island of Maui.Puhi Sewer & Water Co., Inc. (“Puhi”). In August <strong>2004</strong>, the <strong>Commission</strong>approved the parties’ stipulated agreement providing a rate increase of $449,392in additional revenues for Puhi. The parties agreed to a three (3)-year phase-inperiod for the 65 per cent rate increase. Puhi provides wastewater collection andtreatment services to residential, commercial and industrial customers within itsservice territory on the island of Kauai.Waikoloa Water Company, Inc., dba West Hawaii Water Company(“Waikoloa Water”). In June 20<strong>05</strong>, the <strong>Commission</strong> granted Waikoloa Water ageneral rate increase of $23,759 in additional revenues. The <strong>Commission</strong>authorized an increase in Waikoloa Water’s fixed monthly charges and monthlyconsumption charges. The <strong>Commission</strong> granted this rate increase in a proposeddecision and order. 72. COMMISSION APPROVES NEW AND AMENDED CPCNS.During the Fiscal <strong>Year</strong>, the <strong>Commission</strong> approved the following new and amendedCPCNs for water and sewage utilities:Makena Wastewater Corp. (“MWC”). In September <strong>2004</strong>, the <strong>Commission</strong>granted MWC a CPCN to provide wastewater treatment services for a masterplanneddevelopment project developed by Makena Resort Corporation in theMakena area on the island of Maui.North Shore Wastewater Treatment, L.L.C. (“NSWT”). In June 20<strong>05</strong>, the<strong>Commission</strong> granted NSWT a CPCN to provide wastewater service within itsproposed service area in Kahuku on the island of Oahu.Kukio Utility Company, LLC (“Kukio”). In May 20<strong>05</strong>, the <strong>Commission</strong>approved Kukio’s application to expand its existing service territory to providewater and wastewater service to certain additional properties. Prior to the<strong>Commission</strong> approval, Kukio’s existing service territory consisted of Phase 1 of amaster planned community known as the Kukio Beach Club on the island ofHawaii. Kukio will expand its authorized service territory to include portions of:(1) Phase 2 of the master planned community, (2) Phase 3 north and south of the7 The <strong>Commission</strong> granted this rate increase in a proposed decision and order, asmandated by Act 168, SLH <strong>2004</strong> (“Act 168”). Act 168 streamlines the rate review process forpublic utilities with annual gross revenues under $2 million. The <strong>Commission</strong> is required to issueits decision within six (6) months from the filing date of a general rate increase application. InJuly 20<strong>05</strong>, the <strong>Commission</strong> adopted its proposed decision and order approving Waikoloa Water’sgeneral rate increase.
<strong>Public</strong> <strong>Utilities</strong> <strong>Commission</strong> <strong>Annual</strong> Report <strong>2004</strong>-<strong>05</strong>State of Hawaii Page 24master planned community, (3) the Manini’owali subdivision, and (4) the State ofHawaii’s Kua Bay Beach Park. The <strong>Commission</strong> also approved Kukio’s requestto establish a bulk rate for the sale of water from Kukio’s system to the Kukio Golfand Beach Club.3. COMMISSION APPROVES TRANSFER OF POIPU WATERRECLAMATION FACILITY (‘PWRF”).In September <strong>2004</strong>, the <strong>Commission</strong> approved the transfer of Obayashi HawaiiCorporation’s (“OHC”) and Marriott Ownership Resorts, Inc.’s (“MORI”) respective interests in thePWRF to HOH <strong>Utilities</strong>, LLC (“HOH”). The <strong>Commission</strong> also approved the amendment of HOH’sCPCN to expand HOH’s service territory to cover the properties controlled, or previouslycontrolled by OHC and MORI. HOH’s expanded service territory includes two (2) hotels, theKauai Sheraton Resort and Marriott Resort. HOH provides wastewater treatment services in thePoipu area on the island of Kauai.4. COMMISSION APPROVES TRANSFER AND SALE OFPRINCEVILLE UTILITIES COMPANY, INC. (“<strong>PUC</strong>I”).In January 20<strong>05</strong>, the <strong>Commission</strong> approved the transfer and sale of <strong>PUC</strong>I’s stock fromPrinceville Corporation to Princeville <strong>PUC</strong>, LLC. The <strong>Commission</strong> also approved the terms of theloan agreement between Princeville Associates, LLC and Princeville <strong>PUC</strong>, LLC, in an amount notto exceed $4 million, to finance the acquisition of new water facilities. <strong>PUC</strong>I provides water andwastewater utility services within the Princeville resort and community service area on the islandof Kauai.5. COMMISSION APPROVES HWSCI FINANCING.In August <strong>2004</strong>, the <strong>Commission</strong> approved HWSCI’s financing request to issue $556,000and $2.2 million in long-term debt. The loan amount of $556,000 will be used to fund testyear <strong>2004</strong> capital improvements. The $2.2 million in loan amounts will be used to fund additionalcapital improvements and to maintain a reasonable capital structure of both debt and equity.6. COMMISSION APPROVES WAIKOLOA RESORT UTILITIES, INC.DBA WEST HAWAII UTILITY COMPANY (“WHUC”) FINANCING.In April 20<strong>05</strong>, the <strong>Commission</strong> approved WHUC’s request to enter into a $4,550,000construction and term loan with HomeStreet Bank and to mortgage or encumber certain assetsassociated with the proposed financing arrangements. The loan proceeds will be used to financethe costs for the construction of two (2) 2.5 million gallon potable water storage tanks. The tanksare needed to meet storage capacity requirements for the Waikoloa Resort complex. WHUC isauthorized to provide water (including irrigation water to two (2) golf courses) and wastewaterservices to the Waikoloa Beach Resort area on the island of Hawaii.F. TRANSPORTATION CARRIERS PROCEEDINGS.1. MOTOR CARRIERS.The <strong>Commission</strong> regulates passenger and property motor carriers. Passenger carriersare classified by authorized vehicle seating capacity. They include tour companies, limousineservices, and other transportation providers. Property carriers are classified by the types ofcommodities transported and the nature of services performed, namely: general commodities,household goods, commodities in dump trucks, and specific commodities.
<strong>Public</strong> <strong>Utilities</strong> <strong>Commission</strong> <strong>Annual</strong> Report <strong>2004</strong>-<strong>05</strong>State of Hawaii Page 25By law, certain transportation services, including, without limitation, taxis, school and citybuses, ambulance services, refuse haulers, farming vehicles, and persons transporting personalproperty, are exempt from <strong>Commission</strong> regulation.Many of the State’s motor carriers are members of either the Western Motor TariffBureau, Inc. (“WMTB”) or the Hawaii State Certified Common Carriers Association (“HSCCCA”).WMTB and HSCCCA are nonprofit organizations engaged in the research, development, andpublication of motor carrier tariffs. The two organizations represent their members in ratemakingproceedings before the <strong>Commission</strong>.In accordance with its statutory requirements, the <strong>Commission</strong> performs the followingfunctions in the regulation of motor carriers: (1) certification and licensing; (2) ratemaking; and(3) business regulation. During the Fiscal <strong>Year</strong>, the <strong>Commission</strong> issued many new certificatesand licenses, reviewed requested rate increases, and extended the zone of reasonableness pilotprogram for motor carriers.a. COMMISSION APPROVES NEW MOTOR CARRIERCERTIFICATIONS.The <strong>Commission</strong> regulates 531 passenger carriers and 384 property carriers in the State.During the Fiscal <strong>Year</strong>, new certificates or permits were issued to 98 motor carriers—61 passenger carriers and 37 property carriers.In this Fiscal <strong>Year</strong>, the number of authorized property carriers increased slightly over theprevious fiscal year, as shown in Figure 4.Figure 4Regulated Motor Carriers60<strong>05</strong>00Number of Motor Carriers40030020010002002-03 2003-04 <strong>2004</strong>-<strong>05</strong>Property Carriers 385 375 384Passenger Carriers 530 533 531FY
<strong>Public</strong> <strong>Utilities</strong> <strong>Commission</strong> <strong>Annual</strong> Report <strong>2004</strong>-<strong>05</strong>State of Hawaii Page 26b. COMMISSION EXTENDS ZONE OF REASONABLENESSPILOT PROGRAM FOR MOTOR CARRIERS.In August 2003, the <strong>Commission</strong> opened an investigation to examine the feasibility ofestablishing a zone of reasonableness for passenger and property motor carriers. Under such amechanism, specific increases or decreases in a carrier’s rates and charges within an establishedzone of reasonableness would be automatically approved, if the requested changes fall within thezone or range authorized by the <strong>Commission</strong> for that carrier’s operations. In December 2003, the<strong>Commission</strong> established a one (1)-year zone of reasonableness pilot program governing the<strong>Commission</strong>’s motor carrier rate review and approval process. The zone of reasonablenessconsists of points within the range of plus or minus ten (10) per cent from a motor carrier’s baserate.In December <strong>2004</strong>, the <strong>Commission</strong> extended the zone of reasonableness pilot programgoverning the <strong>Commission</strong>’s motor carrier rate review and approval process, as approved by the<strong>Commission</strong> in its 2003 decision, for an additional three (3) calendar years, from January 1, 20<strong>05</strong>up to and including December 31, 2007. In each year of the pilot program, a motor carrier’s baserate is the applicable, approved tariff rate on file with the <strong>Commission</strong>, effective as of January 1 ofthat year. The <strong>Commission</strong> reserves the right, at any time, to adjust or change the zone ofreasonableness or terminate the zone of reasonableness.c. COMMISSION REVIEWS REQUESTS FOR RATE CHANGES.During the Fiscal <strong>Year</strong>, the <strong>Commission</strong> reviewed and approved rate increases anddecreases within and outside of the zone of reasonableness pilot program which went into effecton January 1, <strong>2004</strong>. During the Fiscal <strong>Year</strong>, all WMTB motor carriers filed requests for ratechanges. Of the independent motor carriers, the <strong>Commission</strong> reviewed and approved requestsfrom 31 motor carriers. None of the motor carriers belonging to HSCCCA filed requests for ratechanges. The <strong>Commission</strong> reviewed and approved the following motor carrier increases anddecreases:Rate Changes Within the Ten (10) Per Cent Zone Limit. For the rate changes thatwere within the zone limit of ten (10) per cent, most were for rate increases of seven (7) orten (10) per cent. Other rate increases ranged from less than one (1) to six (6) per cent. The ratechanges of only one (1) motor carrier included rate decreases. The <strong>Commission</strong> approved thefollowing motor carrier increases and decreases within the zone:Dump TruckType of Carrier/Company (County)Rate Increase orDecreaseDump Truck (Hawaii) 7.00%Dump Truck - selected rates (Hawaii) 2.80%Kona Transportation, Inc. (Hawaii) 5.70%Kona Transportation, Inc. - selected rates (Hawaii) 4.40%Dump Truck (Hawaii) 2.80%Pomaika’i Transport Services, Inc. dba P.T.S.I. (Oahu) 10.00%Conen’s Freight Transport, Inc. (Hawaii) 10.00%Kalaka Nui, Inc. (Oahu, Hawaii, Maui, Kauai) 7.00%Mamo K. Laranang dba Double H Trucking Co. - selectedrates (Hawaii)7.96%, 10.00%
<strong>Public</strong> <strong>Utilities</strong> <strong>Commission</strong> <strong>Annual</strong> Report <strong>2004</strong>-<strong>05</strong>State of Hawaii Page 27Type of Carrier/Company (County)Rate Increase orDecreaseDump Truck (Oahu) 10.00%Dump Truck (Maui) 10.00%Dump Truck (Kauai) 10.00%Dump Truck (Hawaii) 10.00%Kona Transportation Co., Inc. - selected rates (Hawaii) 6.00%Mamo K. Laranang dba Double H Trucking Co. - selected rates(Hawaii)3.42%, 2.80%, 3.41%,10.00%, 9.78%Ed Yamashiro, Inc. - selected rates (Oahu) 10.00%Rodney Everett Wilbur dba R & C Hauling - selected rates (Hawaii) 2.80%Big Island Topsoil, LLC (Oahu, Maui, Kauai, Hawaii) 10.00%Matsuyama Brothers Trucking, Inc. (Hawaii) 10.00%Pineridge Farms, Inc. (Oahu) 4.49% to 10.00%Pineridge Farms, Inc. (Maui) 10.00%Rodney Everett Wilbur dba R & C Hauling (Hawaii) 10.00%R.H.S. Lee, Inc. (Oahu) 10.00%Tri Isle, Incorporated dba Valley Isle Express, and dba HaleakalaTransportation & Warehousing (Maui)6.00%Nick’s Hauling Services, LLC (Hawaii) 10.00%General CommoditiesKona Transportation, LLC (Hawaii) 2.81%General Commodities (Hawaii) 2.80%Pomaika’i Transport Services, Inc. dba P.T.S.I. (Oahu) 7.00%Pomaika’i Transport Services, Inc. dba P.T.S.I. - selected rates(Oahu)8.00%Conen’s Freight Transport, Inc. (Hawaii) 10.00%Conen’s Freight Transport, Inc. - selected rates (Hawaii) 5.92%Tri Isle, Incorporated dba Valley Isle Express, and dba HaleakalaTransportation & Warehousing - selected rates (Maui)1.90%Mihara Transfer, Inc. (Hawaii) 10.00%International Express, Inc. (Oahu) 5.00%Kalaka Nui, Inc. (Oahu, Hawaii, Maui, Kauai) 7.00%Mamo K. Laranang dba Double H Trucking Co. (Hawaii) 10.00%General Commodities (Oahu) 8.50%Hawaii Transfer Co., Ltd. (Oahu) 5.50%General Commodities (Maui) 10.00%General Commodities (Kauai) 10.00%General Commodities (Hawaii) 10.00%Kona Transportation Co., Inc. - selected rates (Hawaii) 6.00%Mamo K. Laranang dba Double H Trucking Co. - selected rates(Hawaii)10.00%, 2.48%,2.80%Island Movers, Inc. (Maui) 8.00%
<strong>Public</strong> <strong>Utilities</strong> <strong>Commission</strong> <strong>Annual</strong> Report <strong>2004</strong>-<strong>05</strong>State of Hawaii Page 28Type of Carrier/Company (County)Rate Increase orDecreaseKuwaye Trucking Inc. (Hawaii) 8.50%Pomaika’i Transport Services, Inc. dba P.T.S.I. - selected rates(Oahu)10.00%Direct Support Services, Inc. dba DSR - selected rates (Oahu) 9.50%Ed Yamashiro, Inc. - selected rates (Oahu) 10.00%Rodney Everett Wilbur dba R & C Hauling - selected rates (Hawaii) 2.80%Martin Transportation, Inc. fka Martin Warehousing & Distribution,Inc. (Oahu)8.50%Big Island Topsoil., LLC (Oahu, Maui, Kauai, Hawaii) 10.00%Matsuyama Brothers Trucking, Inc. (Hawaii) 10.00%Pineridge Farms, Inc. - selected rates (Oahu) 8.50%, 10.00%Pineridge Farms, Inc. - selected rates (Maui) 10.00%Rodney Everett Wilbur dba R & C Hauling (Hawaii) 10.00%Xpress Trucking, Inc. (Oahu, Maui) 8.50%B B Delivery Service, Inc. (Maui) 10.00%R.H.S. Lee, Inc. (Oahu) 10.00%Tri Isle, Incorporated dba Valley Isle Express, and dba HaleakalaTransportation & Warehousing (Maui)6.00%Tri Isle, Incorporated dba Valley Isle Express, and dba HaleakalaTransportation & Warehousing - selected rates (Maui) 10.00%Nick’s Hauling Services, LLC (Hawaii) 10.00%Household GoodsAll American Moving, Inc. - selected rates (Oahu) 7.49%, 7.00%Kona Transportation Co., Inc. (Statewide) 6.00%Kona Transportation Co., Inc. - selected rates (Statewide) 10.00%Household Goods (Statewide) 2.80%Island Movers, Inc. & Kona TransportationCo., Inc. (Statewide)0.90%Pomaika’i Transport Services dba P.T.S.I. (Oahu) 7.00%Royal Hawaiian Movers, Inc. dba Royal Hawaiian Trucking &Warehousing - selected rates (Oahu, Maui, Hawaii)2.80%Mihara Transfer, Inc. (Hawaii) 10.00%Household Goods (Statewide) 6.00%Royal Hawaiian Movers, Inc. dba Royal Hawaiian Trucking &Warehousing (Oahu, Maui, Kauai)Sherman Enterprises, Inc. dba City Wide Transportation Company(Oahu)8.97%5.00%OtherSpecial Freight (Oahu) 8.50%Special Freight – Hawaii Transfer Co., Ltd. (Oahu) 5.50%
<strong>Public</strong> <strong>Utilities</strong> <strong>Commission</strong> <strong>Annual</strong> Report <strong>2004</strong>-<strong>05</strong>State of Hawaii Page 29Type of Carrier/Company (County)Rate Increase orDecreaseBreak Bulk and DeliveryConen’s Freight Transport, Inc. (Hawaii) 10.00%Pacific Transfer LLC (Oahu) 7.00%International Express, Inc. (Oahu) 5.00%Break Bulk and Delivery (Statewide) 8.50%Break Bulk and Delivery (Kauai) 10.00%Break Bulk and Delivery (Hawaii) 10.00%Kona Transportation Co., Inc. – selected rates (Hawaii) 6.00%Island Movers, Inc. – selected rates (Oahu, Maui) 7.00%Kuwaye Trucking Inc. (Hawaii) 8.50%Hawaii Transfer Co., Ltd. (Oahu) 5.50%Xpress Trucking, Inc. (Oahu, Maui) 8.50%Sherman Enterprises, Inc. dba City Wide Transportation Company(Oahu)5.00%PassengerPassenger (Statewide) 2.80%Jack’s Tours, Inc. (Hawaii) 2.80%Elite Limousine Service, Inc. (Oahu) 5.00%CNA Senior Transport, LLC (Oahu) 10.00%Akina Aloha Tours, Inc. – selected rates (Maui) 2.80%Akina Bus Service, Ltd. – selected rates (Maui) 2.80%RDH Transportation Services, Inc. – selected rates (Oahu) 7.00%Aloha State Tour & Transportation Co., Ltd. (Oahu) 7.00%Arthur’s-Star 21, Inc. dba Maui Classic Coach and dba Arthur’sLimousine Service – selected rates (Maui)6.06%, between 5.53%& -9.85%, between4.20% & -0.50%, 0.06%to 3.00%, between6.45% & -9.88%Hawaii Forest & Trail, Ltd. – selected rates (Hawaii) 4.10%, 2.50% to 6.90%Alexander C. Naumu dba Anytime Island Express (Kauai) 10.00%Passenger (Statewide) 7.00%Travel Plaza Transportation, LLC & PHT Inc. dbaPolynesian Hospitality (Statewide)7.00%Akina Aloha Tours, Inc. – selected rates (Maui) 9.09%, 10.00%, 1.54%to 7.69%, 7.00%, 7.07%,7.02%, 7.04%, 6.92%,6.83%, 9.96%, 9.93%,7.08%, 6.79%Akina Bus Service, Ltd. – selected rates (Maui) 9.09%, 10.00%, 1.54%to 7.69%, 7.00%, 7.11%Adventurous, LLC (Hawaii) 10.00%Raymond G. Foat dba Resort Shuttle – selected rates (Hawaii) 10.00%
<strong>Public</strong> <strong>Utilities</strong> <strong>Commission</strong> <strong>Annual</strong> Report <strong>2004</strong>-<strong>05</strong>State of Hawaii Page 30Type of Carrier/Company (County)Alexander C. Naumu dba Anytime Island Express – selected rates(Kauai)Rate Increase orDecrease10.00%Katherine Cole Ross dba Shark’s Tours – selected rates (Hawaii) 7.69%Rate Changes Outside the Ten (10) Per Cent Zone Limit. The <strong>Commission</strong> reviewsrequests for rate increases that do not fall within the zone of reasonableness. In its review ofthese requests, the <strong>Commission</strong> requests the motor carriers to submit financial statementscontaining the companies’ revenues, expenditures, and operating ratio. The <strong>Commission</strong>approves the rate increase or decrease based on an acceptable operating ratio reported in thefinancial statement. During the Fiscal <strong>Year</strong>, the <strong>Commission</strong> reviewed and approved thefollowing rate change that did not fall within the zone of reasonableness:PassengerType of Carrier/Company (County)Rate Increase orDecreaseRobert’s Tours & Transportation – selected rates (Oahu) 25.28%2. WATER CARRIERS.The <strong>Commission</strong> regulates four water carriers: Young Brothers, Limited (“YoungBrothers”), a provider of inter-island cargo service between all major islands; Sea Link of Hawaii,Inc., a passenger and cargo carrier providing water transportation services between the islands ofMaui and Molokai; Hone Heke Corporation (“Hone Heke”), a passenger and cargo carrierproviding water transportation services between the islands of Maui and Lanai; and HawaiiSuperferry, Inc. (“Hawaii Superferry”), a passenger and cargo carrier between the islands ofOahu and Kauai, Maui and Hawaii. Water carrier proceedings are summarized below.a. COMMISSION GRANTS HAWAII SUPERFERRY ACERTIFICATE.In December <strong>2004</strong>, the <strong>Commission</strong> granted Hawaii Superferry a CPCN to operate as acommon carrier by water of passengers and property, between the islands of Oahu and Kauai,Maui and Hawaii, subject to certain conditions set by the <strong>Commission</strong>. Hawaii Superferry isrequired to submit quarterly reports describing, among other things, the status of its progress inthe construction and delivery of its vessels and in any improvements undertaken at the harborfacilities, the costs of such improvements, and the status of its progress in securing theappropriate financing. Hawaii Superferry will develop and operate a high-speed roll-on/roll-offservice, using two (2) vessels.b. COMMISSION APPROVES CONTINUATION OF ZONE OFREASONABLENESS PILOT PROGRAM.In April 20<strong>05</strong>, the <strong>Commission</strong> approved the stipulation between Young Brothers and theConsumer Advocate which, among other things, agrees to extend the previously approved three(3)-year pilot program for an additional three (3) years, from December 20, <strong>2004</strong> to December 20,2007. The <strong>Commission</strong> also approved Young Brothers’ 2002 and 2003 cost of service studies,subject to the same terms and conditions set forth in the <strong>Commission</strong>’s order approving the 2001cost of service study. In December 2001, the <strong>Commission</strong> initially approved the three (3)-yearpilot program which authorizes Young Brothers to file for rate flexibility within an approved zone ofreasonableness.
<strong>Public</strong> <strong>Utilities</strong> <strong>Commission</strong> <strong>Annual</strong> Report <strong>2004</strong>-<strong>05</strong>State of Hawaii Page 31c. COMMISSION APPROVES YOUNG BROTHERS AMENDEDCOMMODITY RATES TARIFF.In May 20<strong>05</strong>, the <strong>Commission</strong> approved Young Brothers’ commodity rates tariff changeson a permanent basis. These tariff changes were previously approved by the <strong>Commission</strong> for aone (1)-year trial period from July 1, <strong>2004</strong> to June 30, 20<strong>05</strong>. The tariffs relate to the shipment ofcargo utilizing shipper-owned equipment and Young Brothers-owned equipment. For the tariffrelating to shipper-owned equipment, Young Brothers changed the method for calculating thecharge for the shipment of cargo utilizing shipper-owned platforms and added a long lengthpenalty for the shipment of cargo utilizing shipper-owned equipment. For the tariff relating toYoung Brothers-owned equipment, Young Brothers made certain non-substantive changesmaking the long length charges consistent in its tariff.G. ONE CALL CENTER PROCEEDINGS.The <strong>2004</strong> Legislature passed Act 141, SLH <strong>2004</strong> (“Act 141”), which establishes a one callcenter to coordinate the location of subsurface installations and to provide advance notice tosubsurface installation operators of proposed excavation work. Pursuant to Act 141, the<strong>Commission</strong> is required to establish a One Call Center advisory committee (“Committee”) toadvise the <strong>Commission</strong> on the implementation of Act 141. Act 141 requires that the <strong>Commission</strong>establish and begin administration of a One Call Center by January 1, 2006. The <strong>Commission</strong> isresponsible for awarding administration of the center to the provider it determines to be bestqualified to provide center services.1. COMMISSION ESTABLISHES ONE CALL CENTER ADVISORYCOMMITTEE.In August <strong>2004</strong>, the <strong>Commission</strong> instituted a proceeding to establish a Committee andappoint the members of the Committee. Pursuant to Act 141, the Committee shall be comprisedof 15 voting members and one ex officio nonvoting member. Of the 15 voting members, nine (9)voting members shall be appointed by the <strong>Commission</strong> and consist of: (1) one (1) member fromthe gas utility industry; (2) one (1) member from the electric utility industry; (3) one (1) memberfrom the telecommunications utility industry; (4) one (1) member from the pipeline operatorindustry; (5) two (2) members from the General Contractors Association of Hawaii (“GCA”);(6) two (2) members from the Building Industry Association of Hawaii (“BIA”); and (7) one (1)member from the cable service industry. 8 As requested by the <strong>Commission</strong>, the <strong>Utilities</strong> DamageTask Force (“Task Force”) submitted its list of recommended nominees to fill the nine (9) seats onthe Committee.In November <strong>2004</strong>, the <strong>Commission</strong> formally established the Committee and approvedthe Task Force’s recommended nominees submitted to the <strong>Commission</strong>. The <strong>Commission</strong>announced the 15 voting members comprised of representatives from the following: StevenGolden (gas utility industry); Ken T. Morikami (electric utility industry); Calvin Choy(telecommunications utility industry); Don Grimes (pipeline operator industry); Leonard Leong andSidney Quintal 9 (GCA); John Cheung and Ron Oshiro (BIA); Lance Uno (cable service industry);8 Act 141 specifies that the additional six (6) members are: the Director of the StateDepartment of Transportation ("DOT") or the Director's representative; (2) the Executive Directorof the Division of Consumer Advocacy or the Executive Director's representative; and (3) one (1)member from each of the counties of Maui, Kauai, Hawaii and the city and county of Honolulu,designated by the respective mayors.9 Sidney Quintal has been replaced by Randall Ching.
<strong>Public</strong> <strong>Utilities</strong> <strong>Commission</strong> <strong>Annual</strong> Report <strong>2004</strong>-<strong>05</strong>State of Hawaii Page 32Larry Leopardi 10 (City and County of Honolulu); Galen Kuba (County of Hawaii); Cary Yamashita(County of Maui); Wally Kudo (County of Kauai); Rodney Haraga 11 (Department of Transportationor “DOT”); and John Cole (Consumer Advocate).2. COMMISSION INSTITUTES A PROCEEDING TO SELECT A ONECALL CENTER PROVIDER.In April 20<strong>05</strong>, the <strong>Commission</strong> instituted a proceeding to (1) investigate the availability ofexperienced One Call Center providers; (2) select a One Call Center provider that it determines tobe best qualified to provide the services; and (3) name a new member to the Committeerepresenting the DOT. 12 The <strong>Commission</strong> recognized the DOT Director’s designatedrepresentative on the Committee.H. GASOLINE PRICE CAP PROCEEDINGS.The 2002 Legislature passed Act 77, SLH 2002, now codified as Chapter 486H, HRS,which established maximum pre-tax wholesale and retail prices on regular unleaded gasoline tobe sold in the State. In <strong>2004</strong>, the Legislature passed Act 242, SLH <strong>2004</strong>, which amendedChapter 486H, HRS, by: (1) changing the baseline for determining maximum pre-tax wholesalegasoline prices by using the average of the spot prices for regular unleaded gasoline for themarkets of New York Harbor, the United States Gulf Coast, and Los Angeles; (2) extendingmaximum pre-tax wholesale price limits to mid-grade and premium gasoline; (3) repealing themaximum pre-tax retail gasoline price; (4) establishing zones within the State and authorizing the<strong>Commission</strong> to adjust the maximum pre-tax wholesale gasoline prices in the various zones;(5) extending the effective date of the imposition of the maximum pre-tax wholesale gasolineprice limit to September 1, 20<strong>05</strong>; and (6) making an appropriation, to be expended by the<strong>Commission</strong>, for the purposes of implementing Chapter 486H, HRS.1. COMMISSION EXAMINES GASOLINE PRICE CAP ISSUES ANDREQUIREMENTS.In January 20<strong>05</strong>, the <strong>Commission</strong> instituted a proceeding to examine the issues andrequirements raised by, and contained in Chapter 486H, HRS. The <strong>Commission</strong> examined thefollowing issues and requirements: (1) the effect, impact, and appropriateness of the baselineprice and options as to a more appropriate baseline or a more appropriate reporting service, ifany; (2) the effect, impact, and appropriateness of the location adjustment factor established at$.04 per gallon, and options as to a more appropriate location adjustment factor; (3) the effect,impact, and appropriateness of the marketing margin factor established at $.18 per gallon, andoptions as to a more appropriate marketing margin factor; (4) the effect, impact andappropriateness of the mid-grade adjustment factor established at $.<strong>05</strong> per gallon, and options asto a more appropriate mid-grade adjustment factor; (5) the effect, impact, and appropriateness ofthe premium adjustment factor established at $.09 per gallon, and options as to a moreappropriate premium adjustment factor; (6) the types of documents, data, and information10 Leonard Leopardi has been replaced by George "Keoki" Miyamoto.11 Currently, Pratt Kinimaka is the duly designated representative of Rodney Haraga, theDirector of DOT.12 On November 15, 20<strong>05</strong>, after thorough evaluation of proposals received in response toits request for proposal, the <strong>Commission</strong> issued an order selecting One Call Concepts, Inc. as theexclusive provider for the administration and operation of the One Call Center. Order No. 22121,filed November 15, 20<strong>05</strong>, in Docket No. <strong>05</strong>-0079.
<strong>Public</strong> <strong>Utilities</strong> <strong>Commission</strong> <strong>Annual</strong> Report <strong>2004</strong>-<strong>05</strong>State of Hawaii Page 33manufacturers, wholesalers, or jobbers must furnish to the <strong>Commission</strong> to make determinationson zone price adjustments; (7) zone price adjustments to the maximum pre-tax wholesale regularunleaded, mid-grade, and premium gasoline prices and the effect, impact, and appropriatenesson a zone by zone basis; (8) the types of documents, data, and information necessary for the<strong>Commission</strong> to determine whether the manufacturer, wholesaler, or jobber is complying with anyrequirement imposed or rule adopted; and (9) any further adjustments necessary to establishmaximum pre-tax wholesale gasoline prices that reflect and correlate with competitive marketconditions.The parties to this proceeding include Chevron, Tesoro, Shell Oil Company, HawaiiPetroleum Marketers Association and Consumer Advocate. In April 20<strong>05</strong>, the <strong>Commission</strong>issued a report prepared by ICF Consulting (“ICF”), professional consultants retained by the<strong>Commission</strong> to assist in its investigation. The <strong>Commission</strong> issued its decision in this proceedingin Fiscal <strong>Year</strong> 20<strong>05</strong>-06. 13I. DOCKET PROCEEDINGS.At the beginning of the Fiscal <strong>Year</strong>, 446 pending dockets were carried over from prioryears, and 371 new dockets were opened during the Fiscal <strong>Year</strong>. Thus, during the Fiscal <strong>Year</strong>, atotal of 817 dockets were before the <strong>Commission</strong> for review and consideration. Of the817 dockets, 575 or approximately 70 per cent of the dockets were completed by the end of theFiscal <strong>Year</strong> (June 30, 20<strong>05</strong>).At the end of the Fiscal <strong>Year</strong>, 242 dockets were pending, including 76 dockets carriedover from years prior to the Fiscal <strong>Year</strong> and 166 dockets that were opened during the Fiscal <strong>Year</strong>.years.The following table summarizes the <strong>Commission</strong>’s dockets over the past three (3) fiscal13 Decision and Order No. 21952, filed on August 1, 20<strong>05</strong>, in Docket No. <strong>05</strong>-0002.
<strong>Public</strong> <strong>Utilities</strong> <strong>Commission</strong> <strong>Annual</strong> Report <strong>2004</strong>-<strong>05</strong>State of Hawaii Page 34DOCKETS FILED, COMPLETED, AND PENDINGFISCAL YEARS 2002-03, 2003-04, and <strong>2004</strong>-<strong>05</strong>Fiscal <strong>Year</strong> (July 1 - June 30)Dockets Pending on July 1 2002-03 2003-04 <strong>2004</strong>-<strong>05</strong><strong>Utilities</strong>Electric 39 42 50Gas 4 2 0Telecommunications 75 91 139Private Water/Sewer 7 15 13Subtotal 125 150 202TransportationMotor Carriers 178 197 242Water Carriers 1 2 2Subtotal 179 199 244Gas Price Cap n/a n/a n/aOne Call Center n/a n/a n/aTotal 304 349 446New Dockets Opened in Fiscal <strong>Year</strong> 2002-03 2003-04 <strong>2004</strong>-<strong>05</strong><strong>Utilities</strong>Electric 32 46 30Gas 1 1 2Telecommunications 115 97 89Private Water/Sewer 11 10 16Subtotal 159 154 137TransportationMotor Carriers 276 236 230Water Carriers 4 1 1Subtotal 280 237 231Gas Price Cap n/a n/a 1One Call Center n/a n/a 2Total 439 391 371
<strong>Public</strong> <strong>Utilities</strong> <strong>Commission</strong> <strong>Annual</strong> Report <strong>2004</strong>-<strong>05</strong>State of Hawaii Page 35DOCKETS FILED, COMPLETED, AND PENDINGFISCAL YEARS 2002-03, 2003-04, and <strong>2004</strong>-<strong>05</strong>Dockets Completed in FY 2002-03 2003-04 <strong>2004</strong>-<strong>05</strong><strong>Utilities</strong>Electric 29 38 38Gas 3 3 1Telecommunications 99 49 188Private Water/Sewer 3 12 17Subtotal 134 102 244TransportationMotor Carriers 257 191 330Water Carriers 3 1 0Subtotal 260 192 330Gas Price Cap n/a n/a 0One Call Center n/a n/a 1Total 394 294 575Dockets Pending on June 30 2002-03 2003-04 <strong>2004</strong>-<strong>05</strong> 14<strong>Utilities</strong>Electric 42 50 42Gas 2 0 1Telecommunications 91 139 40Private Water/Sewer 15 13 12Subtotal 150 202 95TransportationMotor Carriers 197 242 142Water Carriers 2 2 3Subtotal 199 244 145Gas Price Cap n/a n/a 1One Call Center n/a n/a 1Total 349 446 24214 The lower number of total pending dockets may be primarily attributed to the greaternumber of prior fiscal years’ dockets completed in this Fiscal <strong>Year</strong>.
<strong>Public</strong> <strong>Utilities</strong> <strong>Commission</strong> <strong>Annual</strong> Report <strong>2004</strong>-<strong>05</strong>State of Hawaii Page 36VI.ENFORCEMENT ACTIVITIES.The <strong>Commission</strong> enforces its rules and regulations, standards, and tariffs by monitoringthe operating practices and financial transactions of the regulated utilities and transportationcarriers. Enforcement activities involve customer complaint resolution, compliance with financialreporting and other requirements, and motor carrier citations. These enforcement activities arecritical in ensuring that customers of the regulated companies receive adequate and efficientservices.A. COMPLAINT RESOLUTION.The <strong>Commission</strong>’s role in protecting the public is carried out in part through itsinvestigation and resolution of complaints. The <strong>Commission</strong> collects and compiles utility andconsumer complaints to track trends and patterns in the utility and transportation industries. The<strong>Commission</strong> accepts verbal and written complaints against any public utility, water carrier, motorcarrier, or others subject to the <strong>Commission</strong>’s jurisdiction. Verbal complaints are received bytelephone, or in person at the <strong>Commission</strong>’s office. There are two (2) kinds of written complaints-- formal and informal.The <strong>Commission</strong>’s rules of practice and procedure, Chapter 6-61, HAR, provide therequirements for formal and informal written complaints. Written formal complaints should: (1) bein writing; (2) comply with filing and other requirements set forth in Sections 6-61-15 to 6-61-21,HAR; (3) state the full name and address of each complainant and of each respondent; (4) setforth fully and clearly the specific act complained of; (5) advise the respondent and the<strong>Commission</strong> completely of the facts constituting the grounds of the complaint, the injurycomplained of, and the exact relief desired. If the <strong>Commission</strong> accepts a formal complaint foradjudication, it assigns a docket number and sets the matter for an evidentiary hearing, ifnecessary.Written informal complaints should: (1) state the name of the respondent, the date andapproximate time of the alleged act, and set forth fully and clearly the facts of the act complainedof; (2) advise the respondent and the <strong>Commission</strong> in what respects the provisions of the law orrules have been or are being violated or will be violated and should provide the facts claimed toconstitute the violation; and (3) specify the relief sought or desired. The <strong>Commission</strong> assigns atracking number to each written informal complaint filed with the <strong>Commission</strong>. It also assignsthese complaints to certain <strong>Commission</strong> staff, who are tasked to, among other things, investigateand attempt to resolve the complaints through correspondence or conference rather than throughthe formal complaint process.1. WRITTEN INFORMAL AND VERBAL COMPLAINTS.As shown in the table below, the <strong>Commission</strong> received a total of 596 written informal andverbal complaints in the Fiscal <strong>Year</strong> against regulated and unregulated utility and transportationcompanies. Complaints on Oahu amounted to 316 out of 596 complaints statewide, or 53 percent of the total complaints.
<strong>Public</strong> <strong>Utilities</strong> <strong>Commission</strong> <strong>Annual</strong> Report <strong>2004</strong>-<strong>05</strong>State of Hawaii Page 37Total Informal andVerbal ComplaintsFiscal <strong>Year</strong> 20<strong>05</strong><strong>Utilities</strong>Telecommunications:Wireline (telephone) 106Cellular and Paging 102Other Telecom Providers 43Total Telecom 251Electricity 103Gas 7Water/Sewer 26Transportation CarriersWater Carrier 2Motor Carrier 207Total Complaints 596For all islands, the <strong>Commission</strong> received 251 written informal and verbal complaintsinvolving telecommunications providers. The majority of telecommunications complaints (106)related to Verizon Hawaii, now known as Hawaiian Telcom. These complaints mainly involvedservice problems, mostly relating to interruptions, repairs, and installations. The cellular andpaging companies received 102 complaints, mostly relating to billing problems (service contractsand charges). Most of the 43 complaints filed against other telecommunications providers,including interstate and unregulated communications equipment and service companies, wererelated to service and billing problems and unregulated long distance carriers.The electric utilities received 103 complaints, mostly relating to billing problems (highconsumption). The seven (7) complaints against gas utilities were mostly relating to service andbilling problems. The 26 complaints relating to water and sewer facilities were primarily overtariffs (rates and charges) and billing (high consumption) problems. The two (2) complaintsagainst water carriers involved primarily service problems and tariffs. Most of the 207 complaintsagainst motor carriers were related to operating without CPCNs.To illustrate complaint trends, Figures 5 to 10 summarize the complaints received by the<strong>Commission</strong> over the past three (3) fiscal years for each of the regulated utility industries,statewide and island-by-island.
<strong>Public</strong> <strong>Utilities</strong> <strong>Commission</strong> <strong>Annual</strong> Report <strong>2004</strong>-<strong>05</strong>State of Hawaii Page 38Figure 5Informal and Verbal ComplaintsTotal All Utility Companies - Fiscal <strong>Year</strong>s 2003-20<strong>05</strong>700600No. of Complaints5004003002001000FY 2003 FY <strong>2004</strong> FY 20<strong>05</strong>Telephone 111 96 106Cellular and Paging 118 81 102Other Telecom Providers 71 79 43Electricity 260 125 103Gas 33 23 7Water/Sewer 29 37 26Total Complaints 622 441 387FY
<strong>Public</strong> <strong>Utilities</strong> <strong>Commission</strong> <strong>Annual</strong> Report <strong>2004</strong>-<strong>05</strong>State of Hawaii Page 39Figure 6Informal and Verbal ComplaintsStatewide - All Utility Companies - Fiscal <strong>Year</strong>s 2003-20<strong>05</strong>300250No. of Complaints20015010<strong>05</strong>00TelephoneCellular andPagingOther TelecomProvidersFY 2003 111 118 71 260 33 29FY <strong>2004</strong> 96 81 79 125 23 37FY 20<strong>05</strong> 106 102 43 103 7 26Type of UtilityElectricity Gas Water/SewerFigure 7Informal and Verbal ComplaintsOahu - Utility Companies - Fiscal <strong>Year</strong>s 2003-20<strong>05</strong>160140No. of Complaints120100806040200TelephoneCellular andPagingOther TelecomProvidersFY 2003 Oahu 59 65 27 141 16 13FY <strong>2004</strong> Oahu 36 49 52 64 19 7FY 20<strong>05</strong> Oahu 56 74 22 58 5 12Type of UtilityElectricity Gas Water/Sewer
<strong>Public</strong> <strong>Utilities</strong> <strong>Commission</strong> <strong>Annual</strong> Report <strong>2004</strong>-<strong>05</strong>State of Hawaii Page 40Figure 8Informal and Verbal ComplaintsMaui - Utility Companies - Fiscal <strong>Year</strong>s 2003-20<strong>05</strong>504540No. of Complaints35302520151<strong>05</strong>0TelephoneCellular andPagingOther TelecomProvidersFY 2003 Maui 19 22 27 44 8 6FY <strong>2004</strong> Maui 26 1 8 18 1 3FY 20<strong>05</strong> Maui 11 7 13 23 0 8Type of UtilityElectricity Gas Water/SewerFigure 9Informal and Verbal ComplaintsHawaii - Utility Companies - Fiscal <strong>Year</strong>s 2003-20<strong>05</strong>7060No. of Complaints50403020100TelephoneCellular andPagingOther TelecomProvidersFY 2003 Hawaii 27 19 12 61 9 9FY <strong>2004</strong> Hawaii 32 20 14 32 1 27FY 20<strong>05</strong> Hawaii 39 18 8 14 1 4Type of UtilityElectricity Gas Water/Sewer
<strong>Public</strong> <strong>Utilities</strong> <strong>Commission</strong> <strong>Annual</strong> Report <strong>2004</strong>-<strong>05</strong>State of Hawaii Page 41Figure 10Informal and Verbal ComplaintsKauai - Utility Companies - Fiscal <strong>Year</strong>s 2003-20<strong>05</strong>161412No. of Complaints1086420TelephoneCellular andPagingOther TelecomProvidersFY 2003 Kauai 6 12 5 14 0 1FY <strong>2004</strong> Kauai 2 11 5 11 2 0FY 20<strong>05</strong> Kauai 0 3 0 8 1 2Type of UtilityElectricity Gas Water/Sewer
<strong>Public</strong> <strong>Utilities</strong> <strong>Commission</strong> <strong>Annual</strong> Report <strong>2004</strong>-<strong>05</strong>State of Hawaii Page 42Figures 11 to 14 illustrate complaint trends over the last three (3) fiscal years forregulated motor carriers and water carriers, statewide and island-by-island.Figure 11Informal and Verbal ComplaintsStatewide All Transportation Carriers - Fiscal <strong>Year</strong>s 2003-020<strong>05</strong>350300No. of Complaints25020015010<strong>05</strong>00FY 2003 FY <strong>2004</strong> FY 20<strong>05</strong>Water Carrier 10 9 2Motor Carrier 298 131 207Total Complaints 308 140 209FY
<strong>Public</strong> <strong>Utilities</strong> <strong>Commission</strong> <strong>Annual</strong> Report <strong>2004</strong>-<strong>05</strong>State of Hawaii Page 43Figure 12Informal and Verbal ComplaintsStatewide - Water Carrier and Motor Carrier - Fiscal <strong>Year</strong>s 2003-20<strong>05</strong>350300No. of Complaints25020015010<strong>05</strong>00Water CarrierMotor CarrierFY 2003 10 298FY <strong>2004</strong> 9 131FY 20<strong>05</strong> 2 207Type of CarrierFigure 13Informal and Verbal ComplaintsMotor Carrier - By Islands - Fiscal <strong>Year</strong>s 2003-20<strong>05</strong>160140No. of Complaints120100806040200Oahu Oahu Oahu Hawaii Hawaii Hawaii Maui Maui Maui Kauai Kauai KauaiFY2003FY<strong>2004</strong>FY20<strong>05</strong>FY2003FY<strong>2004</strong>FY20<strong>05</strong>FY2003Motor Carrier 139 69 89 58 28 46 84 26 48 17 8 24Islands and FYFY<strong>2004</strong>FY20<strong>05</strong>FY2003FY<strong>2004</strong>FY20<strong>05</strong>
<strong>Public</strong> <strong>Utilities</strong> <strong>Commission</strong> <strong>Annual</strong> Report <strong>2004</strong>-<strong>05</strong>State of Hawaii Page 44Figure 14Informal and Verbal ComplaintsWater Carrier - By Islands - Fiscal <strong>Year</strong>s 2003-20<strong>05</strong>65No. of Complaints43210Oahu Oahu Oahu Hawaii Hawaii Hawaii Maui Maui Maui Kauai Kauai KauaiFY2003FY<strong>2004</strong>FY20<strong>05</strong>FY2003FY<strong>2004</strong>FY20<strong>05</strong>FY2003Water Carrier 4 2 0 1 5 1 2 1 0 3 1 1Islands and FYFY<strong>2004</strong>FY20<strong>05</strong>FY2003FY<strong>2004</strong>FY20<strong>05</strong>2. INFORMAL COMPLAINT SURVEYIn an effort to improve the <strong>Commission</strong>’s service to consumers, a survey of informalwritten complaints filed in the Fiscal <strong>Year</strong> with the <strong>Commission</strong> was initiated in Fiscal<strong>Year</strong> 2003-04. A survey is sent to complainants whose informal complaint cases are closed. Thesurvey includes four (4) questions: (1) Do you feel that we responded to your complaint in areasonable amount of time?; (2) Did we provide you with a response that was clear andunderstandable?; (3) Was your complaint resolved to your satisfaction?; and (4) If you called usand spoke with our staff, were they courteous and professional?In the Fiscal <strong>Year</strong>, the <strong>Commission</strong> received 48 responses to its informal complaintsurvey. Figures 15 to 18 show the results of the survey.
<strong>Public</strong> <strong>Utilities</strong> <strong>Commission</strong> <strong>Annual</strong> Report <strong>2004</strong>-<strong>05</strong>State of Hawaii Page 45Figure 15INFORMAL COMPLAINT SURVEYFiscal <strong>Year</strong> <strong>2004</strong>-<strong>05</strong>1-Do you feel we responded to your complaint in a reasonable amount of time?13%2%Yes (41)No (6)No Response (1)85%Figure 16INFORMAL COMPLAINT SURVEYFiscal <strong>Year</strong> <strong>2004</strong>-<strong>05</strong>2-Did we provide you with a response that was clear and understandable?10%13%Yes (37)No (6)No Response (5)77%
<strong>Public</strong> <strong>Utilities</strong> <strong>Commission</strong> <strong>Annual</strong> Report <strong>2004</strong>-<strong>05</strong>State of Hawaii Page 46Figure 17INFORMAL COMPLAINT SURVEYFiscal <strong>Year</strong> <strong>2004</strong>-<strong>05</strong>3-Was your complaint resolved to your satisfaction?2%39%59%Yes (28.5)No (18.5)No Response (1)Figure 18INFORMAL COMPLAINT SURVEYFiscal <strong>Year</strong> <strong>2004</strong>-<strong>05</strong>4-If you called us and spoke with our staff, were they courteous and professional?0%Yes (34)No (0)100%
<strong>Public</strong> <strong>Utilities</strong> <strong>Commission</strong> <strong>Annual</strong> Report <strong>2004</strong>-<strong>05</strong>State of Hawaii Page 47B. FINANCIAL REPORTING AND PAYMENT OF PUBLIC UTILITIES FEE.The applicable law and administrative rules require regulated utilities and transportationcarriers to annually submit financial reports and to pay certain public utility revenue fees.During the Fiscal <strong>Year</strong>, the <strong>Commission</strong> issued 25 show cause orders to motor carriersand 24 orders to telecommunications providers who failed to submit financial reports and failed topay required revenue fees. The <strong>Commission</strong> collected $6,463 in interest and penalties for thelate payment of revenue fees. At the end of the Fiscal <strong>Year</strong>, all, except two (2), order to showcause dockets were pending.C. OPERATING AS A PUBLIC UTILITY WITHOUT A CERTIFCATE.The <strong>Commission</strong> is authorized to institute order to show cause proceedings to investigatealleged or suspected violations of any rule, regulation, order, or other requirement. The<strong>Commission</strong> may assess a civil penalty not to exceed $25,000 for each day of violation, neglect,or failure to conform to or comply with Chapter 269, HRS, or any lawful order of the <strong>Commission</strong>.In June <strong>2004</strong>, the <strong>Commission</strong> opened an investigation of an informal complaint filed byMokuleia Beach Colony against Mokuleia Water, LLC (“MW”) and Mokuleia Water UsersAssociation (“Association”). Based on its investigation of the complaint, the <strong>Commission</strong>concluded that MW and the Association are providing water service to the public as a public utilitywithout a CPCN. In January 20<strong>05</strong>, the <strong>Commission</strong> issued an order to show cause to MW andthe Association for failure to comply with Chapter 269, HRS, by operating as a public utilitywithout a CPCN. In June 20<strong>05</strong>, the <strong>Commission</strong> held an order to show cause hearing. At theend of the Fiscal <strong>Year</strong>, the <strong>Commission</strong>’s decision in this proceeding was pending.D. MOTOR CARRIER CITATIONS.The <strong>Commission</strong> issues civil citations to motor carriers for violations of the Motor CarrierLaw, Chapter 271, HRS. The citations impose a civil penalty, typically $500 or $1,000 perviolation. At the request of the <strong>Commission</strong>, the State Department of Transportation is authorizedto assign the department’s motor vehicle safety officer to assist the <strong>Commission</strong> in assessing civilpenalties.The <strong>Commission</strong> has been successful in its efforts to enforce the law by issuing citationsto discourage illegal motor carrier activities on Oahu and the neighbor islands. Some of thecommon types of motor carrier citations relate to operating without a CPCN, the failure tomaintain the required liability insurance and improper vehicle marking. For this Fiscal <strong>Year</strong>, civilpenalties collected through motor carrier citations totaled $6,700. The <strong>Commission</strong> enforcementofficers issued 22 motor carrier citations on the following islands: Oahu (10), Hawaii (7),Kauai (4), and Maui (1).VII.INQUIRIES.In addition to consumer complaints, the <strong>Commission</strong> is responsible for collecting andcompiling all inquiries concerning public utilities. <strong>Commission</strong> staff receives various requests forinformation relating to utilities, transportation carriers, gasoline price cap, one call center, generalregulated matters, and non-regulated matters. As shown in the table below, the <strong>Commission</strong>received a total of 2,302 inquiries in the Fiscal <strong>Year</strong>, mostly relating to motor carriers.
<strong>Public</strong> <strong>Utilities</strong> <strong>Commission</strong> <strong>Annual</strong> Report <strong>2004</strong>-<strong>05</strong>State of Hawaii Page 48Total InquiriesFiscal <strong>Year</strong> <strong>2004</strong>-<strong>05</strong><strong>Utilities</strong>:Telecommunications 419Electric 73Gas 3Water/Sewer 33Transportation Carriers:Property Motor Carrier 784Passenger Motor Carrier 806General Motor Carrier 47Water Carrier 26One Call Center 1General Regulated & Unregulated 110Total Inquiries 2,302VIII. FISCAL INFORMATION.The <strong>Public</strong> <strong>Utilities</strong> <strong>Commission</strong> Special Fund (“Special Fund”) is used to cover theoperating expenses of the <strong>Commission</strong> and Consumer Advocate. The Special Fund’s sources ofincome include public utility fees, motor carrier fees, penalties and interest, application andintervention filing fees, and duplication fees. For the Fiscal <strong>Year</strong>, the regulated utilities andtransportation carriers paid $11,112,1<strong>05</strong> in public utility fees and $1,034,797 in motor carrier fees,respectively. The total revenues of the <strong>Commission</strong>’s Special Fund were $12,204,752.The expenses of the <strong>Commission</strong> include personnel costs and other current expenses.The <strong>Commission</strong>’s other major current expenses include transfers from its Special Fund to theConsumer Advocate to fund its operations.For the Fiscal <strong>Year</strong>, the <strong>Commission</strong> received an appropriation of $6,968,888 forpersonal services and other current expenses as shown in the table below. Allotments for the<strong>Commission</strong>’s personal services expenses were $2,661,085 for 39 authorized permanentpositions. The <strong>Commission</strong> was allotted $4,352,673 for other current expenses. The<strong>Commission</strong>’s other current expenses allotment included $2,473,837 that was transferred to theConsumer Advocate to cover its operating expenses.The <strong>Commission</strong> also received the following appropriations out of the Special Fund asshown in the table below: (1) $300,000 for the purpose of establishing and operating a one callcenter, pursuant to Act 141, SLH <strong>2004</strong> (“Act 141”) and (2) $104,664 for two (2) permanentpositions, an engineer IV and an investigator IV, pursuant to Act 154, SLH <strong>2004</strong> (“Act 154”).
<strong>Public</strong> <strong>Utilities</strong> <strong>Commission</strong> <strong>Annual</strong> Report <strong>2004</strong>-<strong>05</strong>State of Hawaii Page 49FY <strong>2004</strong>-<strong>05</strong> FY <strong>2004</strong>-<strong>05</strong>*Appropriation AllotmentPersonal Services $2.616,215 $2,661,085Other Current Expense 4,352,673 4,352,673Total $6,968,888 $7,013,758One Call Center $300,000 $300,000Two (2) Permanent Positions $104,664 $104,664*Allotment for personal services includes collective bargaining amount ($44,870).Pursuant to Section 269-33, HRS, any amount over $1,000,000 remaining in the SpecialFund at the end of each fiscal year is transferred to the State’s general fund. For the Fiscal <strong>Year</strong>,an excess balance of $5,616,362 from the Special Fund was transferred to the general fund.This excess balance amount includes the balance of the moneys appropriated through Act 41,SLH <strong>2004</strong> (<strong>2004</strong> Supplemental Appropriations Act), Act 141, and Act 154. 15IX.UTILITY COMPANY OPERATIONS, CAPITAL IMPROVEMENTS, ANDRATES.A. UTILITY COMPANY OPERATIONS.1. CUSTOMERS SERVED BY UTILITY COMPANIES.The number of customers served by electric and gas utility customers have been fairlystable, with a slight general increase for the electric utility customer numbers during the 2000 –<strong>2004</strong> time period, as shown in Figure 19. 1615 See the “<strong>Public</strong> <strong>Utilities</strong> <strong>Commission</strong> Special Fund Report, Fiscal <strong>Year</strong> <strong>2004</strong>-<strong>05</strong>” fordetailed information on the <strong>Commission</strong>’s actual revenues and expenditures for the Fiscal <strong>Year</strong>,which the <strong>Commission</strong> submits to the Legislature pursuant to Section 269-33, HRS.16 Sources: HECO <strong>2004</strong> Service Reliability Report, MECO <strong>2004</strong> Service ReliabilityReport, HELCO <strong>2004</strong> Service Reliability Report, and KIUC <strong>Annual</strong> Report to the <strong>PUC</strong>.
<strong>Public</strong> <strong>Utilities</strong> <strong>Commission</strong> <strong>Annual</strong> Report <strong>2004</strong>-<strong>05</strong>State of Hawaii Page 50Figure 19Number of Electric and Gas Utility Customers2000 - <strong>2004</strong>300,000Number of Customers250,000200,000150,000100,00<strong>05</strong>0,00002000 2001 2002 2003 <strong>2004</strong>HECO 276,447 279,534 281,922 284,460 287,074HELCO 63,207 64,660 66,034 67,879 70,124MECO 57,000 58,308 59,410 60,651 61,684KIUC 30,715 30,969 31,768 32,065 32,950Gasco 36,321 36,379 36,322 36,093 36,093<strong>Annual</strong> PeriodsAs shown in Figure 20, Verizon Hawaii’s customer base, as measured by the number ofaccess lines that it serves, after peaking in 2000, has decreased over the past four (4) years. 17This decrease is believed to be due primarily to loss of business customers to competitors andincreased competition from wireless telecommunications carriers and cable modem service(which does not require telephone lines for dial-up internet access).<strong>2004</strong>.17 Verizon Hawaii’s ARMIS Operating Data Reports (FCC Report 43-08) for 2000 through
<strong>Public</strong> <strong>Utilities</strong> <strong>Commission</strong> <strong>Annual</strong> Report <strong>2004</strong>-<strong>05</strong>State of Hawaii Page 51Figure 20Verizon Hawaii Total Switched Access Lines2000-<strong>2004</strong>760,000740,000Number ofAccess Lines720,000700,000680,000660,000640,000620,0002000 2001 2002 2003 <strong>2004</strong>Total Switched Access Lines 743,370 734,881 722,291 698,355 674,078<strong>Year</strong>s2. RATES OF RETURN EARNED BY UTILITY COMPANIES.Each regulated utility is entitled to a fair opportunity to earn a fair rate of return. Figure 21summarizes the recent history and trends of rates of return earned by the various regulatedutilities.
<strong>Public</strong> <strong>Utilities</strong> <strong>Commission</strong> <strong>Annual</strong> Report <strong>2004</strong>-<strong>05</strong>State of Hawaii Page 52Rate of Return14.00%13.00%12.00%11.00%10.00%9.00%8.00%7.00%6.00%5.00%4.00%3.00%2.00%1.00%0.00%-1.00%-2.00%-3.00%Figure 21Utility Rate of Return Five <strong>Year</strong> ComparisonJun '01 Jun '02 Jun '03 Jun '04 Jun '<strong>05</strong>HECO 8.02% 8.32% 7.68% 7.82% 5.92%HELCO 9.39% 8.87% 8.89% 7.12% 6.61%MECO 7.74% 7.82% 8.31% 8.55% 7.89%KE/KIUC (1) 9.01% 8.99% n/a (4) n/a (4) n/a (4)Hawaiian Telcom (2) 2.92% 2.29% 0.96% -1.80% -0.80%TGC (3) 5.70% 7.60% 6.40% 5.80% 7.30%Young Brothers 7.66% 10.96% 11.00% 12.70% 8.81%12 MTD Ended June 30(1) On September 17, 2002, the <strong>Commission</strong> approved the assignment of KE’s legislatively-granted franchiseto KIUC.(2) On March 16, 20<strong>05</strong>, in Docket No. 04-0140, D&O No. 21696, the <strong>Commission</strong> approved the mergertransaction that resulted in the sale of Verizon Hawaii, Inc. and certain affiliates to entities controlled byaffiliates of the TC Group L.L.C., dba The Carlyle Group.(3) Results are for the Honolulu Division.(4) Beginning November 2002, KIUC began reporting TIER (Times Interest Earned Ratio).
<strong>Public</strong> <strong>Utilities</strong> <strong>Commission</strong> <strong>Annual</strong> Report <strong>2004</strong>-<strong>05</strong>State of Hawaii Page 53As shown in Figures 22 to 25 and 27 to 29, for the most part, the utilities have not beenearning their authorized rates of return over the past five (5) years. As KIUC converted to timesinterest earned ratio (“TIER”) in 2002, Figure 26 shows KIUC’s TIER for the past three (3) years.Figure 22Five <strong>Year</strong> Rate of Return Comparison - Hawaiian Electric Company10.00%9.00%8.00%7.00%Rate of Return6.00%5.00%4.00%3.00%2.00%1.00%0.00%Jun '01 Jun '02 Jun '03 Jun '04 Jun '<strong>05</strong>Authorized Rate of Return 9.16% 9.16% 9.16% 9.16% 9.16%Rate of Return 8.02% 8.32% 7.68% 7.82% 5.92%12 MTD Ended June 30Figure 23Five <strong>Year</strong> Rate of Return Comparison - Hawaii Electric Light CompanyRate of Return10.00%9.00%8.00%7.00%6.00%5.00%4.00%3.00%2.00%1.00%0.00%Jun '01 Jun '02 Jun '03 Jun '04 Jun '<strong>05</strong>Authorized Rate of Return 9.14% 9.14% 9.14% 9.14% 9.14%Rate of Return 9.39% 8.87% 8.89% 7.12% 6.61%12 MTD Ended June 30
<strong>Public</strong> <strong>Utilities</strong> <strong>Commission</strong> <strong>Annual</strong> Report <strong>2004</strong>-<strong>05</strong>State of Hawaii Page 54Figure 24Five <strong>Year</strong> Rate of Return Comparison - Maui Electric Company10.00%9.00%8.00%Rate of Return7.00%6.00%5.00%4.00%3.00%2.00%1.00%0.00%Jun '01 Jun '02 Jun '03 Jun '04 Jun '<strong>05</strong>Authorized Rate of Return 8.83% 8.83% 8.83% 8.83% 8.83%Rate of Return 7.74% 7.82% 8.31% 8.55% 7.89%12 MTD Ended June 30Figure 25Two <strong>Year</strong> Rate of Return Comparison - Kauai ElectricRate of Return10.00%9.00%8.00%7.00%6.00%5.00%4.00%3.00%2.00%1.00%0.00%Jun '01 Jun '02Authorized Rate of Return 9.23% 9.23%Rate of Return 9.01% 8.99%12 MTD Ended June 30Beginning November 2002, KIUC began reporting TIER.
<strong>Public</strong> <strong>Utilities</strong> <strong>Commission</strong> <strong>Annual</strong> Report <strong>2004</strong>-<strong>05</strong>State of Hawaii Page 55Figure 26Three <strong>Year</strong> TIER Comparison - KIUC3.002.502.00TIER1.501.000.500.00Jun '03 Jun '04 Jun '<strong>05</strong>TIER 2.1 1.76 2.5712 MTD Ended June 30Figure 27Five <strong>Year</strong> Rate of Return Comparison - The Gas Company10.00%9.00%8.00%7.00%Rate of Return6.00%5.00%4.00%3.00%2.00%1.00%0.00%Jun '01 Jun '02 Jun '03 Jun '04 Jun '<strong>05</strong>Authorized Rate of Return 9.16% 9.16% 9.16% 9.16% 9.16%Rate of Return 5.70% 7.60% 6.40% 5.80% 7.30%12 MTD Ended June 30
<strong>Public</strong> <strong>Utilities</strong> <strong>Commission</strong> <strong>Annual</strong> Report <strong>2004</strong>-<strong>05</strong>State of Hawaii Page 56Figure 28Five <strong>Year</strong> Rate of Return Comparison - Verizon Hawaii, Inc./HawaiianTelcom, Inc.Rate of Return11.00%10.00%9.00%8.00%7.00%6.00%5.00%4.00%3.00%2.00%1.00%0.00%-1.00%-2.00%-3.00%Jun '01 Jun '02 Jun '03 Jun '04 Jun '<strong>05</strong>Authorized Rate of Return 9.73% 9.73% 9.73% 9.73% 9.73%Rate of Return 2.92% 2.29% 0.96% -1.80% -0.80%12 MTD Ended June 30Rate of ReturnFigure 29Five <strong>Year</strong> Rate of Return Comparison - Young Brothers14.00%13.00%12.00%11.00%10.00%9.00%8.00%7.00%6.00%5.00%4.00%3.00%2.00%1.00%0.00%Jun '01 Jun '02 Jun '03 Jun '04 Jun '<strong>05</strong>Authorized Rate of Return 11.06% 11.06% 11.06% 11.06% 11.06%Rate of Return 7.66% 10.96% 11.00% 12.70% 8.81%12 MTD Ended June 30
<strong>Public</strong> <strong>Utilities</strong> <strong>Commission</strong> <strong>Annual</strong> Report <strong>2004</strong>-<strong>05</strong>State of Hawaii Page 57B. FORECASTED CAPITAL IMPROVEMENTS.1. ELECTRIC UTILITY CIPs.The total 20<strong>05</strong> capital expenditure budget forecasted for HECO is approximately$124 million. Some of the major CIPs in HECO’s 20<strong>05</strong> budget include the East OahuTransmission Project, the construction of a new dispatch center, including a new EnergyManagement System, and the construction of the Ford Island 46kV Substation and the NewKuahua 46-12kV Substation.The total 20<strong>05</strong> capital expenditure budget forecasted for HELCO is approximately$44 million. HELCO’s major CIPs for 20<strong>05</strong> include the Kukio 69kV UG Conversion, equipmentinstallations at the Hokukano Substation, and the reconstruction and capacity expansion of theKeamuku-Waimea 7200 Line.The total 20<strong>05</strong> capital expenditure budget forecasted for MECO is approximately$42 million. Some of the major CIPs in MECO’s 20<strong>05</strong> budget include the 6 th Increment of theKahului Distribution Rebuild, the Waiale to Sub 36 T&D Line Reconstruction, and installations atthe New Piilani Substation.The total 20<strong>05</strong> capital expenditure budget forecasted for KIUC is approximately$18 million. KIUC’s major CIPs for 20<strong>05</strong> include two (2) projects involving the Kukui’ulaTransmission Line construction.Figure 30 shows the five (5)-year capital expenditure budget forecast for HECO, HELCO,MECO, and KIUC.Figure 30Electric <strong>Utilities</strong> Five-<strong>Year</strong> Capital Expenditures Forecast160,000,000140,000,000CIP Amount120,000,000100,000,00080,000,00060,000,00040,000,00020,000,000020<strong>05</strong> 2006 2007 2008 2009HECO 124,000,000 113,000,000 101,000,000 140,000,000 96,000,000HELCO 44,000,000 45,000,000 38,000,000 44,000,000 46,000,000MECO 42,000,000 48,000,000 24,000,000 20,000,000 28,000,000KIUC 17,669,000 33,857,700 20,893,000 11,000,500 9,369,000<strong>Year</strong>
<strong>Public</strong> <strong>Utilities</strong> <strong>Commission</strong> <strong>Annual</strong> Report <strong>2004</strong>-<strong>05</strong>State of Hawaii Page 582. GAS CIPsThe total 20<strong>05</strong> capital expenditure budget forecasted for TGC is approximately $6 million.Some of the major projects in the TGC 20<strong>05</strong> budget include the utility main pipeline renewal andutility services pipeline renewal projects on Oahu.Figure 31 shows the five (5)-year capital expenditure budget forecast for TGC.Figure 31TGC Five-<strong>Year</strong> Capital Expenditures Forecast7,500,0007,000,000CIP Amount6,500,0006,000,00<strong>05</strong>,500,00020<strong>05</strong> 2006 2007 2008 2009TGC 5,951,000 6,964,000 6,209,000 5,871,000 5,687,000<strong>Year</strong>3. FORECASTED UTILITY CIP EXPENDITURES.Figure 32 shows the total five (5)-year capital expenditures forecast for the electric andgas utilities.
<strong>Public</strong> <strong>Utilities</strong> <strong>Commission</strong> <strong>Annual</strong> Report <strong>2004</strong>-<strong>05</strong>State of Hawaii Page 59Figure 32Capital Expenditures - Forecasted300,000,000250,000,000200,000,000CIP Amount150,000,000100,000,00<strong>05</strong>0,000,000020<strong>05</strong> 2006 2007 2008 2009GASCO 5,951,000 6,964,000 6,209,000 5,871,000 5,687,000KIUC 17,669,000 33,857,700 20,893,000 11,000,500 9,369,000MECO 42,000,000 48,000,000 24,000,000 20,000,000 28,000,000HELCO 44,000,000 45,000,000 38,000,000 44,000,000 46,000,000HECO 124,000,000 113,000,000 101,000,000 140,000,000 96,000,000Total CIP 233,620,000 246,821,700 190,102,000 220,871,500 185,<strong>05</strong>6,000<strong>Year</strong>Figure 33 shows the five (5)-year capital expenditure forecasts by utility company.
<strong>Public</strong> <strong>Utilities</strong> <strong>Commission</strong> <strong>Annual</strong> Report <strong>2004</strong>-<strong>05</strong>State of Hawaii Page 60Figure 33Capital Expenditures - Forecasted160,000,000140,000,000ANNUAL EXPENDITURES ($)120,000,000100,000,00080,000,00060,000,00040,000,00020,000,000020<strong>05</strong> 2006 2007 2008 2009HECO 124,000,000 113,000,000 101,000,000 140,000,000 96,000,000HELCO 44,000,000 45,000,000 38,000,000 44,000,000 46,000,000MECO 42,000,000 48,000,000 24,000,000 20,000,000 28,000,000KIUC 17,669,000 33,857,700 20,893,000 11,000,500 9,369,000GASCO 5,951,000 6,964,000 6,209,000 5,871,000 5,687,000<strong>Year</strong>C. RATES OF MAJOR UTILITY COMPANIES.Generally, base rates for most regulated utilities have not changed over the past severalyears. However, variable components of rates, such as energy rate adjustment factors, havechanged the overall amounts billed to utility customers.1. ELECTRICITY RATES.In Figures 34 to 39, the electricity rates consist of the base energy rate plus the energyrate adjustment clause (“ERAC”) and other adjustments. 18 The total of the base energy rate andthe ERAC is referred to herein as the “Effective Energy Rate.”18 ERAC (aka fuel adjustment clause) means a provision of a rate schedule approved bythe <strong>Commission</strong>, which provides for increases or decreases, or both, without prior hearing, inrates reflecting changes in costs incurred by an electric or gas utility for fuel or purchased energydue to changes in the unit cost of fuel and purchased energy. See Chapter 6-60, HAR.
<strong>Public</strong> <strong>Utilities</strong> <strong>Commission</strong> <strong>Annual</strong> Report <strong>2004</strong>-<strong>05</strong>State of Hawaii Page 61Figure 34HECO Base Rates, ERAC, and Other Adjustments2001 - 20<strong>05</strong>$0.200000$0.150000$/kWh$0.100000$0.<strong>05</strong>0000$0.000000Jun '01 Jun '02 Jun '03 Jun '04 Jun '<strong>05</strong>Other Adjustments $0.001859 $0.0020<strong>05</strong> $0.002271 $0.003042 $0.002755ERAC $0.017880 $0.015060 $0.027340 $0.027500 $0.<strong>05</strong>0370Base Rates $0.112954 $0.112954 $0.112954 $0.112954 $0.112954Total $0.132693 $0.130019 $0.142565 $0.143496 $0.166079<strong>Year</strong>Figure 35HELCO Base Rates, ERAC, and Other Adjustments2001 - 20<strong>05</strong>$0.300000$0.250000$0.200000$/kWh$0.150000$0.100000$0.<strong>05</strong>0000$0.000000Jun '01 Jun '02 Jun '03 Jun '04 Jun '<strong>05</strong>Other Adjustments $0.002251 $0.0<strong>05</strong>658 $0.002726 $0.003418 $0.001570ERAC $0.002720 $0.002450 $0.012460 $0.025300 $0.062440Base Rates $0.191370 $0.191370 $0.191370 $0.191370 $0.191370Total $0.196341 $0.199478 $0.206556 $0.220088 $0.255380<strong>Year</strong>
<strong>Public</strong> <strong>Utilities</strong> <strong>Commission</strong> <strong>Annual</strong> Report <strong>2004</strong>-<strong>05</strong>State of Hawaii Page 62Figure 36MECO - Maui Division Base Rates, ERAC, and Other Adjustments2001 - 20<strong>05</strong>$0.300000$0.250000$0.200000$/kWh$0.150000$0.100000$0.<strong>05</strong>0000$0.000000Jun '01 Jun '02 Jun '03 Jun '04 Jun '<strong>05</strong>Other Adjustments $0.007662 $0.007689 $0.004636 $0.006737 $0.006752ERAC $0.028870 $0.02<strong>05</strong>00 $0.033090 $0.062130 $0.099710Base Rates $0.134231 $0.134231 $0.134231 $0.134231 $0.134231Total $0.170763 $0.162420 $0.171957 $0.203098 $0.240693<strong>Year</strong>Figure 37MECO - Lanai Division Base Rates, ERAC, and Other Adjustments2001 - 20<strong>05</strong>$0.300000$0.250000$0.200000$/kWh$0.150000$0.100000$0.<strong>05</strong>0000$0.000000Jun '01 Jun '02 Jun '03 Jun '04 Jun '<strong>05</strong>Other Adjustments $0.008113 $0.008372 $0.004803 $0.006889 $0.006889ERAC $0.041320 $0.019390 $0.038190 $0.047100 $0.090640Base Rates $0.180648 $0.180648 $0.180648 $0.180648 $0.180648Total $0.230081 $0.208410 $0.223641 $0.234637 $0.278177<strong>Year</strong>
<strong>Public</strong> <strong>Utilities</strong> <strong>Commission</strong> <strong>Annual</strong> Report <strong>2004</strong>-<strong>05</strong>State of Hawaii Page 63Figure 38MECO - Molokai Division Base Rates, ERAC, and Other Adjustments2001 - 20<strong>05</strong>$0.350000$0.300000$0.250000$/kWh$0.200000$0.150000$0.100000$0.<strong>05</strong>0000$0.000000Jun '01 Jun '02 Jun '03 Jun '04 Jun '<strong>05</strong>Other Adjustments $0.007333 $0.007610 $0.004740 $0.006832 $0.006832ERAC $0.034390 $0.020410 $0.036830 $0.061900 $0.111240Base Rates $0.174383 $0.174383 $0.174383 $0.174383 $0.174383Total $0.216106 $0.202403 $0.215953 $0.243115 $0.292455<strong>Year</strong>Figure 39KIUC/KE Base Rate, ERAC, and Other Adjustments2001 - 20<strong>05</strong>$0.350000$0.300000$0.250000$/kWh$0.200000$0.150000$0.100000$0.<strong>05</strong>0000$0.000000Jun '01 Jun '02 Jun '03 Jun '04 Jun '<strong>05</strong>Other Adjustments $0.006588 $0.012240 $0.012967 $0.009156 $0.006942ERAC $0.041702 $0.032480 $0.038933 $0.086903 $0.109411Base Rates $0.174890 $0.174890 $0.174890 $0.174890 $0.174890Total $0.223180 $0.219610 $0.226790 $0.270949 $0.291243<strong>Year</strong>
<strong>Public</strong> <strong>Utilities</strong> <strong>Commission</strong> <strong>Annual</strong> Report <strong>2004</strong>-<strong>05</strong>State of Hawaii Page 64Figure 40 compares Effective Energy Rates (combined base rate and ERAC) forresidential electricity customers across the State.Figure 40Five <strong>Year</strong> Comparison of Effective Residential Rates$0.350000$0.300000$0.250000$/kWh$0.200000$0.150000$0.100000$0.<strong>05</strong>0000$0.000000Jun '01 Jun '02 Jun '03 Jun '04 Jun '<strong>05</strong>HELCO 0.196341 0.199478 0.206556 0.220088 0.255380HECO 0.132693 0.130019 0.142565 0.143496 0.166079MECO - Lanai Division 0.230081 0.208410 0.223641 0.234637 0.278177MECO - Maui Division 0.170763 0.162420 0.171957 0.203098 0.240693MECO - Molokai Division 0.216106 0.202403 0.215953 0.243115 0.292455KIUC 0.223180 0.219610 0.226790 0.270949 0.291243<strong>Year</strong>Figure 41 compares monthly residential bills across the State over the past five (5)years, assuming 500kwh is used by the customer during the month. 1919 The Residential 500 kwh calculation includes the Effective Energy Rate and othercharges and adjustments that the utility is authorized to assess (e.g., customer charge, IRP/DSMsurcharges, etc. – it varies by company).
<strong>Public</strong> <strong>Utilities</strong> <strong>Commission</strong> <strong>Annual</strong> Report <strong>2004</strong>-<strong>05</strong>State of Hawaii Page 65Figure 41Five <strong>Year</strong> Comparison of Average Monthly Residential Electric Bill Basedon 500 kWhDollar$180.00$160.00$140.00$120.00$100.00$80.00$60.00$40.00$20.00$0.00Jun '01 Jun '02 Jun '03 Jun '04 Jun '<strong>05</strong>HELCO $108.29 $109.90 $113.28 $120.<strong>05</strong> $137.69HECO $73.39 $72.02 $78.29 $78.77 $90.04MECO - Lanai Division $122.66 $111.85 $119.33 $124.83 $146.59MECO - Maui Division $93.04 $88.87 $93.50 $109.06 $127.85MECO - Molokai Division $115.67 $108.83 $115.50 $129.08 $153.73KIUC $118.01 $119.53 $123.12 $145.20 $155.34<strong>Year</strong>2. TELECOMMUNICATION RATES.Hawaiian Telcom’s basic rates have remained unchanged over the past several years. 20The following table shows amounts by islands that customers have been paying since 1997 forresidential service.20 In fact, the current rates have been in effect since 1995. However, since 1997, with theapproval of the <strong>Commission</strong>, Hawaiian Telcom has assessed an 11.23 percent surcharge onmost intrastate services, including basic services.
<strong>Public</strong> <strong>Utilities</strong> <strong>Commission</strong> <strong>Annual</strong> Report <strong>2004</strong>-<strong>05</strong>State of Hawaii Page 66IslandResidential Service(1997 – Present) 21Oahu $16.02Hawaii $14.57Maui $13.90Kauai $13.90Molokai $12.07Lanai $11.01X. UTILITY COMPANY PERFORMANCE.A. ELECTRIC UTILITIES EFFICIENCY AND SERVICE QUALITY.1. HECO <strong>2004</strong> SERVICE QUALITY – NORMALIZED RESULTS.The following HECO electric utility service quality report was based on or excerpteddirectly from the <strong>2004</strong> Service Reliability Report submitted to the <strong>Commission</strong> by HECO. Thereport covers the <strong>2004</strong> calendar year (“<strong>2004</strong>”). A complete copy is available for review at the<strong>Commission</strong>’s office and will be made available on the <strong>Commission</strong>’s website.The average number of electric customers increased from 284,460 in 2003 to 287,074 in<strong>2004</strong> (a 0.9% increase). A new peak demand was set on the evening of October 12, <strong>2004</strong> for thesystem at 1,327 MW, the highest system peak demand since the evening of October 11, <strong>2004</strong>, at1,319 MW.Indices measure reliability in terms of the overall availability of electrical service (ASA),the frequency or number of times HECO's customers experience an outage during the year(SAIF), the average length of time an interrupted customer is out of power (CAID), and theaverage length of time HECO's customers are out of power during the year (SAID). SAID is anindication of overall system reliability because it is the product of SAIF and CAID andincorporates the impact of frequency and duration of outages on HECO's total customer base (inthis case 287,074 customers).To determine the relative level of reliability, the statistics for four (4) prior years, 2000through 2003, are used for comparison.The reliability indices are calculated using the data from all sustained 22 system outagesexcept customer maintenance outages. If data normalization is required, it is done using theguidelines specified in the report on reliability that was prepared for the <strong>Commission</strong>, titled"Methodology for Determining Reliability Indices for HECO <strong>Utilities</strong>," dated December 1990. Thatreport indicates that normalization is allowed for "abnormal" situations such as hurricanes,tsunamis, earthquakes, floods, catastrophic equipment failures, and single outages that cascadeinto a loss of load greater than 10% of the system peak load. These normalizations are made in21 The figures listed include an approved 11.23 percent intrastate surcharge. Charges,other surcharges and taxes not reflected in the amounts include touch tone service charge,<strong>PUC</strong> service fee, telecommunications relay services surcharge, and statewide enhanced 911service surcharge, and federal taxes and surcharges, such as interstate subscriber line charge,federal excise tax, and federal universal service fee.22 An interruption of electrical service of one (1) minute or longer.
<strong>Public</strong> <strong>Utilities</strong> <strong>Commission</strong> <strong>Annual</strong> Report <strong>2004</strong>-<strong>05</strong>State of Hawaii Page 67calculating the reliability indices because good engineering design takes into account safety,reliability, utility industry standards, and economics, and cannot always plan for catastrophicevents.The <strong>2004</strong> service reliability results are normalized for the January 14, <strong>2004</strong> High WindStorm - February 26, <strong>2004</strong> Rain Storm - and March 3, <strong>2004</strong> loss of Pukele TransmissionSubstation. The normalization meets the guidelines published in the December 1990 report,"Methodology for Determining Reliability Indices."On a normalized basis, the annual service reliability for <strong>2004</strong> was the 3 rd best in the pastfive (5) years in terms of system reliability. The reliability results for <strong>2004</strong> and four (4) prior yearsare shown in the table of “Electricity <strong>Annual</strong> Service Reliability Indices.”Electricity <strong>Annual</strong> Service Reliability Indices2000 2001 2002* 2003 <strong>2004</strong>**Number of Customers 276,447 279,534 281,922 284,460 287,074Customer Interruptions 349,683 492,309 325,332 469,372 364,491Customer-Hours Interrupted 408,909 553,544 359,810 450,530 480,299ASA (Percent) 99.983 99.977 99.985 99.982 99.981SAIF (Occurrences) 1.265 1.761 1.154 1.650 1.270CAID (Minutes) 70.16 67.46 66.36 57.59 79.06SAID (Minutes) 88.75 118.81 76.58 95.03 100.39Note: *Data normalized to exclude 12/19/02 AES Load Shedding outage**Data normalized to exclude 1/14/04 - 1/15/04 High Wind outages, 2/26/04 -2/28/04 Storm, 3/3/04 Pukele outage
<strong>Public</strong> <strong>Utilities</strong> <strong>Commission</strong> <strong>Annual</strong> Report <strong>2004</strong>-<strong>05</strong>State of Hawaii Page 68100.00099.99599.990Figure 42HECO Average Service Availability (ASA)(Higher is better)Percent99.98599.98099.98399.98599.98299.98199.97599.97799.97099.9652000 2001 2002* 2003 <strong>2004</strong>**<strong>Year</strong>*Data normalized to exclude 12/19/02 AES Load Shedding outage;**Data normalized to exclude 1/14/04-1/15/04 High Winds, 2/26/04-2/28/04 Storm, and3/3/04 Pukele OutagesFigure 42 shows that the <strong>2004</strong> ASA index has decreased from 2003 results of 99.982 to99.981 during <strong>2004</strong>. Approximately 104,800 fewer customers experienced sustained serviceinterruptions during <strong>2004</strong> compared to the previous year. However, the number ofCustomer-Hours Interrupted as shown in the table of Electricity <strong>Annual</strong> Service Reliability Indiceswas the second highest within the five (5) year period.
<strong>Public</strong> <strong>Utilities</strong> <strong>Commission</strong> <strong>Annual</strong> Report <strong>2004</strong>-<strong>05</strong>State of Hawaii Page 692.00Figure 43HECO System Average Interruption Frequency (SAIF)(Lower is better)1.801.601.7611.650Interruptions1.401.201.000.801.2651.1541.2700.600.400.200.002000 2001 2002* 2003 <strong>2004</strong>**<strong>Year</strong>*Data normalized to exclude 12/19/02 AES Load Shedding outage**Data normalized to exclude 1/14/04-1/15/04 High Winds, 2/26/04-2/28/04 Storm, and 3/3/04Pukele OutagesFigure 43 shows the SAIF indices for the past five (5) years. It shows that in <strong>2004</strong> theSAIF was the third lowest in the past five (5) years at 1.27, or slightly more than one (1) outageper customer for the year. Compared to past history, the <strong>2004</strong> SAIF of 1.27 was significantlybelow the ten (10) year 1.57 SAIF average.An increase in winter weather outages contributed to a higher SAIF for <strong>2004</strong>. Thefour (4) major weather related categories - High Winds, Trees or Branches 23 , Lightning andUnknown Failures affected a total of 107,303 customers during <strong>2004</strong> compared to a total of72,242 customers during 2003, an increase of 48%. However, improvements were noted in theareas of Equipment Deterioration, Auto Accidents, and Switching Errors over 2003 SAIF results.Two (2) sustained interruptions affected 10,000 or more customers during <strong>2004</strong>.Approximately 22,466 customers were affected by these top two (2) interruptions for <strong>2004</strong>,contributing 0.08 to the SAIF. Of the two (2) sustained interruptions, one (1) occurred on the subtransmissionsystem while tied to the adjacent line for maintenance work, and the secondoccurred on the sub-transmission system during a Lightning Storm in the Mililani area onJanuary 22, <strong>2004</strong>.23 A vegetation management program has also helped to reduce tree-related outages.
<strong>Public</strong> <strong>Utilities</strong> <strong>Commission</strong> <strong>Annual</strong> Report <strong>2004</strong>-<strong>05</strong>State of Hawaii Page 7090.00Figure 44HECO Customer Average Interruption Duration (CAID)(Lower is better)85.0080.0079.0675.00Minutes70.0065.0070.1667.4666.3660.0<strong>05</strong>5.0<strong>05</strong>0.0<strong>05</strong>7.592000 2001 2002* 2003 <strong>2004</strong>**<strong>Year</strong>*Data normalized to exclude 12/19/02 AES Load Shedding outage**Data normalized to exclude 1/14/04-1/15/04 High Winds, 2/26/04-2/28/04 Storm, and 3/3/04Pukele OutagesFigure 44 shows the CAID for <strong>2004</strong> ranked the worst in the past five (5) years inminimizing the time a customer was out of service. An increase in response times were noted forCable Failures (13 minutes), Equipment Deterioration (41 minutes) and High Winds (63 minutes)over the 2003 results.The average electrical outage duration (CAID) for <strong>2004</strong> was 79.06 minutes. Within thelast five (5) years, <strong>2004</strong> had the longest duration increase (CAID) with nearly 22 minutes over2003 results.
<strong>Public</strong> <strong>Utilities</strong> <strong>Commission</strong> <strong>Annual</strong> Report <strong>2004</strong>-<strong>05</strong>State of Hawaii Page 71130.00Figure 45HECO System Average Interruption Duration (SAID)(Lower is better)120.00118.81110.00100.0095.03100.39Minutes90.0080.0070.0088.7576.5860.0<strong>05</strong>0.0040.002000 2001 2002* 2003 <strong>2004</strong>**<strong>Year</strong>*Data normalized to exclude 12/19/02 AES Load Shedding outage**Data normalized to exclude 1/14/04-1/15/04 High Winds, 2/26/04-2/28/04 Storm, and 3/3/04Pukele OutagesFigure 45 shows the SAID indices for the past five (5) years. It shows that the <strong>2004</strong> SAIDof 100.39 minutes was the second highest during the last five (5) years. The SAID is thecomposite of both the SAIF and CAID indices and produces a broader benchmark of systemreliability by combining both the duration and the number of customer interruptions during a givenperiod of time. The higher SAID result was due to an increase in the CAID statistics as notedpreviously.2. MECO <strong>2004</strong> SERVICE QUALITY – NORMALIZED RESULTS.The following MECO electric utility service quality discussion is based on or excerpteddirectly from the MECO <strong>Annual</strong> Service Reliability Report <strong>2004</strong> submitted to the <strong>Commission</strong> byMECO. The report covers the <strong>2004</strong> calendar year. A complete copy is available for review at the<strong>Commission</strong>’s office and will be made available on the <strong>Commission</strong>’s website.The average number of electric customers increased from 60,651 in 2003 to 61,846 in<strong>2004</strong> (a 1.97% increase). The peak <strong>2004</strong> demand for the system was 210.9 MW (gross) thatoccurred on October 11, <strong>2004</strong>. This peak <strong>2004</strong> demand is now the highest peak demand for thesystem, increasing from 202.0 MW (gross) on December 30, 2003 (a 4.4% increase).To determine the relative level of reliability, the statistics for four (4) prior years,2000 through 2003, are used for comparison.
<strong>Public</strong> <strong>Utilities</strong> <strong>Commission</strong> <strong>Annual</strong> Report <strong>2004</strong>-<strong>05</strong>State of Hawaii Page 72The reliability indices are calculated using the data from all system outages exceptcustomer maintenance outages. MECO has not normalized any data for 2000, 2001, 2002, and2003. Normalizing of data would be in accordance with the guidelines specified in the report onreliability that was prepared for the <strong>Commission</strong>, titled “Methodology for Determining ReliabilityIndices for HECO <strong>Utilities</strong>,” dated December 1990.MECO has not normalized data since 1996. The <strong>2004</strong> reliability indices for MECOexclude the effects of the January 14 th Kona storm. Data was normalized because the outagesmet normalizing guidelines published in the December 1990 report, “Methodology for DeterminingReliability Indices.”Graphs of the ASA (Figure 46), SAIF (Figure 47), CAID (Figure 48), and SAID (Figure 49)for the five (5) years are included below.The <strong>2004</strong> service reliability results are normalized to exclude the January 14, <strong>2004</strong> KonaStorm, when extremely high winds of 50 to 80 mph were experienced on parts of Maui.Another factor affecting the Indices in <strong>2004</strong> was the incorporation of new customercounts for each circuit, standardizing MECO’s Indices with HECO and HELCO. As a result, the<strong>2004</strong> Indices rank fifth for the last five (5) years, with the exception of CAID, which is a recordbest for MECO, thus setting a new benchmark for succeeding years.better.)The ASA index of 99.9858% is ranked fifth best for the last five (5) years. (Higher isThe SAIF index of 1.608 is ranked fifth best for the last five (5) years. (Lower is better.)The CAID index of 46.54 minutes is a record best for MECO. (Lower is better).better).The SAID index of 74.82 minutes is ranked fifth best for the last five (5) years. (Lower isTree related outages accounted for 13.07% of the total of all outages for <strong>2004</strong>. Thisremains relatively unchanged from 2003 due to a tree trimming program which continues to havethe support and joint effort of county government and private landowners.Weather related outages accounted for 10.34% of the total of all outages for <strong>2004</strong>, withhigh wind related causes affecting 23,814 customers.Another Kona Storm on February 27 th and February 28 th caused considerable damagedue to thunderstorms, rain and high winds, and was not excluded in the normalized data like theJanuary 14 th storm.The normalized results for <strong>2004</strong> and the previous unnormalized four (4) years 2000 to2003 are shown in the table “MECO Table of <strong>Annual</strong> Service Reliability Indices.” Figures 46 to 49contain the same data shown in graphical form.MECO Table of <strong>Annual</strong> Service Reliability Indices2000 2001 2002 2003 <strong>2004</strong>Number of Customers 57,000 58,308 59,410 60,651 61,846Customer Hrs.38,288 50,665 29,201 48,567 77,122InterruptedCustomer-Interruptions 27,987 37,691 34,388 45,446 99,424ASA (Percent) 99.9929 99.9901 99.9943 99.9908 99.9858SAIF (Occurrence) 0.491 0.646 0.579 0.749 1.608CAID (Minutes) 75.65 80.65 50.95 64.12 46.54SAID (Minutes) 37.15 52.14 29.49 48.<strong>05</strong> 74.82
<strong>Public</strong> <strong>Utilities</strong> <strong>Commission</strong> <strong>Annual</strong> Report <strong>2004</strong>-<strong>05</strong>State of Hawaii Page 73Figure 46MECO Average Service Availability (ASA)(Higher is better)100.00099.99599.992999.9943Percent99.99099.990199.990899.98599.985899.9802000 2001 2002 2003 <strong>2004</strong>*<strong>Year</strong>(<strong>2004</strong>* Data normalized to exclude 1/14/04 storm)1.81.6Figure 47MECO System Average Interruption Frequency (SAIF)(Lower is better)1.6081.41.2Interruptions1.00.80.60.40.4910.6460.5790.7490.20.02000 2001 2002 2003 <strong>2004</strong>*<strong>Year</strong>(<strong>2004</strong>* Data normalized to exclude 1/14/04 storm)
<strong>Public</strong> <strong>Utilities</strong> <strong>Commission</strong> <strong>Annual</strong> Report <strong>2004</strong>-<strong>05</strong>State of Hawaii Page 74100Figure 48MECO Customer Average Interruption Duration (CAID)(Lower is better)8080.6575.656064.12Minutes4<strong>05</strong>0.9546.542002000 2001 2002 2003 <strong>2004</strong>*<strong>Year</strong>Note: <strong>2004</strong>* Data normalized to exclude 1/14/04 storm80Figure 49MECO System Average Interruption Duration (SAID)(Lower is better)74.826<strong>05</strong>2.14Minutes4037.1548.<strong>05</strong>29.492002000 2001 2002 2003 <strong>2004</strong>*<strong>Year</strong>Note: <strong>2004</strong>* Data normalized to exclude 1/14/04 storm
<strong>Public</strong> <strong>Utilities</strong> <strong>Commission</strong> <strong>Annual</strong> Report <strong>2004</strong>-<strong>05</strong>State of Hawaii Page 753. HELCO <strong>2004</strong> SERVICE QUALITY – NORMALIZED ANDUNNORMALIZED RESULTS.The following HELCO electric utility service quality discussion is based on or excerpteddirectly from the HELCO <strong>Annual</strong> Service Reliability Report <strong>2004</strong> submitted to the <strong>Commission</strong> byHELCO. The report covers the <strong>2004</strong> calendar year. A complete copy is available for review atthe <strong>Commission</strong>’s office and will be made available on the <strong>Commission</strong>’s website.The average customer count in <strong>2004</strong> was 70,124, an increase of about 6% over 2003.In <strong>2004</strong> a total of 417,462 customer interruptions and a total of 388,891 customer hours ofinterruption were recorded. The SAIF index was 5.953 and the CAID index was 55.89 minutes.Storms and generation related outages severely impacted HELCO’s system reliability in <strong>2004</strong>.Storms during the first three (3) months of the year and again in November brought highwinds and lightning that caused 81,<strong>05</strong>2 customer interruptions and a total of 92,229 customerhours of interruption. Storm conditions were experienced on January 14-15, January 23-29,February 27-March 2, and November 23-28. The stormy conditions experienced on February 27,caused damage that required several days to complete repairs. This storm alone accounted for13,295 customer interruptions and 26,896 hours of customer interruption. Much of the stormrelated damage was due to high winds causing trees and branches to fall into power lines. A totalof 68,108 customer interruptions were related to trees and branches in <strong>2004</strong> of which 55,940were attributed to stormy conditions. There were a total of 24,030 customer interruptions due tohigh winds and 57,022 customer interruptions due to lightning in <strong>2004</strong>.There were 230,670 generation related customer interruptions in <strong>2004</strong>, of which 89,233were related to HELCO generation sources and 141,437 were related to non-HELCO generationsources. In <strong>2004</strong> Hamakua Energy Partners (“HEP”) was the only non-HELCO generationsource to cause customer interruptions.Other leading causes of customer interruptions were equipment failure causing 26,601customer interruptions, automobile accidents causing 10,809 customer interruptions and cablefault causing 6,272 customer interruptions.In <strong>2004</strong> HELCO normalized data per guidelines specified in a special report on reliabilityprepared for the <strong>Commission</strong>. This report, "Methodology for Determining Reliability Indices forHELCO <strong>Utilities</strong>," dated December 1990, indicates that normalization may be utilized for"abnormal" situations such as hurricanes, tsunamis, earthquakes, floods, catastrophic equipmentfailures, and a single equipment outage that cascades into a loss of load that is greater than 10%of the system peak load. HELCO has normalized data for the <strong>2004</strong> events listed below:• Severe weather events occurring on:o January 14-15 due to high windso January 23-29 due to storm conditionso February 27 – March 2 due to storm conditionso November 23-28 due to storm conditions• Underfrequency Load shedding events on:o January 19 due to HELCO CT-4o January 20 due to HEPo February 20 due to HEPo March 14 due to HEPo April 11 due to HEPo April 12 due to HEPo May 17 due to HEPo May 21 due to HELCO CT-4o August 11 due to HEPo October 10 due to HEP
<strong>Public</strong> <strong>Utilities</strong> <strong>Commission</strong> <strong>Annual</strong> Report <strong>2004</strong>-<strong>05</strong>State of Hawaii Page 76ooNovember 14 due to HELCO CT-3November 15 due to HEPGraphs of the ASA (Figure 50), SAIF (Figure 51), and CAID (Figure 52) for the six (6)years are included below.Figure 50HELCO Average Service Availability (ASA)(Higher is better)100.00099.99099.98099.97099.98699.98899.97699.973Normalized ASAActual ASA99.962*Percent99.96099.95099.95599.95999.96299.95899.94099.93799.93099.9201999 2000 2001 2002 2003 <strong>2004</strong><strong>Year</strong>(*Data normalized to account for "abnormal" situations)
<strong>Public</strong> <strong>Utilities</strong> <strong>Commission</strong> <strong>Annual</strong> Report <strong>2004</strong>-<strong>05</strong>State of Hawaii Page 777.000Figure 51HELCO System Average Interruption Frequency (SAIF)(Lower is better)6.000Normalized SAIFActual SAIF5.1374.258Interruptions5.0004.0003.0004.459 4.3072.9624.2583.1512.0001.4321.5132.335*1.0000.0001999 2000 2001 2002 2003 <strong>2004</strong><strong>Year</strong>(*Data normalized to account for "abnormal" situations)70.00Figure 52HELCO Customer Average Interruption Duration (CAID)(Lower is better)60.0<strong>05</strong>0.0<strong>05</strong>1.9143.0353.2547.2652.1663.2455.8955.3*Minutes40.0030.0029.6642.2420.0010.00Normalized CAIDActual CAID0.001999 2000 2001 2002 2003 <strong>2004</strong><strong>Year</strong>(*Data normalized to account for "abnormal" situations)
<strong>Public</strong> <strong>Utilities</strong> <strong>Commission</strong> <strong>Annual</strong> Report <strong>2004</strong>-<strong>05</strong>State of Hawaii Page 78The normalized and unnormalized reliability results for 1999 to <strong>2004</strong> are shown below inthe “HELCO Table of <strong>Annual</strong> Service Reliability Indices.”HELCO Table of <strong>Annual</strong> Service Reliability Indices1999 2000 2001 2002 2003 <strong>2004</strong>Number of Customers 60,585 61,796 63,207 64,660 66,034 70,124Normalized:*Customer Interruptions 88,461 95,604 278,507 195,614 213,873 163,745Customer Hours Interrupted 76,532 68,562 137,659 154,064 154,064 150,9<strong>05</strong>ASA (Percent) 99.986 99.988 99.976 99.973 99.962 99.976SAIF (Occurrence) 1.432 1.513 4.307 2.962 3.151 2.335CAID (Minutes) 51.91 43.03 29.66 47.26 63.24 55.30Not Normalized:Customer Interruptions 88,461 281,818 278,507 339,184 289,027 417,462Customer Hours Interrupted 76,532 250,115 137,659 238,789 251,280 388,891ASA (Percent) 99.986 99.955 99.976 99.959 99.958 99.937SAIF (Occurrence) 1.432 4.459 4.307 5.137 4.258 5.953CAID (Minutes) 51.91 53.25 29.66 42.24 52.16 55.89*Note: Data normalized to account for “abnormal situations.4. KIUC <strong>2004</strong> SERVICE QUALITY – UNNORMALIZED RESULTS.The KIUC electric utility service quality report was based on or excerpted directly from theMonthly Interruption Summary Report submitted to the <strong>Commission</strong>. The report covers the <strong>2004</strong>calendar year. A complete copy is available for review at the <strong>Commission</strong>’s office and will bemade available on the <strong>Commission</strong>’s website.The average number of electric customers increased 2.75%, from 32,069 in 2003 to32,950 in <strong>2004</strong>. The <strong>2004</strong> system peak demand of 76.750 mWs was recorded on the evening ofDecember 30, <strong>2004</strong>. The <strong>2004</strong> system peak demand increased by 3.77 mWs or 5.17% over2003’s peak of 72.980 mWs, set during the evening of October 23, 2003.KIUC has not normalized any of its data for the period 2000 through <strong>2004</strong>. The reliabilityindices are calculated using the data from all system interruptions except scheduled interruptionsfor maintenance.Graphs of the ASA (Figure 53), SAIF (Figure 54), CAID (Figure 55), and SAID (Figure 56)for the five (5) years are included below.The ASA index of 99.9648% in <strong>2004</strong> is 0.0024% lower than 2003’s, 99.9672% and is thelowest in five (5) years.The SAIF index of 6.98 occurrences in <strong>2004</strong> has declined by 9.70% from 7.73occurrences, in 2003.The CAID index of 26.26 minutes in <strong>2004</strong> is the highest in five (5)-years, and 17.08%higher than 2003’s CAID, 22.43 minutes.The SAID index of 184.92 minutes is the highest in five (5) years, and 6.63% higher than2003’s SAID, 173.42 minutes.
<strong>Public</strong> <strong>Utilities</strong> <strong>Commission</strong> <strong>Annual</strong> Report <strong>2004</strong>-<strong>05</strong>State of Hawaii Page 79There were a total of thirty-nine (39) interruptions for <strong>2004</strong>. Eighteen (18) transmissionand distribution interruptions, or 46.15% of the year’s total interruptions, caused 27.40% of all kWlosses for the year. Fifteen (15) generation interruptions, or 38.46% of the yearly interruptions,caused a total kW loss of 33.06% for the year. Interruptions relating to the Kapaia PowerStation’s 26.4 mW combustion turbine (“CT”) and the four-StorkWarsilla Diesel units at the PortAllen Power Station (“PAPS”) contributed to the year’s kW generation losses of 29.87% and33.56%, respectively. The remaining 36.56% of the kW generation losses were attributed toPAPS’s CTs No. 1, No. 2 and the steam turbine. Six (6) external events, including but not limitedto storms, contributed to 15.39% of all interruptions for <strong>2004</strong>, or 39.54% of all kWs lost for theyear. A single storm event in early <strong>2004</strong> accounted for 21.58% of all kWs lost for the entire year.The unnormalized reliability results for 2000, 2001, 2002, 2003 and <strong>2004</strong> are shown inthe table “KIUC <strong>Annual</strong> Service Reliability Indices.” Figures 53 to 56 contain the data discussedabove in graphical form.KIUC <strong>Annual</strong> Service Reliability Indices2000 2001 2002 2003 <strong>2004</strong>Number of Customers 30,503 30,965 31,487 32,069 32,950Customer Interruptions 27 26 32 43 39Customer Hours Interrupted 30,296 24,013 38,235 92,646 100,874ASA (Per cent) 99.9887 99.9911 99.9861 99.9672 99.9648SAIF (Occurrences) 3.43 2.61 5.03 7.73 6.98CAID (Minutes) 17.36 17.86 14.49 22.43 26.26SAID (Minutes) 59.54 46.62 72.89 173.42 184.92
<strong>Public</strong> <strong>Utilities</strong> <strong>Commission</strong> <strong>Annual</strong> Report <strong>2004</strong>-<strong>05</strong>State of Hawaii Page 80Figure 53KIUC Average Service Availability (ASA)(Higher is better)99.995099.990099.985099.988799.991199.9861Percent99.980099.975099.970099.965099.967299.964899.96002000 2001 2002 2003 <strong>2004</strong><strong>Year</strong>Figure 54KIUC System Average Interruption Frequency (SAIF)(Lower is better)9.0008.0007.0007.736.986.000Interruptions5.0004.0003.435.033.0002.0002.611.0000.0002000 2001 2002 2003 <strong>2004</strong><strong>Year</strong>
<strong>Public</strong> <strong>Utilities</strong> <strong>Commission</strong> <strong>Annual</strong> Report <strong>2004</strong>-<strong>05</strong>State of Hawaii Page 81Figure 55KIUC Customer Average Interruption Duration (CAID)(Lower is better)30.0025.0026.2620.0017.8622.43Minutes15.0017.3614.4910.0<strong>05</strong>.000.002000 2001 2002 2003 <strong>2004</strong><strong>Year</strong>Figure 56KIUC System Average Interruption Duration (SAID)(Lower is better)200180160140173.42184.92120Minutes10080604<strong>05</strong>9.5446.6272.892002000 2001 2002 2003 <strong>2004</strong><strong>Year</strong>
<strong>Public</strong> <strong>Utilities</strong> <strong>Commission</strong> <strong>Annual</strong> Report <strong>2004</strong>-<strong>05</strong>State of Hawaii Page 825. ELECTRIC UTILITIES GENERATING EFFICIENCY RESULTS.The following provides the annual heat rate values for HECO, HELCO, MECO, and KIUCfor the past three (3) years. Heat rates are measured in btu/kWh, and equate to the amount ofenergy consumed by the generating units (in btu) per kWh of electricity produced. The heat ratesprovide a measure of the generating efficiency of the utility, with a lower value indicative ofgreater generating efficiency. The heat rate is generally dependent on the age and type ofgenerating units used by a given utility. Figure 57 shows the 2002, 2003, and <strong>2004</strong> heat rates forthe electric utilities.Figure 57Electric Utility Heat Rates14,50014,00013,500Heat Rate (BTU/KWH)13,00012,50012,00011,50011,00010,50010,0009,5009,0002002 2003 <strong>2004</strong>HECO 10,436 10,452 10,621HELCO 13,861 13,881 13,591MECO 10,367 10,400 10,157KIUC 10,515 10,340 9,618<strong>Year</strong>B. TELECOMMUNICATIONS UTILITIES EFFICIENCY AND SERVICEQUALITY.The following service quality data was provided by Hawaiian Telcom in its monthlyreports to the <strong>Commission</strong> as required under HAR Sections 6-80-92 through -98. Figures 58to 69 show Hawaiian Telcom’s service quality results for the last three (3) years.
<strong>Public</strong> <strong>Utilities</strong> <strong>Commission</strong> <strong>Annual</strong> Report <strong>2004</strong>-<strong>05</strong>State of Hawaii Page 83Figure 58Total Customer Trouble Reports Per 100 LinesObjectiveActualReports Per 100 Lines8.006.004.002.000.00Jul-02Sep-02Nov-02Jan-03Mar-03May-03Jul-03Sep-03Nov-03Jan-04Mar-04May-04Jul-04Sep-04Nov-04Jan-<strong>05</strong>Mar-<strong>05</strong>May-<strong>05</strong>Total Customer Trouble Reports Per 100 Lines - This performance area measurescustomer network trouble reports per 100 access lines. It is calculated by taking the totalcustomer network trouble reports divided by total access lines times 100. As shown in Figure 58,Hawaiian Telcom met the objective for this performance standard during the period reported.Figure 59Dial Tone Speed - Percent Dial Tone Within 3 SecondsObjectiveActualPercent100.0099.0098.0097.0096.0095.0094.00Jul-02Sep-02Nov-02Jan-03Mar-03May-03Jul-03Sep-03Nov-03Jan-04Mar-04May-04Jul-04Sep-04Nov-04Jan-<strong>05</strong>Mar-<strong>05</strong>May-<strong>05</strong>Dial Tone Speed - % Dial Tone Within 3 Seconds - This performance area measuresthe percentage of calls receiving dial tone within three (3) seconds. It is calculated by taking thenumber of calls in which dial tone was provided within three (3) seconds divided by the totalnumber of calls times 100. Figure 59 shows Hawaiian Telcom’s performance for this standardduring the period reported. During the Fiscal <strong>Year</strong>, in particular, Hawaiian Telcom’s dial tonespeed met the objective every month.
<strong>Public</strong> <strong>Utilities</strong> <strong>Commission</strong> <strong>Annual</strong> Report <strong>2004</strong>-<strong>05</strong>State of Hawaii Page 84Figure 60Dial Service Results - Percent CompletionObjectiveActual100.00Percent99.0098.0097.0096.00Jul-02Sep-02Nov-02Jan-03Mar-03May-03Jul-03Sep-03Nov-03Jan-04Mar-04May-04Jul-04Sep-04Nov-04Jan-<strong>05</strong>Mar-<strong>05</strong>May-<strong>05</strong>Dial Service Results - % Completion - This performance area measures callcompletion performance on interoffice trunk groups. It is calculated by taking the number ofunblocked calls on interoffice trunk groups divided by the total number of attempts on interofficetrunk groups times 100. As shown in Figure 60, Hawaiian Telcom met its objective for thisperformance standard during the period reported.Figure 61Percent Out-of-Service Troubles Cleared in 24 HoursObjectiveActual100.00Percent80.0060.0040.0020.00Jul-02Sep-02Nov-02Jan-03Mar-03May-03Jul-03Sep-03Nov-03Jan-04Mar-04May-04Jul-04Sep-04Nov-04Jan-<strong>05</strong>Mar-<strong>05</strong>May-<strong>05</strong>% OOS Trouble Cleared in 24 Hours - This performance area measures customer outof-service(“OOS”) network trouble reports cleared within 24 working hours. It is calculated bytaking the total customer OOS network reports cleared within 24 working hours divided by thetotal customer OOS network trouble reports times 100. As shown in Figure 61, Hawaiian Telcomhad difficulty meeting this standard throughout the Fiscal <strong>Year</strong>.
<strong>Public</strong> <strong>Utilities</strong> <strong>Commission</strong> <strong>Annual</strong> Report <strong>2004</strong>-<strong>05</strong>State of Hawaii Page 85Figure 62Percent of Operator Toll CallsAnswered Within 10 SecondsObjectiveActual95.0090.0085.0080.00Jul-02Sep-02Nov-02Jan-03Mar-03May-03Jul-03Sep-03Nov-03Jan-04Mar-04May-04Jul-04Sep-04Nov-04Jan-<strong>05</strong>Mar-<strong>05</strong>May-<strong>05</strong>Percent% Operator Toll Calls Answered Within 10 Seconds - This performance areameasures the number of calls handled within ten (10) seconds divided by the total number of callshandled times 100 for calls to the toll operator. As shown in Figure 62, Hawaiian Telcom met theobjective for this performance standard during the period reported.Figure 63Percent of Operator Directory Assistance CallsAnswered Within 10 Seconds95.0090.00ObjectiveActualPercent85.0080.0075.00Jul-02Sep-02Nov-02Jan-03Mar-03May-03Jul-03Sep-03Nov-03Jan-04Mar-04May-04Jul-04Sep-04Nov-04Jan-<strong>05</strong>Mar-<strong>05</strong>May-<strong>05</strong>% Operator Directory Assistance Calls Answered Within 10 Seconds - Thisperformance area measures the number of calls handled within ten (10) seconds divided by thetotal number of calls handled times 100 for calls to the directory assistance operator. As shownin Figure 63, except for a brief period in late 2002, Hawaiian Telcom met the objective for thisperformance standard during the period reported.
<strong>Public</strong> <strong>Utilities</strong> <strong>Commission</strong> <strong>Annual</strong> Report <strong>2004</strong>-<strong>05</strong>State of Hawaii Page 86Figure 64Percent of Repair Calls Answered Within 20 Seconds100.00ObjectiveActual95.0090.0085.0080.00Jul-02Sep-02Nov-02Jan-03Mar-03May-03Jul-03Sep-03Nov-03Jan-04Mar-04May-04Jul-04Sep-04Nov-04PercentJan-<strong>05</strong>Mar-<strong>05</strong>May-<strong>05</strong>% Repair Calls Answered Within 20 Seconds - This performance area measures thenumber of calls answered within twenty (20) seconds divided by the total number of calls times100 for calls to the repair answer center. As shown in Figure 64, except February <strong>2004</strong>,Hawaiian Telcom met the objective for this performance standard during the period reported.Figure 65Percent Repair Commitments MetPercent100.0090.0080.0070.0060.00ObjectiveActualJul-02Sep-02Nov-02Jan-03Mar-03May-03Jul-03Sep-03Nov-03Jan-04Mar-04May-04Jul-04Sep-04Nov-04Jan-<strong>05</strong>Mar-<strong>05</strong>May-<strong>05</strong>% Repair Commitments Met - This performance area measures the repair ticketscompleted by the committed due date. It is calculated by taking the total customer networktrouble reports for which the commitments were met divided by total customer network troublestimes 100. As shown in Figure 65, Hawaiian Telcom has had difficulty attaining the targetedobjective on a consistent basis, but it showed improvement during the second half of the Fiscal<strong>Year</strong>.
<strong>Public</strong> <strong>Utilities</strong> <strong>Commission</strong> <strong>Annual</strong> Report <strong>2004</strong>-<strong>05</strong>State of Hawaii Page 87Figure 66Percent Installations Completed Within 3 DaysPercent100.0098.0096.0094.0092.0090.0088.00ObjectiveActualJul-02Sep-02Nov-02Jan-03Mar-03May-03Jul-03Sep-03Nov-03Jan-04Mar-04May-04Jul-04Sep-04Nov-04Jan-<strong>05</strong>Mar-<strong>05</strong>May-<strong>05</strong>% Installations Completed Within 3 Days - This performance area measures thepercent of basic orders completed within three (3) working days. It is calculated by taking thetotal installation (“I”), move (“M”) and change (“C”) basic orders completed within three (3)working days divided by the total number of I, M and C orders times 100. As shown in Figure 66,Hawaiian Telcom has had difficulty attaining the targeted objective on a consistent basis, but itshowed improvement in May and June 20<strong>05</strong>.Figure 67Percent Combined Business Installation/Billing Office Calls Answered Within 20Seconds100.00ObjectiveActualPercent95.0090.0085.0080.00Jul-02Sep-02Nov-02Jan-03Mar-03May-03Jul-03Sep-03Nov-03Jan-04Mar-04May-04Jul-04Sep-04Nov-04Jan-<strong>05</strong>Mar-<strong>05</strong>May-<strong>05</strong>% Combined Business Installation/Billing Office Calls Answered Within20 Seconds - This performance area measures the number of calls answered within twenty (20)seconds divided by the total number of calls times 100 for calls to the business installation andbilling center. As shown in Figure 67, Hawaiian Telcom attained the targeted objectivethroughout the Fiscal <strong>Year</strong>, except in May 20<strong>05</strong>.
<strong>Public</strong> <strong>Utilities</strong> <strong>Commission</strong> <strong>Annual</strong> Report <strong>2004</strong>-<strong>05</strong>State of Hawaii Page 88Figure 68Percent Combined Residence Installation/Billing Office Calls AnsweredWithin 20 Seconds95.00ObjectiveActual90.0085.0080.0075.0070.00Jul-02Sep-02Nov-02Jan-03Mar-03May-03Jul-03Sep-03Nov-03Jan-04Mar-04May-04Jul-04Sep-04Nov-04Jan-<strong>05</strong>Mar-<strong>05</strong>May-<strong>05</strong>Percent% Combined Residence Installation/Billing Office Calls Answered Within20 Seconds - This performance area measures the number of calls answered within twenty (20)seconds divided by the total number of calls times 100 for calls to the residence installation andbilling center. As shown in Figure 68, except for a brief period in mid 2002, Hawaiian Telcom haddifficulty meeting the objective for this performance standard at the start and end of the Fiscal<strong>Year</strong>.Figure 69Percent Installation Commitments Met100.00ObjectiveActualPercent95.0090.0085.00Jul-02Sep-02Nov-02Jan-03Mar-03May-03Jul-03Sep-03Nov-03Jan-04Mar-04May-04Jul-04Sep-04Nov-04Jan-<strong>05</strong>Mar-<strong>05</strong>May-<strong>05</strong>% Installation Commitments Met - This performance area measures the percent ofbasic orders where the work for the customer is complete and service is available for use by nolater than the commitment made to the customer. It reflects the percent as calculated by takingthe installation (“I”), move (“M”) and change (“C”) order installation commitments met divided bythe total number of I, M and C orders taken times 100. As shown in Figure 69, Hawaiian Telcommet the objective for this performance standard during the period reported.
<strong>Public</strong> <strong>Utilities</strong> <strong>Commission</strong> <strong>Annual</strong> Report <strong>2004</strong>-<strong>05</strong>State of Hawaii Page 89C. RENEWABLE PORTFOLIO STANDARDS.In 2001, the Hawaii State Legislature (“Legislature”) passed Act 272, SLH 2001(“Act 272”), which is now codified in HRS Sections 269-91 through 269-94. Act 272 was adoptedfor the purpose of lessening Hawaii’s dependence on imported oil by, among other things,establishing goals for electric utility companies in implementing renewable portfolio standards byincluding a minimum percentage of renewable energy resources within an overall resourceportfolio.Act 272 specifically stated that “[e]ach electric utility company that sells electricity forconsumption in the State shall establish a renewable portfolio standard goal of:(1) Seven per cent of its net electricity sales by December 31, 2003;(2) Eight per cent of its net electricity sales by December 31, 20<strong>05</strong>; and(3) Nine per cent of its net electricity sales by December 31, 2010.”Act 272 also allowed an electric utility company and its electric utility affiliates toaggregate their renewable portfolios in order to achieve the renewable portfolio standard. Forexample, HECO and its affiliates, HELCO and MECO, may add together their renewable energynumbers to meet the requisite goal.In <strong>2004</strong>, the Legislature passed Act 95, SLH <strong>2004</strong> (“Act 95”), which amended HRSSections 269-27.2, 269-91, 269-92, and added HRS Section 269-95. Act 95 was adopted for thepurpose of decreasing Hawaii’s need to import large amounts of oil, and increase importsubstitution, economic efficiency, and productivity, by increasing the use and development ofHawaii’s renewable energy resources through a partnership between the State and the privatesector.Act 95 increased the percentage of net electricity sales that an electric utility mustachieve in 2010 from nine (9) to ten (10) per cent and established new milestones for 2015 and2020 of fifteen (15) and twenty (20) per cent, respectively. The <strong>Commission</strong> is required todetermine if an electric utility company is unable to meet the renewable portfolio standards in acost-effective manner, or as a result of circumstances beyond its control which could not havebeen reasonably anticipated or amelioratedAct 95 required the <strong>Commission</strong> to: (1) Develop and implement a utility ratemakingstructure by December 31, 2006 to provide incentives that will encourage electric utilitycompanies to use cost-effective renewable energy resources to meet renewable portfoliostandards; (2) Determine the proposed ratemaking structure’s impact on utility companies’ profitmargins; (3) Contract with the Hawaii Natural Energy Institute of the University of Hawaii toconduct independent studies on the capability of Hawaii’s electric utility companies to achieverenewable portfolio standards in a cost-effective manner and on projected standards for five (5)and ten (10) years beyond the current standards; (4) Revise the standards based on the bestinformation available at the time if the studies conflict with the established standards; and(5) Report its findings to the 2009 Legislature and every five (5) years thereafter.The definition of “Renewable energy” was amended by Act 95. “Renewable energy”means electrical energy produced by wind, solar energy, hydropower, landfill gas, waste toenergy, geothermal resources, ocean thermal energy conversion, wave energy, biomassincluding municipal solid waste, biofuels, or fuels derived from organic sources, hydrogen fuelsderived from renewable energy, or fuel cells where the fuel is derived from renewable sources.Where biofuels, hydrogen, or fuel cell fuels are produced by a combination of renewable andnonrenewable means, the proportion attributable to the renewable means shall be credited asrenewable energy. Where fossil and renewable fuels are co-fired in the same generating unit, theunit shall be considered to produce renewable electricity in direct proportion to the percentage of
<strong>Public</strong> <strong>Utilities</strong> <strong>Commission</strong> <strong>Annual</strong> Report <strong>2004</strong>-<strong>05</strong>State of Hawaii Page 90the total heat value represented by the heat value of the renewable fuels. It also means electricalenergy savings brought about by the use of solar and heat pump water heating, seawater airconditioning district cooling systems, solar air conditioning and ice storage, quantifiable energyconservation measures, use of rejected heat from co-generation and combined heat and powersystems excluding fossil-fueled qualifying facilities that sell electricity to electric utility companies,and central station power projects.Any electric utility company not meeting the renewable portfolio standard by the goaldates set forth above must report to the <strong>Commission</strong> within ninety (90) days following the goaldates, and provide an explanation for not meeting the renewable portfolio standards. The<strong>Commission</strong> has the option to either grant a waiver from the renewable portfolio standard or anextension for meeting the prescribed standard. The <strong>Commission</strong> may also provide incentives toencourage electric utility companies to exceed their renewable portfolio standards or to meet theirrenewable portfolio standards ahead of time, or both.As of December 31, <strong>2004</strong>, all electric utility companies in the State reached andexceeded not only the seven (7) per cent target set for 2003, but the eight (8) per cent 20<strong>05</strong>target, as well. Accordingly, no waivers or extensions were necessary for these targets.Specifically, HECO, HELCO and MECO, in the aggregate, reported on June 27, 20<strong>05</strong>that they have reached a consolidated renewable energy penetration of 11.4 per cent, as ofDecember 31, <strong>2004</strong>. The remaining electric utility company, KIUC, reported on March 18, 20<strong>05</strong>that renewable energy resources supplied 13.2 per cent of KIUC’s net electricity sales, as ofDecember 31, <strong>2004</strong>.XI.LEGISLATION ENACTED BY 20<strong>05</strong> LEGISLATURE AFFECTINGPUBLIC UTILITIES.A. THE 20<strong>05</strong> LEGISLATURE ENACTED THE FOLLOWING LEGISLATIVEMEASURES RELATING TO THE PUBLIC UTILITIES COMMISSION:1. TECHNICAL AMENDMENTS TO CHAPTER 269, HRS, ANDACT 141, SLH <strong>2004</strong>.Act 22, SLH 20<strong>05</strong>, (“Act 22”) amends Chapter 269, HRS, by: (1) adding the reference to“Section 271-19” in the definition of “enforcement officer” in Section 269-1, HRS, to conform tothe <strong>2004</strong> amendment of Section 271-38, HRS; (2) changing the reference in Section 269-2(b),HRS, to “Chapter 87, HRS”, the Hawaii <strong>Public</strong> Employees Health Fund law, to Chapter 87A,HRS; (3) replacing “United States Immigration and Naturalization Services” inSection 269-17.5(b), HRS, with “United States Citizenship and Immigration Services,” which wasplaced in the new United States Department of Homeland Security in 2002; and (4) adding thereference to “Section 271-19” in the definition of “enforcement officer” in Section 271-4(15), HRS,to conform to the <strong>2004</strong> amendment of Section 271-38, HRS.Act 22 also amends Act 141, SLH <strong>2004</strong>, (“Act 141”) which established the One CallCenter, codified as Chapter 269E, HRS, by reenacting Sections 269-30 and 269-33, HRS.Act 141, which will be repealed on June 30, 2009, made conforming amendments toSections 269-30 and 269-33, HRS. Act 22 ensures that, at the time of repeal, these sections willrevert to the form in which they read prior to the effective date of Act 141.
<strong>Public</strong> <strong>Utilities</strong> <strong>Commission</strong> <strong>Annual</strong> Report <strong>2004</strong>-<strong>05</strong>State of Hawaii Page 912. PERMIT APPROVALS.Act 68, SLH 20<strong>05</strong>, amends Section 91-13.5, HRS, by exempting proceedings of the<strong>Commission</strong> from the automatic permit approval provisions. Under Section 91-13.5, HRS,agencies must take action to grant or deny any application for business or development-relatedpermits, licenses, and approvals within a maximum time period as adopted in the agency’s rules.If no decision is reached within that time period, the application is automatically approved.3. STANDARDS FOR NET METERED RENEWABLE ENERGYSYSTEMS.Act 69, SLH 20<strong>05</strong>, requires the <strong>Commission</strong> to adopt interconnection standards andregulations removing impediments to the installation of eligible customer-generator systems witha capacity greater than ten (10) kilowatts. Specifically, the <strong>Commission</strong> is required to: (1) setforth safety, performance, and reliability standards and requirements and (2) establish thequalifications for exemption from a requirement to install additional controls, perform or pay foradditional tests, or purchase additional liability insurance.4. NET ENERGY METERING.Act 104, SLH 20<strong>05</strong>, establishes provisions relating to maximum capacity of eligiblecustomer generator. The eligible customer-generator shall have a capacity of not more thanfifty (50) kilowatts. The <strong>Commission</strong> is allowed to increase the maximum allowable capacity. The<strong>Commission</strong> is allowed to increase the total rated generating capacity produced by eligiblecustomer-generators to an amount above .5 per cent of the electric utility’s system peak demand.The <strong>Commission</strong> is authorized to amend the rate structure or standard contract or tariff. Excesselectricity generated by the customer-generator in each monthly billing period is required to becarried over to the next month as a monetary value to the credit of the eligiblecustomer-generator. The electric utility is required to reconcile the eligible customer-generator’selectricity production and consumption of energy for each twelve (12)-month period.5. REGULATION OF SEAWATER AIR CONDITIONING.Act 164, SLH 20<strong>05</strong>, exempts persons who own, control, operate, or manage seawater airconditioning district cooling projects from regulation by the <strong>Commission</strong>. The exemption applieswhen at least fifty (50) per cent of the energy required for the seawater air conditioning districtcooling system is provided by a renewable energy resource, such as cold, deep seawater.6. COMMISSION SALARIES.Act 226, SLH 20<strong>05</strong>, adjusts the salary of the chairperson of the <strong>Commission</strong> by setting itat eighty-seven (87) per cent of the director of the Department of Human ResourcesDevelopment.B. THE 20<strong>05</strong> LEGISLATURE ENACTED OTHER UTILITY-RELATEDMEASURES RELATING TO:1. APPROPRIATION FOR WIRELESS ENHANCED 911 FUND.Act 42, SLH 20<strong>05</strong>, makes an emergency appropriation of $3,<strong>05</strong>0,000 for the WirelessEnhanced 911 Fund (“Fund”), which is administered by the State Department of Accounting andGeneral Services, to reimburse public safety answering points and wireless providers fortechnical improvements and for the operating costs of the Fund. Act 159, SLH <strong>2004</strong>, whichestablished the Fund, did not provide an appropriation from the Fund.
<strong>Public</strong> <strong>Utilities</strong> <strong>Commission</strong> <strong>Annual</strong> Report <strong>2004</strong>-<strong>05</strong>State of Hawaii Page 922. WIRELESS ENHANCED 911 BOARD.Act 49, SLH 20<strong>05</strong>, amends the composition of the wireless enhanced 911 board (“board”)by including the Comptroller as a voting member of the board and removing the Director of Healthfrom the board. As stated above, Act 159, SLH <strong>2004</strong>, established the board within the StateDepartment of Accounting and General Services to administer the Fund.3. UNCLAIMED PROPERTY OF ELECTRIC UTILITYCOOPERATIVES.Act 52, SLH 20<strong>05</strong>, amends Chapter 421C, HRS, by exempting electric utility cooperativeassociations from Chapter 523A, the Uniform Unclaimed Property Act. This measure enables anelectric utility cooperative association to retain and utilize unclaimed property funds for theirmembers and the community. Electric utility cooperative associations are required to file anannual report of unclaimed property with the Director of Finance and remain responsible for thepayment of all claims relating to unclaimed property. All non-escheat patronage refunds must betransferred to a nonprofit corporation incorporated pursuant to Chapter 414D. These refundsmust be used for electric energy assistance programs, charitable and community organizations,educational scholarships, and benefit of the general membership of the cooperative.4. SPRBS FOR ELECTRIC UTILITIES.Act 78, SLH 20<strong>05</strong>, authorizes the Department of Budget and Finance to issue up to$160,000,000 in SPRBs to assist HECO, MECO, and HELCO with capital improvement projects.Of the total authorized SPRB amount, $100,000,000 shall be for HECO, $20,000,000 for MECO,and $40,000,000 for HELCO. The <strong>Commission</strong>’s approval is required for any project financed bythe issuance of the SPRBs.5. ASSESSMENT OF PUBLIC SERVICE COMPANY TAX ONPRIVATE SEWER COMPANIES OR FACLITIES.Act 146, SLH 20<strong>05</strong>, authorizes the assessment of the public service company tax on aprivate sewer company or facility by amending the definition of “gross income” in Chapter 239,HRS, to include gross income from the operation a private sewer company or facility.C. DURING THE 20<strong>05</strong> LEGISLATURE, THE FOLLOWING RESOLUTIONRELATING TO UTILITY ISSUES WAS ADOPTED:1. STUDY ON THE FUTURE OF PHOTOVOLTAIC ELECTRICITY INHAWAII.House Resolution No. 159, H.D. 1 requests the Department of Business, EconomicDevelopment and Tourism to prepare a report examining and discussing: (1) the historical pricetrend for photovoltaic electricity use in Hawaii and the mainland United States; (2) the historicalprice trend for utility-provided electricity in Hawaii; (3) the date when these two (2) trends arelikely to converge; and (4) a sensitivity analysis of the previous trends for both financed andnon-financed photovoltaic systems, a high and low future price of petroleum, and other factors.The report is due to the Legislature no later than twenty (20) days prior to the convening of the2006 legislative session.
<strong>Public</strong> <strong>Utilities</strong> <strong>Commission</strong> <strong>Annual</strong> Report <strong>2004</strong>-<strong>05</strong>State of Hawaii Page 93XII.FEDERAL ISSUES AND ACTIVITIES.A. EPA (“U.S. ENVIRONMENTAL PROTECTION AGENCY”)-STATEENERGY EFFICIENCY AND RENEWABLE ENERGY (“EERE”)PROJECTS.In February 20<strong>05</strong>, the <strong>Commission</strong>, through its membership in NARUC, was selected bythe EPA to participate in the newly formed EPA-State EERE Projects. The EPA-State EEREProjects are a joint initiative between state utility regulators from six (6) states and the EPA toexplore ways to encourage use of cost-effective energy efficiency, renewable energy, and cleanenergy resources, while lowering consumer energy bills. Through the EPA-State EERE Projects,the <strong>Commission</strong> seeks to establish and implement policies and practices that will promote cleanand efficient energy resources in Hawaii.B. REVISED FEDERAL RULES ON LOCAL TELEPHONE SERVICECOMPETITIONOn February 20, 2003, the FCC adopted new rules governing competition for localtelephone service through its Triennial Review Order. The rules were formally released onAugust 21, 2003 and became effective on October 2, 2003. Shortly thereafter, however, the ruleswere, in part, vacated pursuant to judgment of the U.S. Court of Appeals for the District ofColumbia Circuit (“D.C. Circuit”) and remanded to the FCC for revision.The D.C. Circuit’s primary objections to the new rules concerned, among other things, theFCC’s nationwide findings that competitive local exchange carriers are impaired without access tounbundled mass market switching and dedicated transport, and the FCC’s delegation of authorityto the state commissions to investigate and make determinations as to impairments within theirrespective jurisdictions.In response to the D.C. Circuit’s decision, the FCC adopted new rules on December 15,<strong>2004</strong>, and issued its Triennial Review Remand Order on February 4, 20<strong>05</strong>. In that order, theFCC established a twelve (12)-month plan for competing carriers to transition away from use ofunbundled mass market switching, high capacity loops and dedicated transport, where they arenot impaired. The Triennial Review Remand Order became effective on March 11, 20<strong>05</strong>.C. BROADBAND OVER POWERLINES (“BPL”).As part of its primary objectives in promoting access to broadband services nationwide,the FCC adopted certain amendments to its rules on October 14, <strong>2004</strong>, to encourage thedevelopment of BPL systems while safeguarding existing licensed services against harmfulinterference. In its simplest terms, BPL is a relatively new technology that provides access tohigh-speed broadband services using communications capabilities of the nation's power grid, andthereby adds another option for receipt of broadband by consumers. This low-power, unlicensedBPL technology provides high speed digital communications capabilities by coupling radiofrequency energy onto either the power lines within the building ("In-House BPL"), or onto themedium voltage power delivery lines ("Access BPL"). In-House BPL systems leverage theuniversally used electrical outlets available within a building, or home, to transmit informationbetween computers and/or other electronic devices, eliminating the need to install new wiresbetween devices and, hence, facilitating the implementation of business or home networks.Access BPL systems, on the other hand, deliver high-speed Internet and other broadbandservices to homes and businesses from the outside. Electric utility companies can use AccessBPL systems to help monitor, and more effectively manage, their electric power distributionoperations, and customers, as end users, can more accurately control consumption.
<strong>Public</strong> <strong>Utilities</strong> <strong>Commission</strong> <strong>Annual</strong> Report <strong>2004</strong>-<strong>05</strong>State of Hawaii Page 94In its October <strong>2004</strong> Report and Order, the FCC recognized the concerns of certainexisting licensed radio service users, in both the private and government sectors, regarding theperception that BPL systems might cause harmful interference to their operations. To addressthat issue, the FCC adopted rules to provide a framework that will both facilitate the rapidintroduction and development of BPL systems while, at the same time, protect licensed radioservices from harmful interference. Specifically, the FCC adopted: (1) new operationalrequirements for BPL to promote avoidance and resolution of harmful interference; (2) newadministrative requirements to aid in identifying BPL installations; and (3) specific measurementguidelines and certification requirements to ensure accurate and repeatable evaluation ofemissions from BPL and other related systems. The FCC is confident that these new rules willpromote the development of BPL systems by removing regulatory uncertainties for BPL operatorsand equipment manufacturers while ensuring that licensed radio services are protected fromharmful interference.Locally, HECO, has advised the <strong>Commission</strong> that it is currently conducting trials ofvarious BPL technologies, and has also begun a pilot program focusing primarily on utilizing thetechnologies to better monitor, manage and control its substantial generation and transmissionassets. It intends also to provide its business and residential customers with the ability to readilyaccess, either on demand, or at scheduled intervals, readings of their own power consumptioninformation, enabling them to better manage their individual operating and energy costs. HECOis presently installing new, advanced meters that will assist in these BPL enabled initiatives. Itbelieves that it can accomplish all the above and still have available bandwidth on their powerlines to accommodate Internet and Voice over Internet Protocol services. The <strong>Commission</strong> ismonitoring these issues as they develop on both the national and state levels.D. VOICE OVER INTERNET PROTOCOL (“VOIP”)."Internet Voice Communications," also known as VoIP, is a relatively new technologyenabling telephone calls to be made using broadband Internet connection instead of thetraditional (analog) phone line. VoIP technology converts voice signals from a telephone intopacketed digital signals that travel over the Internet and are then reassembled into voice signalson the receiving end.The <strong>Commission</strong> recognizes that the regulatory environment, with respect to VoIPtechnology and services, is rapidly evolving on both federal and state levels. VoIP regulatoryissues continue to be extensively examined by the FCC, state commissions, and public andprivate interest groups. Included among these issues are: (1) whether VoIP services should beextensively regulated on both the national and state levels; (2) whether VoIP services should beclassified as "telecommunications" or "information" services under the Telecommunications Act of1996; and (3) whether VoIP services should be required to fulfill social policy obligations such asuniversal service, traditional public safety services (i.e., E911 and the ability to comply with lawenforcement requirements), and necessary safeguards for consumer protection and disabilityaccess.In February <strong>2004</strong>, the FCC initiated a major rulemaking proceeding (WC DocketNo.04-36) to address and clarify the regulatory status of VoIP services, in response to mountingconcern throughout the telecommunications industry that an air of regulatory uncertainty wasstifling growth. In addition, several individual states, including Minnesota, were beginning toplace their own regulations on VoIP providers, threatening the fledgling sector with a patchwork ofdivergent state regulations. In an important development, in November <strong>2004</strong>, the United StatesCourt of Appeals for the Eighth Circuit affirmed a lower federal court ruling that the Minnesota<strong>Public</strong> <strong>Utilities</strong> <strong>Commission</strong> could not regulate voice calls made via VoIP like those made ontraditional telephone lines. The Appeals Court noted that the FCC, in its Memorandum Opinionand Order No. 04-264, WC Docket No. 03-211, had found that, among other things, the interstateand intrastate components of VoIP service could not be separated and, therefore, could not be
<strong>Public</strong> <strong>Utilities</strong> <strong>Commission</strong> <strong>Annual</strong> Report <strong>2004</strong>-<strong>05</strong>State of Hawaii Page 95regulated by the state without interfering with or negating federal policy and rules. Since theEighth Circuit's ruling, several states, including Minnesota, have appealed that FCC order.With respect to VoIP and public safety services such as E911, the FCC in May 20<strong>05</strong> (WCDocket No. <strong>05</strong>-196), took steps to protect the growing number of VoIP subscribers by requiring allinterconnected VoIP service providers to adopt E911 solutions as a top priority, and by placingobligations on interconnected VoIP providers that are similar to those placed on traditionaltelephone service providers, within the limitations of current technology.Locally, the <strong>Commission</strong> granted a certificate of authority to Time Warner CableInformation Services, LLC on October 22, <strong>2004</strong> to provide VoIP services in the State. It alsocontinues to monitor federal activities relating to VoIP for possible impact to Hawaii consumers.XIII. PREVIEW FISCAL YEAR 20<strong>05</strong>-06.In Fiscal <strong>Year</strong> 20<strong>05</strong>-06, the key proceedings and activities of the <strong>Commission</strong> include:(1) a proceeding to establish One Call Center fees; (2) rule-making proceedings; and(3) workshops on renewable portfolio standards.The following sections highlight the significant proceedings opened in Fiscal<strong>Year</strong> 20<strong>05</strong>-06.A. COMMISSION INSTITUTES PROCEEDING TO ESTABLISH FEES FORONE CALL CENTER.In August 20<strong>05</strong>, the <strong>Commission</strong> instituted a proceeding to determine the appropriatefees and assessments to finance the administration and operation of the One Call Center.Pursuant to Section 269E-6, HRS, operators are required to pay to the <strong>Commission</strong> a fee basedon a schedule determined by the <strong>Commission</strong>. The <strong>Commission</strong> is also allowed to assess feeson excavators. The intervenors in this proceeding include: (1) Waikokoa Sanitary SewerCompany, Inc., dba West Hawaii Sewer Company; (2) Waikoloa Resort <strong>Utilities</strong>, Inc., dba WestHawaii Utility Company; (3) Waikoloa Water Company, Inc., dba West Hawaii Water Company;(4) Hawaiian Telcom; (5) Sandwich Isles Communications, Inc.; (6) Makena Wastewater Corp.;(7) South Kohala Wastewater Corp.; (8) Board of Water Supply; (9) Time Warner Telecom ofHawaii, L.P., dba Oceanic Communications; (10) Time Warner Entertainment Company, L.P.,dba Oceanic Timer Warner Cable; (11) Pacific Lightnet, Inc.; (12) HECO, HELCO, and MECO;and (13) Hawaii-American Water Company.B. RULE-MAKING PROCEEDINGS.In Fiscal <strong>Year</strong> 20<strong>05</strong>-06, the <strong>Commission</strong> intends to begin proceedings to develop andadopt administrative rules for the following:Implementation of the “Gasoline Price Cap Law.”Purpose: Adopt rules, as may be necessary, to implement Act 242, SLH <strong>2004</strong>,codified in HRS Chapter 486H, as amended (i.e., procedures for filing petitionsand standards for rendering adjustments to the gas price cap factors).Implementation of the “Renewable Portfolio Standards Law.”Purpose: Adopt rules implementing Act 95, SLH <strong>2004</strong>, codified in HRSChapter 269, as amended (i.e., development and implementation of a utility
<strong>Public</strong> <strong>Utilities</strong> <strong>Commission</strong> <strong>Annual</strong> Report <strong>2004</strong>-<strong>05</strong>State of Hawaii Page 96ratemaking structure which may include, without limitation, performance-basedratemaking to provide incentives that encourage Hawaii’s electric utilitycompanies to use cost-effective renewable energy resources found in Hawaii tomeet the renewable portfolio standards established in HRS Section 269-92).Establishment of the Policies and Framework Relating to Docket No. 03-0371 –Investigation Concerning Distributed Generation.Purpose: Docket No. 03-0371 was opened to investigate distributed generation,and the <strong>Commission</strong> intends to develop, by administrative rulemaking, thepolicies and framework to govern participation in Hawaii’s electricity marketthrough distributed generation.Implementation of the “One Call Center Law.”Purpose: Adopt rules implementing Act 141, SLH <strong>2004</strong>, codified in HRSChapter 269, as amended (i.e., procedures for filing complaints and establishinga mechanism to assess fees on operators and excavators).Draft HAR Chapter 6-70, Standards for Electric Utility Service.Purpose: (1) Revise, update and convert General Order No. 7, Standards forElectric Utility Service in the State of Hawaii, into HAR format; (2) revise andtransfer the applicable provisions of HAR Chapter 6-60, Standards for Electricand Gas Utility Services in the State of Hawaii, to the proposed HARChapter 6-70; and (3) repeal General Order No. 7 and HAR Chapter 6-60.Draft HAR Chapter 6-72, Standards for Gas Service, Calorimetry, Holders &Vessels.Purpose (1) Revise, update and convert General Order No. 9, Standards for GasService, Calorimetry, Holders & Vessels in the State of Hawaii, into HAR format;(2) revise and transfer the applicable provisions of HAR Chapter 6-60, Standardsfor Electric and Gas Utility Services in the State of Hawaii, to the proposed HARChapter 6-72; and (3) repeal General Order No. 9 and HAR 6-60.Draft HAR Chapter 6-73, Installation, Operation, and Maintenance of Overheadand Underground Electrical Supply and Communications Lines.Purpose: (1) Repeal General Orders No. 6, Rules for Overhead Electric LineConstruction in the State of Hawaii, and No. 10, Rules for Construction ofUnderground Electric and Communications Systems; and (2) the adoption ofHAR Chapter 6-73 in place of General Orders No. 6 and 10.C. RENEWABLE PORTFOLIO STANDARDS WORKSHOPS.The <strong>Commission</strong> has begun to implement the provisions set forth in Act 95, relating torenewable portfolio standards. Act 95 requires the <strong>Commission</strong> to perform the following:1. By December 31, 2006, develop and implement a utility ratemaking structure thatmay include but is not limited to performance-based ratemaking, to provideincentives encouraging Hawaii’s electric utilities to use cost-effective renewableenergy resources found in Hawaii to meet the renewable portfolio standardsestablished in Section 269-92, HRS, while allowing for deviations from thestandards in the event that the standards cannot be met in a cost-effectivemanner, or as a result of circumstances that could not have been reasonably
<strong>Public</strong> <strong>Utilities</strong> <strong>Commission</strong> <strong>Annual</strong> Report <strong>2004</strong>-<strong>05</strong>State of Hawaii Page 97anticipated or ameliorated and are beyond the control of the utility; and2. Gather, review, and analyze data to determine the extent to which any proposedutility ratemaking structure would impact electric utilities’ profit margins, and toensure that these profit margins do not decrease as a result of theimplementation of the proposed rate structure. 24The <strong>Commission</strong> selected a collaborative workshop approach to encourage publicdiscussion of its work-in-progress. The <strong>Commission</strong> observes that the successful design andimplementation of regulation seem to result from balanced, open, and inclusive discussions, like,for example, collaborative workshops. A series of workshops involving stakeholders is likely tofacilitate the identification of key issues and the development of appropriate policies that areexpected to enjoy broad support. It also provides the <strong>Commission</strong> with an opportunity toarticulate its vision for regulatory policy in Hawaii.The <strong>Commission</strong> held two (2) of three (3) planned two-day workshops: the first onNovember 22 and 23, <strong>2004</strong> and the second on October 3 and 4, 20<strong>05</strong>. The third workshop isscheduled for early 2006. The <strong>Commission</strong> also held its first technical workshop on October 5,20<strong>05</strong> to gather information and comments to its approach to simulate, using a computer model,Hawaii’s energy market. For the first two (2) workshops, the <strong>Commission</strong> published a papermany weeks before each workshop, describing its approach along with actual or expectedresults, and invited stakeholders to provide written comments. The deadline for the submission ofwritten stakeholder comments has ranged from one (1) to two (2) weeks before the workshop.Prior to each workshop, the <strong>Commission</strong> published a schedule describing a sequence ofpresentations and panel discussions at the workshop.The goals of the first scheduled workshop were to describe and gather comments on the<strong>Commission</strong>’s methodology in fulfilling its legislative mandate. The goals of the second workshopwere to analyze the design and implementation of various RPS programs in the U.S., to examinepotential alternative renewable energy resources in Hawaii, and to identify proposed or potentialratemaking structures and incentives consisting of candidate RPS components and incentiveregulation mechanisms for implementing Hawaii’s RPS. The goals of the third planned workshopare to further describe and gather additional comments on the incentive regulation mechanismspreferred by the <strong>Commission</strong>, based upon the input provided at the second workshop, to reviewpreliminary simulation results for Hawaii’s power market, and to discuss an outline for potentialadministrative rules that the <strong>Commission</strong> may adopt to implement the mandates of Act 95.24 In 20<strong>05</strong>, the <strong>Commission</strong> sought an amendment to the legislation to remove therequirement that the <strong>Commission</strong> ensure that electric utilities’ profit margins do not decrease, butto affirm that the opportunity of electric utilities to earn a reasonable rate of return shall not bediminished as a result of the implementation of the proposed rate design. The <strong>Commission</strong> willcontinue to support legislation seeking to achieve such an amendment.