OFFSHORE WIND FARM LAYOUT OPTIMIZATION (OWFLO ...
OFFSHORE WIND FARM LAYOUT OPTIMIZATION (OWFLO ...
OFFSHORE WIND FARM LAYOUT OPTIMIZATION (OWFLO ...

You also want an ePaper? Increase the reach of your titles
YUMPU automatically turns print PDFs into web optimized ePapers that Google loves.
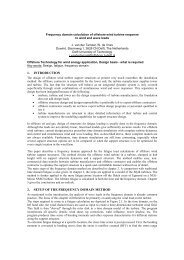
<strong>OFFSHORE</strong> <strong>WIND</strong> <strong>FARM</strong> <strong>LAYOUT</strong> <strong>OPTIMIZATION</strong> (<strong>OWFLO</strong>) PROJECT:AN INTRODUCTIONC. N. Elkinton * , J. F. Manwell, J. G. McGowanUniversity of Massachusetts, Mechanical and Industrial Engineering Dept.,160 Governors Dr., Amherst, MA 01003, USA* celkinto@ecs.umass.eduABSTRACTOptimizing the layout of an offshore wind farm presents a significant engineering challenge.Most of the optimization literature to date has focused on land-based wind farms, rather thanon offshore farms. The conventional method used to lay out a wind farm combines a turbinecost model and a wake model in conjunction with an optimization routine. In offshoreenvironments, however, factors such as operation and maintenance (O&M) and availabilityalso play significant roles in the design of a wind farm. To better account for these and theother critical factors that distinguish offshore wind farms from their onshore counterparts, theOffshore Wind Farm Layout Optimization (<strong>OWFLO</strong>) project was launched in 2004. Theobjective is to develop an analysis tool that unites offshore turbine micrositing criteria withefficient optimization algorithms. The project combines wake and component cost models,but also includes O&M, availability, and electrical interconnection models. When integratedwithin an appropriate optimization routine, these “sub-models” will work together to betterreflect the real-world conditions and constraints unique to individual offshore sites. The<strong>OWFLO</strong> project will consider several optimization algorithms—including heuristic andgenetic methods—to minimize the cost of energy while maximizing the energy production ofthe wind farm.This paper summarizes the results from the first year of this on-going project. Thedevelopment of the component models and analysis software is discussed in detail and someinitial results are compared with existing wind farms. A summary of the current and futurephases of the project is also presented.Keywords: offshore wind energy, optimization, micrositing, cost model, wake modelAll information contained within this paper is clear of copyright restrictions.
<strong>OFFSHORE</strong> <strong>WIND</strong> <strong>FARM</strong> <strong>LAYOUT</strong> <strong>OPTIMIZATION</strong> (<strong>OWFLO</strong>) PROJECT:AN INTRODUCTIONC. N. Elkinton * , J. F. Manwell, J. G. McGowanUniversity of Massachusetts, Mechanical and Industrial Engineering Dept.,160 Governors Dr., Amherst, MA 01003, USA* celkinto@ecs.umass.eduABSTRACTOptimizing the layout of an offshore wind farm presents a significant engineering challenge.Most of the optimization literature to date has focused on land-based wind farms, rather thanon offshore farms. The conventional method used to lay out a wind farm combines a turbinecost model and a wake model in conjunction with an optimization routine. In offshoreenvironments, however, factors such as operation and maintenance (O&M) and availabilityalso play significant roles in the design of a wind farm. To better account for these and theother critical factors that distinguish offshore wind farms from their onshore counterparts, theOffshore Wind Farm Layout Optimization (<strong>OWFLO</strong>) project was launched in 2004. Theobjective is to develop an analysis tool that unites offshore turbine micrositing criteria withefficient optimization algorithms. The project combines wake and component cost models,but also includes O&M, availability, and electrical interconnection models. When integratedwithin an appropriate optimization routine, these “sub-models” will work together to betterreflect the real-world conditions and constraints unique to individual offshore sites. The<strong>OWFLO</strong> project will consider several optimization algorithms—including heuristic andgenetic methods—to minimize the cost of energy while maximizing the energy production ofthe wind farm.This paper summarizes the results from the first year of this on-going project. Thedevelopment of the component models and analysis software is discussed in detail and someinitial results are compared with existing wind farms. A summary of the current and futurephases of the project is also presented.Keywords: offshore wind energy, optimization, micrositing, cost model, wake model1 INTRODUCTIONThe University of Massachusetts Amherst, MIT, and the Woods Hole OceanographicInstitute have established an offshore wind energy collaborative. Funded by theMassachusetts Technology Collaborative (MTC), GE Energy, and the US Dept. of Energy(US DOE), this collaborative is addressing some of the most significant research questions inthe realm of offshore wind energy in the US. This project represents a part of this research.In the US, offshore wind farms may eventually exist primarily in deep water and manykilometers from shore. Due to local opposition as well as physical constraints imposed by thebathymetry, deeper water away from land looks like an appealing option. It is wellunderstood, however, that farms of this nature are more expensive than those closer to shore
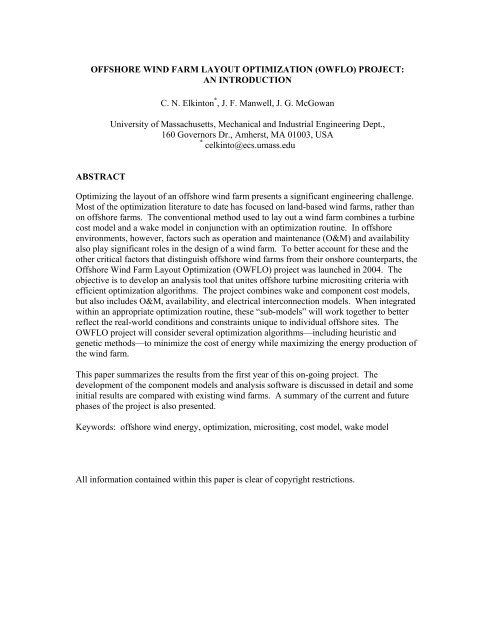
and in shallow waters. In order to begin to quantify the magnitude of this cost difference, amethod of modeling the costs of wind farms in varying water depths and at varying distancesfrom shore is needed. With this type of model, the economic constraints of offshore windenergy can be better understood. This project seeks to provide this economic model.A note on nomenclature. This paper will make every effort to follow the naming conventionbeing finalized by the offshore wind working group of the International ElectrotechnicalCommission. Figure 1 is given here for reference.rotor-nacelle assemblytowertowersupportstructurep l a t f o r mwater levelp i l es u b - s t ructuresub-structuresea floorseabedpilefoundationFigure 1 - Turbine component nomenclature [18]1.1 Project objectiveThe goal of the Offshore Wind Farm Layout Optimization (<strong>OWFLO</strong>) project is thedevelopment of a software tool that will streamline the micrositing process. By combiningenergy models, cost models for the major wind farm components, and an optimizationalgorithm, the cost of energy (COE) can be minimized while accounting for real-worldconstraints. The following wind farm component cost models are included:► turbine cost► support structure cost► electrical interconnection cost► operation and maintenance (O&M) cost► installation and decommissioning costsThe following energy models are also used:► single turbine power production► turbine wake► electrical line loss► availabilityThe <strong>OWFLO</strong> tool is being designed to perform two functions: layout analysis and layoutoptimization. By using the optimization routine, the user will get the optimum layout. Then,if the layout is adjusted for aesthetic, practical, or other reasons, the analysis routine will
show how much energy is lost through these adjustments. This overall concept is illustratedin Figure 2.Figure 2 - The optimization and analysis routines will be used together to refine a wind farm layoutThe analysis feature is being developed first. With it, the user will be able to evaluate thecosts and energy production of a predefined layout. The cost and energy models listed abovewill be applied to the specified layout, and the software will report the expected overall costsand energy production.The optimization capabilities will allow the software to search for the layout configurationwith the lowest COE and/or the greatest energy production based on the results of the models.This part of the project is scheduled to be developed during the coming year.1.2 BackgroundDetermining the optimum layout for an offshore wind farm involves many tradeoffs. Forexample, the further the turbines are from shore, the higher the wind speeds and the greaterthe energy production. However, the electrical cable costs and O&M costs increasesignificantly with distance from shore, so the costs also increase. Another example is thespacing of the turbines. Placing turbines close together reduces the electrical cable costs. Bydoing so, however, the total energy decreases and the turbulence increases which decreasesthe component overall lifetime. There is a need for efficient ways to find these balances andthis project is an effort to provide one.Several previous studies, which have direct relevance to <strong>OWFLO</strong> project, are available in theliterature. These range from studies of scaling relations for various turbine components tonon-wind-related studies in placement optimization. The most relevant ones are summarizedhere.1.2.1 Wind farm costsSeveral major European projects have looked at the scaling of turbine components. One wasthe Structural and Economic Optimisation of Bottom-Mounted Offshore Wind EnergyConverters (Opti-OWECS) study [12]. The Opti-OWECS study investigated the state of theart of offshore wind turbines from 1996 to 1997 and endeavored to determine methods bywhich to lower the COE from offshore wind farms over the following 10 years. The Opti-OWECS study covered, in varying detail, the economics of offshore turbines, supportstructures, electrical interconnection, installation, siting, layout, and O&M options. Startingwith the then (1997) state of the art, new designs and strategies were projected through the
following 10 years. The Opti-OWECS study was regarded as the definitive work on thesubject of offshore turbines when it was published. It contains some very detailed andspecific cost information that has direct application in the <strong>OWFLO</strong> project.The cost components upon which the <strong>OWFLO</strong> project is concentrated are those identified bythe Opti-OWECS and OWECOP (Offshore Wind Energy – Cost and Potential) projects(Table 1). The OWECOP project is currently underway at ECN and is focused on thedevelopment of software to model offshore wind farm costs in a given geographic area. TheOWECOP software combines simplified engineering models (using an Excel spreadsheet)with Geographic Information Systems (GIS) [11]. It is similar in concept to the <strong>OWFLO</strong>project, but the <strong>OWFLO</strong> project considers at micrositing issues whereas the OWECOPproject looks at broader wind farm siting issues.Table 1 - Major cost components of an offshore wind farmComponent% of energy cost(Opti-OWECS)% ofInstalled cost(OWECOP)Turbines and34 25towerSub-structure and24 11foundationO&M 23 17Electrical15 17interconnectionInstallation and included in above 18decommissioningOther 4 12The Dutch Offshore Wind Energy Converter (DOWEC) project [8] looked at ways ofimproving offshore wind turbine design and increasing their cost-effectiveness. The projectlooked to identify ways to design and build better, more reliable large turbines (5-6 MW) forlarge (100s of MW) farms because. The DOWEC study, conducted from 1997 - 2003,examined electrical, O&M, support structure, and turbine costs as well as turbine wakes. Thescaling relationships given in the reports have been adapted for use in the <strong>OWFLO</strong> project.It should be noted that there are commercial products which are currently used to lay outwind farms, including WindFarm (ReSoft, UK), WindFarmer (Garrad Hassan, UK), andWindPRO (EMD, Denmark). WindPRO, for example, was used in the SEA<strong>WIND</strong> report [6].Their latest report gave several relations for wind farm costs, but stated that further work onthe optimization and layout capabilities was required.1.2.2 Turbine wakesConsiderable effort has gone into understanding turbine wakes in offshore environments. Agood example of this is the ENDOW project [2]. The primary goal of the EfficientDevelopment of Offshore Windfarms (ENDOW) project was to link boundary-layer andturbine wake models to better determine the wind shear and turbulence profiles inside largeoffshore wind farms. The ENDOW project was headed by Risoe and included model fromten organizations in Europe. During the course of the project, improvements to each of thewake models were identified and implemented.
1.2.3 Placement optimizationWhen the analysis part of the <strong>OWFLO</strong> software has been completed and validated, theoptimization routine will be developed. Typically, gradient (“hill-climbing”) optimizationmethods are able to find local maxima or minima, but not necessarily the overall maximum orminimum. In addition, analyzing each possibility becomes computationally intensive. Forexample, if each cell in the farm grid can have 2 possible states—contains a turbine or doesnot contain a turbine—then even for a small 10 x 10 grid, there are 2 100 ≈ 10 30 possible casesto evaluate. None of the wind farm optimization papers reviewed used gradient methods.Instead, two alternative approaches have been suggested: heuristic and genetic optimizationalgorithms. Each of these algorithms uses an element of randomness to dislodge the solutionfrom the local minima in an effort to find the overall minimum. These methods will be theprimary focus when the optimization routine is developed. The applicability to wind energyof each of these methods has been investigated and is available in the literature. See thestudy from Hawaii Pacific University and the University of Pittsburgh [17] for information ofa heuristic algorithm. Information on the use of genetic algorithms can be found in [14,15,7].2 PROJECT DESCRIPTION AND METHODOLOGY2.1 Project scheduleThe first phase of the project analyzes wind farms with fixed turbines in shallow water. Thefocus of this phase is on the development of the component models. Simple versions of themodels are being used, starting with models discussed in the literature. This first phase willhave been completed by September 2005.During the second phase, the optimization routine will be added. From the literature, the twomost applicable optimization routines are the heuristic and genetic algorithms. These willboth be considered for this project. Additional emphasis will be placed on the developmentof an intuitive, graphical user interface.The focus of the third phase of the project will be to use the <strong>OWFLO</strong> tool to investigate deepwaterinstallations. The objective for this phase is to begin to quantify site parametersrequired in order to develop economically-viable deep-water wind farms. During this phase,the existing models will be refined and more sophisticated models will be added to improvethe accuracy of the results. In addition, the software tool will be taught to optimize windfarms in deep water. The major change from the shallow water conditions is expected to bethe support structure model. This final phase of the project should be complete by September2006.2.2 Software architectureThe structure of the <strong>OWFLO</strong> software is modular (Figure 3). The main benefit of a modularstructure is flexibility: as additional or more robust models are developed, they can be addedwithout requiring major revision of the code. For example, if additional wake models areadded, the modular structure will allow the user to select the wake model they wish to use.The expected inputs and outputs have been identified during the literature search, so adding anew model only changes the way the outputs are calculated.
One of the objectives of the optimization is the minimization of the COE. As shown inFigure 4, the COE is comprised of two essentially independent functions: the cost of thesystem (the numerator) and the energy the system produces (the denominator). Furthermore,the cost function is made up of several component costs which are also independent. If, intime, additional factors are determined to contribute to the system cost, they can be added tothe numerator without affecting the other components or models.Figure 3 - Modular structure of <strong>OWFLO</strong> softwareFigure 4 - Cost of energy (COE) functionSome phenomena affect both the costs and the energy production. The electricalinterconnection, for example, consists of cables which have a cost. At the same time,however, energy is lost during transmission through these cables. In order to keep thefunctions in the numerator and denominator separate, this phenomenon is treated using twomodels, the electrical interconnection cost model and the transmission loss model. Otherphysical phenomena such as O&M and availability are separated in a similar manner.2.3 Component modelsAt the time this paper was written, a wake model, an O&M cost model, and cost models forgravity base and monopile foundations had been either chosen or developed. These firstmodels are simple but give reasonably realistic results. During the second phase of theproject, these models will be refined. Installation costs are still under investigation.The inputs to the component models include the following parameter:► RNA mass (either modeled or from )► rotor diameter► rated power► hub height► thrust and power coefficients► time series of wind speed and direction► water depth► distance to shore► soil bearing capacity
The first 4 parameters can either be modeled or come from manufacturers’ specifications.For the purposes of the initial phase of the project, the latter option has been chosen.2.3.1 Support structure costAs shown in Figure 1, the support structure consists of the tower, sub-structure, andfoundation. For gravity base and monopile structures, these components are modeled usingalgorithms based on several works [3,16,21,4]. These algorithms use characteristics of theRNA (e.g. mass, hub height, and rotor diameter) and soil properties as inputs and return themasses, costs, and dimensions of the components. Examples of results using these modelsare given below.The support structure models currently do not take wave height or breaking waves intoaccount. These factors are important in foundation design and will be included in futurerevisions of the models.2.3.2 O&M costNo complete mathematical model of offshore wind farm O&M costs has been found in theliterature. Many studies have investigated availability, component failure, and maintenancestrategies. See, for example, [20,5]. Estimating the cost of O&M remains, however, acomplicated process. Until a mathematical model capable of dealing with this complexityhas been developed, a very simplified model will be used instead. The simplest model of theannual O&M costs is a fixed percentage of the capital cost. Several of these percentages arediscussed in the literature. Based on the Opti-OWECS report [13], an annual O&M costequal to 2% of the capital cost is used.2.3.3 Wake modelConsiderable research has gone into understanding the wind flow within wind farms, bothonshore and offshore. Projects like ENDOW highlight the fact that there are several differentapproaches to modeling this flow, from empirical and analytical models to complex CFDmodels. For the <strong>OWFLO</strong> project, models that are mathematically describable are moreuseful, so the wake model developed in [10], which has been cited in many simple turbinewake studies, will be used.⎛ U ⎞ 2aDeficit = ⎜1−⎟ =(1)2⎝ U0⎠ ⎛ x ⎞⎜1+ k ⎟⎝ R ⎠Here, U is the wind speed of interest, U 0 is the unaffected wind speed, a is the axial inductionfactor, k is the wake spreading constant proposed in [15], x is the distance downstream, and Ris the rotor radius.The wake calculation starts by determining a wake for a single turbine which spreads linearlydownstream and decays according to a wake decay coefficient. In this model, the wind speedwithin the wake is assumed to be constant in cross-section because the primary goal is tomodel the energy deficit in the wake, not the actual wind speed. It should be noted that byassuming a linearly spreading wake, the non-linear near-wake region is ignored, making themodel only applicable to distances greater than approximately 4 rotor diameters downstream.
3 INITIAL RESULTS / ANALYSISTo check the accuracy of the support structure models, parameters from 3 existing windfarms were modeled. The actual and model values are compared in tables below.The Horns Rev farm uses monopiles for its 80 Vestas 2 MW turbines (80 m rotor, 70 m hubheight). Monopiles were also used at Arklow Bank for the 7 GE Energy 3.6 MW turbines(104 m rotor, 74 m hub height). Middelgrunden consists of 20 Bonus 2 MW turbines (76 mrotor, 64 m hub height) on gravity base foundations. Information about the farms is availablefrom [9,1,19].Table 2 - Horns Rev (monopiles)Parameter Actual Model ErrorTower top dia. (m) 2.6Tower base dia. (m) 4 4.6 15%Tower mass (1000 kg) 160 118 -26%Tower cost (1000 $) 177Pile dia. (m) 4 4.6 15%Pile mass (1000 kg) 200 192 -4%Pile cost (1000 $) 432Pile embedment (m) 25 21.6 -14%Pile thickness (m) 0.05 0.055 10%Table 3 - Arklow Bank (monopiles)Parameter Actual Model ErrorTower top dia. (m) 3 3.1 3%Tower base dia. (m) 5 5.2 4%Tower mass (1000 kg) 160 179 12%Tower cost (1000 $) 269Pile dia. (m) 5 5.2 4%Pile mass (1000 kg) 282Pile cost (1000 $) 635Pile embedment (m) 30 32.9 10%Pile thickness (m) 0.062Table 4 – Middelgrunden (gravity bases)Parameter Actual Model ErrorTower top dia. (m) 2.5Tower base dia. (m) 4.3Tower mass (1000 kg) 85 102 20%Tower cost (1000 $) 152Foundation dia. (m) 17 17.6 4%Base mass (1000 kg) 1652 1790 8%Base cost (1000 $) 475 502 6%Support structure cost / rated power [$/kW]550500450400350300250Gravity baseMonopile2000 10 20 30 40 50Water depth [m]Figure 5 - Cost of the support structure normalizedby the rated power.The models are also useful for studying trends. An interesting example of this is the changein foundation cost with water depth. Figure 5 shows the costs of support structures (includingthe tower) designed to carry a GE Energy 3.6 MW turbine. For the sake of generality, thecosts have been normalized by the rated power of the turbine. The costs of the gravity basehave been calculated assuming that it is installed on glacial till (as is the case atMiddelgrunden) and the monopile costs assume sand (similar to Arklow Bank).4 CONCLUSIONSFrom the work completed during this first phase of the <strong>OWFLO</strong> project, a number ofconclusions can be drawn. First, there is a perceived need for software that can optimize an
offshore wind farm layout based on COE criteria. This software will be particularly useful asdevelopers look at sites farther from shore and in deeper waters.Simple cost models exist in the literature for some of the most expensive components of anoffshore wind farm. Support structure, O&M, and wake models have been discussed andresults of cost models for gravity base and monopile support structures have been given.Estimated parameter values for gravity base and monopile support structure models werecompared to those from the Middelgrunden, Horns Rev, and Arklow Bank wind farms. Themodel was shown to give foundation parameters to within 10-15%. The tower mass model,in particular, could use improvement.5 FUTURE WORKAt the time this paper was written, the following Phase 1 tasks remained to be completed:► Develop a cost model for electrical costs within the farm and for the transmission to land.► Finalize the simple models for availability and electrical losses.► Incorporate the wake model (which has already been chosen).6 ACKNOWLEDGEMENTSThe authors would like to thank MTC, GE Energy, and the US DOE for their generoussupport on this project.7 REFERENCES[1] Arklow bank website. 2005. Airtricity.www.airtricity.com/opencontent/default.asp?id=397&itemId=397&Section=<strong>WIND</strong>%20<strong>FARM</strong>S.[2] Barthelmie, R. J., et al. "ENDOW (efficient development of offshore wind farms):Modelling wake and boundary layer interactions article." Wind Energy 7 (2004): 225-45.[3] Bulder, B., et al. Dutch offshore wind energy converter; task 12: Cost comparison ofthe selected concepts. Petten, NL: ECN, (ECN-C--01-080), 2000.[4] Coduto, D. P. Foundation design: Principles and practices. 2nd ed. Upper SaddleRiver, NJ: Prentice-Hall, Inc., 2001.[5] Curvers, A. P. W. M., and Rademakers, L. W. M. M. Recoff, wp6: Operation andmaintenance; task 3: Optimisation of the O&M costs to lower the energy costs. Petten, NL:ECN, (ECN-C--04-109), 2004.[6] EMD. Seawind summary. Aalborg, DK: EMD International, 2003. Available:www.emd.dk/WindPRO/WindPRO%20Documentation%20-%20SEA<strong>WIND</strong>.[7] Grady, S. A., Hussaini, M. Y., and Abdullah, M. M. "Placement of wind turbinesusing genetic algorithms." Renewable Energy 30.2 (2005): 259-70.[8] Hendriks, H. B., and Zaaijer, M. B. DOWEC: Executive summary of the publicresearch activities. Petten, NL: ECN, 2004.[9] Horns Rev website. 2005. Elsam. www.hornsrev.dk/Engelsk/default_ie.htm.
[10] Katic, I., Hojstrup, J., and Jensen, N. O. "A simple model for cluster efficiency."European Wind Energy Association Conference and Exhibition. Rome, Italy: A. Raguzzi,1986. pp. 407-10.[11] Kooijman, H. J. T., et al. "Cost and potential of offshore wind energy on the Dutchpart of the north sea." EWEC. Copenhagen, DK, 2001. pp. 218-21. Available:http://www.ecn.nl/cgi-ecn/ecn/reports.pl.[12] Kuhn, M., et al. Opti-OWECS final report vol. 0: Structural and economicoptimisation of bottom-mounted offshore wind energy converters - executive summary.Delft, NL: TU Delft, (IW-98139R), 1998.[13] Kuhn, M., et al. Opti-OWECS final report vol. 2: Methods assisting the design ofoffshore wind energy conversion systems. Delft, NL: TUDelft, (IW-98141R), 1998.[14] Moreno, S. V. Wind farm optimisation. Loughborough, UK: CREST, LoughboroughUniversity, 2001.[15] Mosetti, G., Poloni, C., and Diviacco, B. "Optimization of wind turbine positioning inlarge windfarms by means of a genetic algorithm." Journal of Wind Engineering andIndustrial Aerodynamics 51.1 (1994): 105-16.[16] Nehal, R. S. Foundation design monopile: 3.6 & 6.0 MW wind turbines. Amstelveen,NL: Ballast Nedam Engineering B.V., (DOWEC 052), 2001. Available:http://www.ecn.nl/wind/other/dowec.html.[17] Ozturk, U. A., and Norman, B. A. "Heuristic methods for wind energy conversionsystem positioning." Electric Power Systems Research 70.3 (2004): 179-85.[18] Quarton. "Wind turbines, part 3: Design requirements for offshore wind turbines.".Working Draft ed: International Electrotechnical Commission, 2005.[19] Volund, P., and Hansen, J. Middelgrunden wind turbine co-operative website. 2005.SEAS DENMARK. www.middelgrunden.dk/MG_UK/project_info/mg_40mw_offshore.htm.[20] Zaaijer, M. B., and van Bussel, G. J. W. "Integrated analysis of wind turbine and windfarm." Symposium Offshore-Wind-Energy - Structure, Design and Environmental Aspects ofOffshore-Wind-Energy-Converters. Hannover, DE, 2002.[21] Zaaijer, M. B. Tripod support structure; pre-design and natural frequency assessmentfor the 6 MW DOWEC. Delft, NL: TU Delft, (DOWEC 063), 2002. Available:http://www.ecn.nl/wind/other/dowec.html.