Paper Frequency Domain
Paper Frequency Domain
Paper Frequency Domain

Create successful ePaper yourself
Turn your PDF publications into a flip-book with our unique Google optimized e-Paper software.
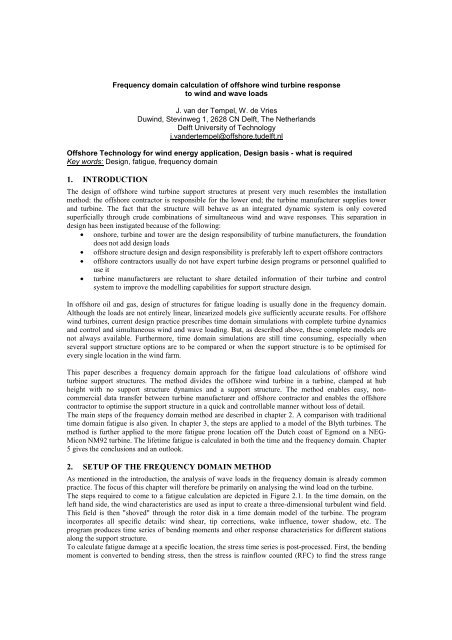
<strong>Frequency</strong> domain calculation of offshore wind turbine responseto wind and wave loadsJ. van der Tempel, W. de VriesDuwind, Stevinweg 1, 2628 CN Delft, The NetherlandsDelft University of Technologyj.vandertempel@offshore.tudelft.nlOffshore Technology for wind energy application, Design basis - what is requiredKey words: Design, fatigue, frequency domain1. INTRODUCTIONThe design of offshore wind turbine support structures at present very much resembles the installationmethod: the offshore contractor is responsible for the lower end; the turbine manufacturer supplies towerand turbine. The fact that the structure will behave as an integrated dynamic system is only coveredsuperficially through crude combinations of simultaneous wind and wave responses. This separation indesign has been instigated because of the following:• onshore, turbine and tower are the design responsibility of turbine manufacturers, the foundationdoes not add design loads• offshore structure design and design responsibility is preferably left to expert offshore contractors• offshore contractors usually do not have expert turbine design programs or personnel qualified touse it• turbine manufacturers are reluctant to share detailed information of their turbine and controlsystem to improve the modelling capabilities for support structure design.In offshore oil and gas, design of structures for fatigue loading is usually done in the frequency domain.Although the loads are not entirely linear, linearized models give sufficiently accurate results. For offshorewind turbines, current design practice prescribes time domain simulations with complete turbine dynamicsand control and simultaneous wind and wave loading. But, as described above, these complete models arenot always available. Furthermore, time domain simulations are still time consuming, especially whenseveral support structure options are to be compared or when the support structure is to be optimised forevery single location in the wind farm.This paper describes a frequency domain approach for the fatigue load calculations of offshore windturbine support structures. The method divides the offshore wind turbine in a turbine, clamped at hubheight with no support structure dynamics and a support structure. The method enables easy, noncommercialdata transfer between turbine manufacturer and offshore contractor and enables the offshorecontractor to optimise the support structure in a quick and controllable manner without loss of detail.The main steps of the frequency domain method are described in chapter 2. A comparison with traditionaltime domain fatigue is also given. In chapter 3, the steps are applied to a model of the Blyth turbines. Themethod is further applied to the more fatigue prone location off the Dutch coast of Egmond on a NEG-Micon NM92 turbine. The lifetime fatigue is calculated in both the time and the frequency domain. Chapter5 gives the conclusions and an outlook.2. SETUP OF THE FREQUENCY DOMAIN METHODAs mentioned in the introduction, the analysis of wave loads in the frequency domain is already commonpractice. The focus of this chapter will therefore be primarily on analysing the wind load on the turbine.The steps required to come to a fatigue calculation are depicted in Figure 2.1. In the time domain, on theleft hand side, the wind characteristics are used as input to create a three-dimensional turbulent wind field.This field is then "shoved" through the rotor disk in a time domain model of the turbine. The programincorporates all specific details: wind shear, tip corrections, wake influence, tower shadow, etc. Theprogram produces time series of bending moments and other response characteristics for different stationsalong the support structure.To calculate fatigue damage at a specific location, the stress time series is post-processed. First, the bendingmoment is converted to bending stress, then the stress is rainflow counted (RFC) to find the stress range
variation histogram. With the proper S-N curve for the detail under consideration, the Miner sum gives thefatigue damage value D miner .The goal of the frequency domain method is to be able to optimise the design of the support structure. Thisrequires complete separation between turbine and support structure in the calculation method. Figure 2.1shows the separate calculation of the turbine loads in step 1 and the derivation of the transfer functionbetween tower top load and support structure bending stress in step 3.Previous studies have demonstrated the effect of the operating turbine on support structure dynamics. Therotor introduces aerodynamic damping, which should be taken into account in the further analysis of thestructure, step 2.Steps 1 to 3 result in a transfer function per wind class for turbulent wind field to support structure bendingstress at any desired location along the structure. By multiplying the square of this transfer function withthe input turbulent wind spectrum, the stress response spectrum can be found.In a separate process, the stress response to the wave loading is determined, step 4. By linearly summingthe ordinates per frequency of wind and wave induced stress response, the total response is found. Thisresponse spectrum can then be used to determine the stress cycles and find the fatigue damage in step 5.Time <strong>Domain</strong>Windinput<strong>Frequency</strong> <strong>Domain</strong>VwtSV( f )fFtop2FE program3AerodynamicdampingσFTRFfF→ σ<strong>Frequency</strong>domain wavesTRFVw→ FTRFVw → σFVwfσV wf4σ () tt1Sσ( f)fSσ( f )fRFC5CyclecountingSSNNDDFigure 2.1 Fatigue calculation in time domain (left) and frequency domain (right)
Step 1: tower top loadingThe non-linear behaviour of the wind turbine in different wind conditions cannot easily be linearized in anoverall and direct manner. Some form of time domain simulation to solve the blade element momentumequations for different wind conditions will usually be required. This approach is used here in a pragmaticway.During or preferably before the design of an offshore wind farm, a turbine manufacturer is selected. It canbe assumed that the manufacturer has a working computer model of his turbine, capable of performing alltypical design calculations prescribed for normal turbine design. To uncouple the turbine calculations fromthe behaviour of the support structure, the structure can be modelled as a rigid structure.The computer model can now be used to calculate time series of the tower top load due to specific windconditions with a mean wind speed, turbulence intensity and wind shear. As output, the tower top load isrecorded. When the time series of both the input wind field time trace and the tower top load are convertedto a spectrum, the transfer function can be derived by dividing both spectra and taking the square root asshown in equation 1:TRFSSF topKármán( f)( f)= (eq. 1)Step 2: Aerodynamic dampingFor an operating turbine, support structure motion and turbine aerodynamics have a significant effect oneach other. When the turbine moves forward (against the wind), the blades experience an increase in totalwind speed. As a result of this increased wind speed, the instantaneous tower top load is increased throughbasic aerodynamic action of the blades. This load is acting against the tower top motion. For backwardmotion, the situation is analogous, now resulting in a reduced tower top load, also reducing the tower topmotion. This effect is known as aerodynamic damping [1] [2]. To separate turbine and support structurecalculations in the frequency domain approach, the aerodynamic damping needs to be calculated for eachwind speed and must be incorporated through an equivalent viscous damping in the dynamic model of thesupport structure. To determine the aerodynamic damping, several methods exist. A dedicated paper onaerodynamic damping is also submitted to this conference to cover this topic [3].Step 3: Dynamic behaviour of the support structureIn step 3, the dimensions of the support structure are processed in a finite element model (FEM). To takethe effect of aerodynamic damping into account, the structural damping factor is increased with the valuederived in step 2. Solving the equations of motion for one or more specific points along the structure undertime varying tower top loads will result in a transfer function between tower top load and bending stress ata specific location.The total transfer function between the turbulent wind field and bending stress can now be found as theproduct of the derived transfer functions from steps 1 and 3. By multiplying the input wind spectrum withthe combined transfer function squared, we find the total bending stress spectrum for the location underconsideration.The different steps to find the wind induced stress response in the frequency domain are shown in Figure2.2.
WindinputAerodynamicdamping, step 2V wind tTurbine, step 1fSV( f)fDynamic modelRigid modelAerodynamicdampingFtop(t)tS ( f)F topfFˆtopVˆwindTRFVwind→ FtopSupport Structure, step 3FtopFE programFtop→ σTRF Ftop→ σˆ σFˆtopfˆ σVˆwindTRF Vwind → σfSσ( f )fFigure 2.2 Flowchart for frequency domain calculationof the stress spectrum due to wind loadingStep 4: Incorporating stress response due to wave excitationThe previous section presented a method to derive the response spectrum for bending stress in the supportstructure due to wind loads on the rotor. For the design of offshore oil & gas structures it is commonpractice to use a frequency domain method for response calculations due to wave excitation. If theresponses due to wind and wave response are assumed to be fully independent, the combined response canbe determined by adding the respective response spectra. The effectiveness of this method was alreadyshown in [4]. The only interaction between the wind turbine and the response of the support structure dueto wave excitation is the aerodynamic damping. The flowchart in Figure 2.3 shows the steps to combine thestress response spectra due to wind and wave loading to obtain the spectrum of the total stress response.
FD windsee figure 2.2AerodynamicdampingFE programwave excitationWaveinputSσ( f)fTRFˆ σˆ ζfζ→ σS ( f ) ζfSσ( f)fSσ( f)fFigure 2.3 Flowchart for adding stress spectra due to wind and wave loadingStep 5: Fatigue damage calculation via spectra of the total stress responseThe method presented in the previous sections will provide a response spectrum for the total stress due towind and wave loading. The final step is to process this spectrum to obtain the cumulative fatigue damageD Miner . Several solutions exist to derive the stress range distribution from the spectral moments of a stressspectrum. The Dirlik method is used here, which is an empirical method based on four moments of thespectrum. This method has been found to give results that compare best with time domain rainflowcounting [5].3. APPLYING THE FREQUENCY DOMAIN METHOD TO THE BLYTHTURBINESTo test the proposed method, an accurate model of an offshore wind turbine is needed. Within the OWTESproject [6], a detailed model was created of the Vestas V66 turbines, which were installed in 1999 off thecoast of Blyth, UK. The measurement and validation project assured that the model of the turbine is highlyaccurate compared with reality. The turbine is modelled in the time domain program Bladed for Windows.To create transfer functions of the support structure, the offshore design program SESAM was used. Next tostandard finite element modelling, this package incorporates all hydrodynamic modelling features requiredfor offshore structure design.For all simulations, the wind climate defined by Germanischer Lloyd was used [7]. GL prescribes a fixedturbulence intensity of 12% for all wind speed classes. Although higher turbulence intensity at lower windspeeds, as prescribed by other standards represents nature better, for the validation of the frequency domainmethod a fixed turbulence intensity is convenient and sufficient. For the wind shear the same standard wasused, giving a shear factor α = 0.12. This is again used for all wind speeds. Waves and currents are notincluded in these wind simulations.Step 1: Transfer function for fluctuating wind speed to tower top loadFirst, a 3D turbulence field is created based on an improved Von Kármán spectrum for a mean wind speedof 10 m/s and a turbulence intensity of 12% in longitudinal direction. Then a simulation is carried out forthe offshore wind turbine model at Blyth. The modal analysis of the support structure is set not toincorporate any modes, which effectively eliminates support structure dynamics. The blade modes are stillactive.After the simulation, a spectrum estimate is determined for the wind speed at the hub. This results in thespectrum shown in Figure 3.1, when plotted on log-linear scale.
10 3 <strong>Frequency</strong> [Hz]spectral density [(m/s) 2 s]10 210 110 010 -110 -2Improved Von Karman time simulationImproved Von Karman theoretical10 -30 0.5 1 1.5 2Figure 3.1 Wind spectrum, mean = 10 m/s, TI = 12%For the resulting tower top load, the response spectrum is obtained by processing the time domainsimulation of the axial load on the rotor axis to a spectrum using the same spectral settings; the result ispresented in Figure 3.2. The effects of rotational sampling at 3P, 6P and 9P are clearly visible.10 11 <strong>Frequency</strong> [Hz]10 10Response spectrum tower top load[N 2 *s]10 910 810 710 610 510 40 0.5 1 1.5 2 2.5 3 3.5 4Figure 3.2 Response spectrum for tower top loadNow, the transfer function can be determined by taking the square root of the response spectrum divided bythe wind spectrum at each frequency. Because the spectral estimates have been created with equal settings,the frequency intervals are the same, making the calculation of the transfer function very straightforward.6 x 104 <strong>Frequency</strong> [Hz]TRF wind speed to tower top load[N/(m/s)]5432100 0.5 1 1.5 2Figure 3.3 Transfer function between wind speed and tower top loadThe mean rotor speed in this simulation is 21 RPM = 0.35 Hz. The 1P peak cannot be distinguished, the 3Pspeed at 1.05 Hz is clearly visible. It has to be noted that the 1 st blade flapping frequency also lies in thisrange, which is, based on the "Campbell-diagram" approach, not entirely an ideal situation.
Step 2: Incorporating aerodynamic dampingThe critical step in the frequency domain method is to incorporate the only interaction between turbineoperation and structural dynamics: aerodynamic damping. To determine its magnitude, several options areavailable, which are detailed in [3]. For this paper, a damping of 4% of the critical damping is used for allwind speed ranges. Although this is not the most accurate figure, it approaches reality sufficiently for thefrequency domain method to be demonstrated.Step 3: Modelling the support structureThe finite element program SESAM was used to derive the transfer function for tower top load to mudlinebending stress. A model of the offshore wind turbine was made and the natural frequency in SESAM wasfound to compare very well with the measured natural frequency and the natural frequency as modelled inBladed. The structural damping was set to 1% and 1 + 4 = 5% of the critical damping, with and withoutaerodynamic damping, respectively. Then a sinusoidal tower top load was applied of 1000 N. This loadwas applied with increasing frequency from 0.01 Hz to 2 Hz in steps of 0.001 Hz, which resulted in thetransfer functions shown in Figure 3.4. The effect of incorporating the aerodynamic damping is clearly verylarge.TRF tower top load tomudline bending stress [(N/m 2 )/N]7000600050004000300020001000TRF without aerodynamic dampingTRF with aerodynamic damping00 0.5 1 1.5 2<strong>Frequency</strong> [Hz]Figure 3.4 Transfer function of mudline bending stress per unit tower top load as function of frequency with onlystructural damping (1%) and 4% additional aerodynamic dampingBy combining the transfer functions of Figure 3.3 and Figure 3.4, the combined transfer function as shownin Figure 3.5 is derived.TRF wind speed tomudline bending stress [(N/m 2 )/(m/s)]5 x 1064.543.532.521.510.500 0.5 1 1.5 2<strong>Frequency</strong> [Hz]Figure 3.5 Combined transfer function of mudline bending stress per unit wind speed as function of frequency,including aerodynamic dampingBy multiplying the combined transfer function squared with the input wind spectrum, we can determine theresponse spectrum for bending stress at the mudline, as shown in Figure 3.6. In the time domain, the timeseries of the mudline bending stress for the same conditions can be found by using a full dynamic model of
the offshore wind turbine (turbine and support structure). The resulting time series of the varying bendingstress can next be transformed to a spectrum through Fast Fourier Transform (FFT). This spectrum is alsoshown in Figure 3.6.Figure 3.6 shows that the results match very well. The shapes are identical and only the peak at 1 Hz, whichcorresponds with both the 3P-blade passing frequency and the first blade flap frequency, is slightly lowerwhen calculated in the frequency domain. Apparently the overlapping of these frequencies influences thesupport structure when all dynamics are modelled in the time domain.3 x 1012 <strong>Frequency</strong> [Hz]Response spectrummudline bending stress [(N/m 2 ) 2 *s)]2.521.510.5Time domain simulationincluding aerodynamic damping<strong>Frequency</strong> domain calculationincluding aerodynamic damping00 0.5 1 1.5 2Figure 3.6 Mudline bending stress response spectra for frequency and time domain calculationsStep 4: Adding wavesNow that the stress response spectrum for turbulent wind has been found, the stress response spectrum forwave loading can be determined. Based on the assumption that wind and waves are completely independent(except for the aerodynamic damping) the wave response is calculated in the frequency domain programSESAM. Figure 3.7 shows the input wave spectrum with H s = 1.75 m and T z = 6 s and the resulting responsespectrum for mudline bending stress. As no wave energy is present at the natural frequency at 0.48 Hz, onlyquasi static response is visible in the right-hand side plot.Wave spectrum [m 2 *s]2.521.510.500 0.2 0.4 0.6 0.8 1<strong>Frequency</strong> [Hz]Stress response due to waves [(N/m 2 ) 2 *s]98765432100 0.2 0.4 0.6 0.8 110 x <strong>Frequency</strong> [Hz]Figure 3.7 Input wave spectrum with H s = 1.75 m and T z = 6 sand the resulting response spectrum for mudline bending stressThe combined stress response spectrum can now be found by combining the wind and wave responsespectra: per frequency step, the spectral ordinates are added to find the combined response as shown inFigure 3.8 where the frequency domain spectrum is compared to the time domain spectrum.
Response spectrummudline bending stress [(N/m 2 ) 2 *s]4 x 10123.532.521.510.5<strong>Frequency</strong> [Hz]Bladed case 4FD case 400 0.2 0.4 0.6 0.8 1Figure 3.8 Mudline bending stress response spectra for combined wind and wave loadingcompared to time domain simulationsThe combination created in Figure 3.8 is designated case 4 in table 1. This table is a selection of typicalenvironmental states at Blyth. These 5 states were modelled in both the time and the frequency domain andtheir resulting mudline bending stress response spectra are plotted in Figure 3.9Table 1. Selection of 5 typical states for testing the frequency domain method against the time domain method from [8]case H s T z V w% ofoccurence1 0.25 2.0 5.0 20.472 0.25 4.0 11.8 21.763 0.75 5.3 5.8 13.254 1.75 6.0 9.9 4.835 3.3 9.7 18.7 0.14Response spectrummudline bending stress [(N/m 2 ) 2 *s]9 x 10¹¹ <strong>Frequency</strong> [Hz]87654321Bladed case 1FD case 1Response spectrummudline bending stress [(N/m 2 ) 2 *s]4.543.532.521.510.55 x 1012 <strong>Frequency</strong> [Hz]Bladed case 2FD case 200 0.2 0.4 0.6 0.8 100 0.2 0.4 0.6 0.8 1Response spectrummudline bending stress [(N/m 2 ) 2 *s]9 x 10¹¹ <strong>Frequency</strong> [Hz]87654321Bladed case 3FD case 3Response spectrummudline bending stress [(N/m 2 ) 2 *s]6 x 10¹³ 54321<strong>Frequency</strong> [Hz]Bladed case 5FD case 500 0.2 0.4 0.6 0.8 100 0.2 0.4 0.6 0.8 1Figure 3.9 Comparison for 4 wind and wave load cases between frequency domain and time domain response spectrafor the mudline bending stressThe figures prove that the frequency domain method works, at least when looking at the graphicrepresentation. The aerodynamic damping of 4% is a functional estimate making the resonance peak at 0.48
Hz match between both methods. Furthermore, the superposition of separate wave and wind induced stressresults in a realistic combined response spectrum. For Blyth the influence of waves on the bending stress isrelatively small. This is of course to be expected as the site is only 6 m deep. Furthermore, the waves do nothave any energy in the range of the structure's natural frequency, which means that no significant waveinduced resonance is to be expected.4. LIFETIME FATIGUE ASSESSMENT IN TIME AND FREQUENCY DOMAIN FORNSW SITETo assess the effectiveness of the frequency domain method with regard to lifetime fatigue calculations(step 5), another turbine and site were selected where wave induced resonance will make fatigue a criticaldesign issue. In 2006 the Near Shore Windfarm off Egmond in the Netherlands will be constructed.Although for the eventual site the Vestas V90 turbines will be used, previous designs were based on theNEG-Micon NM 92 turbine. Since the merger of both companies though, this model has been discontinued.A model of this turbine in Bladed was available for this paper and, as the site coincides with previousstudies [1] [9], the site conditions are known to a high degree of detail. The design under consideration hasa 2.75 MW turbine, a hub height of 70 m above mean sea level and stands in 20 m of water. Furthermore,an 8 m deep scour hole is anticipated in the design. The structure has a natural frequency of 0.31 Hz,making it susceptible to wave induced resonance.The wind and wave data for the site comprise 7 full years of hind-cast data. These have been processed to a3 dimensional scatter diagram where per wind speed interval of 2 m/s for the operational range of theturbine (so 4, 6, 8, .. 24 m/s) a wave scatter diagram for significant wave height (H s ) and zero-crossingperiod (T z ) was produced. This resulted in 112 environmental states. All wind and waves are assumed tocome from only 1 direction. Directionality was neglected for these tests. The 112 states were all simulatedfor a 1 hour period in the time domain in Bladed and directly through the frequency domain method. Tofind the cycles to perform the Miner sum fatigue damage check in the frequency domain, the Dirlik methodwas used. At present, the Dirlik method matches the outcome of time domain rainflow counting mostprecisely and is therefore the best method to be used for this typical comparison. Current developments inthis field have seen the arrival of new and improved methods based on more theoretical foundations [10],but for this paper these have not yet been implemented.The outcome of the time and frequency domain lifetime fatigue checks is presented in table 2. The valuegiven in the Miner sum fatigue damage, which must be less than 1 for the structural detail to satisfy thefatigue limit check. In the frequency domain, two wave transfer functions were created: with and withoutdiffraction correction. As the diameter of the support structure is 4.75 m, small waves with higherfrequencies will be influenced by the presence of the structure, causing diffraction. This phenomenonmakes the wave load calculation method of Morison less valid. To correct the method, the MacCamy-Fuchscorrection factor can be applied in the frequency domain, effectively reducing the inertia coefficient. In theBladed wave modelling module, the correction is simulated by applying a frequency dependent cut-off ofthe input wave spectrum on which the wave time series is based.Table 2. Results of lifetime fatigue check in the time and frequency domain, with and without diffraction correction for112 uni-directional environmental statesBladed time domainwith diffraction cut-off<strong>Frequency</strong> domain withoutdiffraction correction<strong>Frequency</strong> domain withdiffraction correctionD life 0.56 0.70 0.525. CONCLUSIONS AND OUTLOOKThe frequency domain method for calculating the fatigue damage of support structures of offshore windturbines delivers results which are very comparable to the outcome of time domain simulations, bothgraphically, when looking at the stress response spectra and in the final outcome of the fatigue check. Themethod severs the turbine at the yaw bearing and leaves support structure optimisation to the offshorecontractor while the turbine manufacturer only needs to provide a set of tower top loading transferfunctions to a turbine on a support structure without dynamics. The method enables rapid support structureoptimisation. Simple adjustment of the finite element model of the support structure and recreation of
transfer functions are fed into the excel sheet and yield a lifetime fatigue damage within 2 minutes. Afurther advantage of the frequency domain is the direct graphic visibility of peaks in the input, transfer andoutput graphs. This makes it very clear which features need to be targeted to optimise the structure evenfurther. For instance, the effect of aerodynamic damping is easily illustrated, an increase will drasticallyreduce the fatigue damage even further when the input load spectra contain energy in that area.The functioning of the frequency domain method has only been proven for two structures at present.Research is ongoing to further optimise the method with respect to the more detailed estimation ofaerodynamic damping. Further structures and sites will be studied in the near future to prove the generalapplicability. The method is also able to model other structures than just the monopile. Design studies inthis area are ongoing. The execution of the method is currently done in an Excel sheet. This may be alteredto make the method more robust for general use. A project to implement the method at the engineeringdepartment of a large offshore contractor has recently started.The current status of the frequency domain method is that it can be used for preliminary design. Furtherdevelopment and standardisation of the different steps may eventually make it suitable for generalapplication as a final design tool, as is already the case with frequency domain fatigue assessment foroffshore structures subjected to waves only.This paper is part of the PhD thesis "Design of support structures for offshore wind turbines" which will beavailable at the end of 2005 [11].REFERENCES[1] Kühn, M (2001) Dynamics and Design Optimisation of Offshore Wind Energy Conversion SystemsInstitute for Wind Energy, Delft University of Technology ISBN 90-76468-07-9[2] Matthies, HG, et al (1995) Study of Offshore Wind Energy in the EC, Joule I (JOUR 0072) VerlagNatürliche Energie. Brekendorf[3] Cerda Salzmann, D, Tempel, J van der (2005) Aerodynamic damping in the design of supportstructures for offshore wind turbines, Proceedings of the Offshore Wind Energy Conference,Copenhagen Denmark[4] Tempel, J van der (2000) Lifetime Fatigue of an Offshore wind Turbine Support Structure SectionOffshore Technology & Section Wind Energy, Delft University of Technology[5] Dirlik, T (1985) Application of computers in fatigue analysis Ph.D. Thesis, Warwick University[6] Camp, TR et al (2003) Design methods of offshore wind turbines at exposed sites, EU Joule IIIproject JOR3-CT95-0284 Garrad-Hassan & Partners[7] Germanischer Lloyd (2000), Rules & Guidelines 2000: IV Non-marine Technology - Regulationsfor the Certification of (Offshore) Wind Energy Conversion Systems[8] Tempel, J van der (ed.) et al. (2003) Robustness of Design Load Calculations for Offshore WindTurbines OWTES task 4.3, EW-03191, DUWIND, Delft University of Technology[9] Ferguson, MC (ed.) et al. (1998) Opti-OWECS Final Report Vol.4: A typical Design Solution foran Offshore Wind Energy Conversion System Institute for Wind Energy, Delft University ofTechnology[10] Benasciutti, D, Tovo, R (2005), Spectral methods for lifetime prediction under wide-bandstationary random processes, International Journal of fatigue, 27 pp. 867-877[11] Tempel, J van der (2005, forthcoming) Design of support structures for offshore wind turbinesOffshore Engineering & Wind Energy, Delft University of Technology