INAG 39 P - IPS - Radio and Space Services
INAG 39 P - IPS - Radio and Space Services
INAG 39 P - IPS - Radio and Space Services
- No tags were found...

Create successful ePaper yourself
Turn your PDF publications into a flip-book with our unique Google optimized e-Paper software.
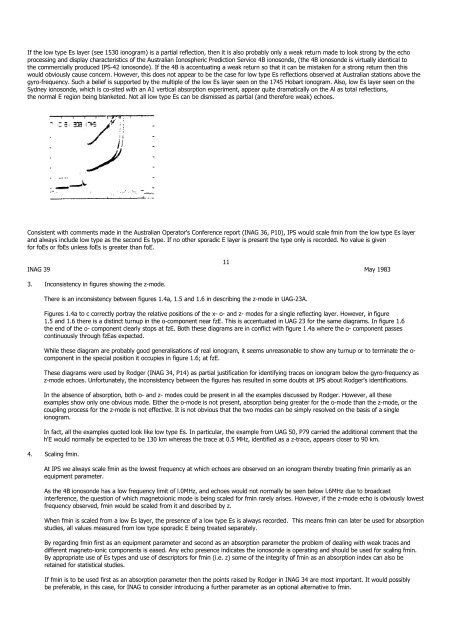
If the low type Es layer (see 1530 ionogram) is a partial reflection, then it is also probably only a weak return made to look strong by the echoprocessing <strong>and</strong> display characteristics of the Australian Ionospheric Prediction Service 4B ionosonde, (the 4B ionosonde is virtually identical tothe commercially produced <strong>IPS</strong>-42 ionosonde). If the 4B is accentuating a weak return so that it can be mistaken for a strong return then thiswould obviously cause concern. However, this does not appear to be the case for low type Es reflections observed at Australian stations above thegyro-frequency. Such a belief is supported by the multiple of the low Es layer seen on the 1745 Hobart ionogram. Also, low Es layer seen on theSydney ionosonde, which is co-sited with an A1 vertical absorption experiment, appear quite dramatically on the Al as total reflections,the normal E region being blanketed. Not all low type Es can be dismissed as partial (<strong>and</strong> therefore weak) echoes.Consistent with comments made in the Australian Operator's Conference report (<strong>INAG</strong> 36, P10), <strong>IPS</strong> would scale fmin from the low type Es layer<strong>and</strong> always include low type as the second Es type. If no other sporadic E layer is present the type only is recorded. No value is givenfor foEs or fbEs unless foEs is greater than foE.11<strong>INAG</strong> <strong>39</strong> May 19833. Inconsistency in figures showing the z-mode.There is an inconsistency between figures 1.4a, 1.5 <strong>and</strong> 1.6 in describing the z-mode in UAG-23A.Figures 1.4a to c correctly portray the relative positions of the x- o- <strong>and</strong> z- modes for a single reflecting layer. However, in figure1.5 <strong>and</strong> 1.6 there is a distinct turnup in the o-component near fzE. This is accentuated in UAG 23 for the same diagrams. In figure 1.6the end of the o- component clearly stops at fzE. Both these diagrams are in conflict with figure 1.4a where the o- component passescontinuously through fzEas expected.While these diagram are probably good generalisations of real ionogram, it seems unreasonable to show any turnup or to terminate the o-component in the special position it occupies in figure 1.6; at fzE.These diagrams were used by Rodger (<strong>INAG</strong> 34, P14) as partial justification for identifying traces on ionogram below the gyro-frequency asz-mode echoes. Unfortunately, the inconsistency between the figures has resulted in some doubts at <strong>IPS</strong> about Rodger's identifications.In the absence of absorption, both o- <strong>and</strong> z- modes could be present in all the examples discussed by Rodger. However, all theseexamples show only one obvious mode. Either the o-mode is not present, absorption being greater for the o-mode than the z-mode, or thecoupling process for the z-mode is not effective. It is not obvious that the two modes can be simply resolved on the basis of a singleionogram.In fact, all the examples quoted look like low type Es. In particular, the example from UAG 50, P79 carried the additional comment that theh'E would normally be expected to be 130 km whereas the trace at 0.5 MHz, identified as a z-trace, appears closer to 90 km.4. Scaling fmin.At <strong>IPS</strong> we always scale fmin as the lowest frequency at which echoes are observed on an ionogram thereby treating fmin primarily as anequipment parameter.As the 4B ionosonde has a low frequency limit of l.0MHz, <strong>and</strong> echoes would not normally be seen below l.6MHz due to broadcastinterference, the question of which magnetoionic mode is being scaled for fmin rarely arises. However, if the z-mode echo is obviously lowestfrequency observed, fmin would be scaled from it <strong>and</strong> described by z.When fmin is scaled from a low Es layer, the presence of a low type Es is always recorded. This means fmin can later be used for absorptionstudies, all values measured from low type sporadic E being treated separately.By regarding fmin first as an equipment parameter <strong>and</strong> second as an absorption parameter the problem of dealing with weak traces <strong>and</strong>different magneto-ionic components is eased. Any echo presence indicates the ionosonde is operating <strong>and</strong> should be used for scaling fmin.By appropriate use of Es types <strong>and</strong> use of descriptors for fmin (i.e. z) some of the integrity of fmin as an absorption index can also beretained for statistical studies.If fmin is to be used first as an absorption parameter then the points raised by Rodger in <strong>INAG</strong> 34 are most important. It would possiblybe preferable, in this case, for <strong>INAG</strong> to consider introducing a further parameter as an optional alternative to fmin.