INAG 39 P - IPS - Radio and Space Services
INAG 39 P - IPS - Radio and Space Services
INAG 39 P - IPS - Radio and Space Services
- No tags were found...

Create successful ePaper yourself
Turn your PDF publications into a flip-book with our unique Google optimized e-Paper software.
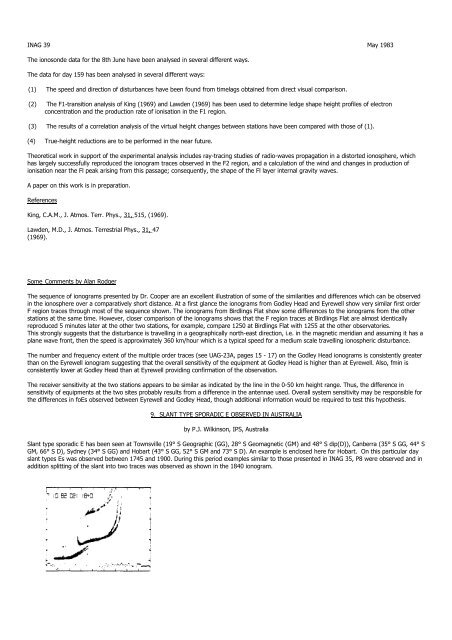
<strong>INAG</strong> <strong>39</strong> May 1983The ionosonde data for the 8th June have been analysed in several different ways.The data for day 159 has been analysed in several different ways:(1) The speed <strong>and</strong> direction of disturbances have been found from timelags obtained from direct visual comparison.(2) The F1-transition analysis of King (1969) <strong>and</strong> Lawden (1969) has been used to determine ledge shape height profiles of electronconcentration <strong>and</strong> the production rate of ionisation in the F1 region.(3) The results of a correlation analysis of the virtual height changes between stations have been compared with those of (1).(4) True-height reductions are to be performed in the near future.Theoretical work in support of the experimental analysis includes ray-tracing studies of radio-waves propagation in a distorted ionosphere, whichhas largely successfully reproduced the ionogram traces observed in the F2 region, <strong>and</strong> a calculation of the wind <strong>and</strong> changes in production ofionisation near the Fl peak arising from this passage; consequently, the shape of the Fl layer internal gravity waves.A paper on this work is in preparation.ReferencesKing, C.A.M., J. Atmos. Terr. Phys., 31, 515, (1969).Lawden, M.D., J. Atmos. Terrestrial Phys., 31, 47(1969).Some Comments by Alan RodgerThe sequence of ionograms presented by Dr. Cooper are an excellent illustration of some of the similarities <strong>and</strong> differences which can be observedin the ionosphere over a comparatively short distance. At a first glance the ionograms from Godley Head <strong>and</strong> Eyrewell show very similar first orderF region traces through most of the sequence shown. The ionograms from Birdlings Flat show some differences to the ionograms from the otherstations at the same time. However, closer comparison of the ionograms shows that the F region traces at Birdlings Flat are almost identicallyreproduced 5 minutes later at the other two stations, for example, compare 1250 at Birdlings Flat with 1255 at the other observatories.This strongly suggests that the disturbance is travelling in a geographically north-east direction, i.e. in the magnetic meridian <strong>and</strong> assuming it has aplane wave front, then the speed is approximately 360 km/hour which is a typical speed for a medium scale travelling ionospheric disturbance.The number <strong>and</strong> frequency extent of the multiple order traces (see UAG-23A, pages 15 - 17) on the Godley Head ionograms is consistently greaterthan on the Eyrewell ionogram suggesting that the overall sensitivity of the equipment at Godley Head is higher than at Eyrewell. Also, fmin isconsistently lower at Godley Head than at Eyrewell providing confirmation of the observation.The receiver sensitivity at the two stations appears to be similar as indicated by the line in the 0-50 km height range. Thus, the difference insensitivity of equipments at the two sites probably results from a difference in the antennae used. Overall system sensitivity may be responsible forthe differences in foEs observed between Eyrewell <strong>and</strong> Godley Head, though additional information would be required to test this hypothesis.9. SLANT TYPE SPORADIC E OBSERVED IN AUSTRALIAby P.J. Wilkinson, <strong>IPS</strong>, AustraliaSlant type sporadic E has been seen at Townsville (19° S Geographic (GG), 28° S Geomagnetic (GM) <strong>and</strong> 48° S dip(D)), Canberra (35° S GG, 44° SGM, 66° S D), Sydney (34° S GG) <strong>and</strong> Hobart (43° S GG, 52° S GM <strong>and</strong> 73° S D). An example is enclosed here for Hobart. On this particular dayslant types Es was observed between 1745 <strong>and</strong> 1900. During this period examples similar to those presented in <strong>INAG</strong> 35, P8 were observed <strong>and</strong> inaddition splitting of the slant into two traces was observed as shown in the 1840 ionogram.