Rapid Invasion of a Great Lakes Coastal Wetland by Non ... - BioOne
Rapid Invasion of a Great Lakes Coastal Wetland by Non ... - BioOne
Rapid Invasion of a Great Lakes Coastal Wetland by Non ... - BioOne

You also want an ePaper? Increase the reach of your titles
YUMPU automatically turns print PDFs into web optimized ePapers that Google loves.
J. <strong>Great</strong> <strong>Lakes</strong> Res. 33 (Special Issue 3):269–279Internat. Assoc. <strong>Great</strong> <strong>Lakes</strong> Res., 2007<strong>Rapid</strong> <strong>Invasion</strong> <strong>of</strong> a <strong>Great</strong> <strong>Lakes</strong> <strong>Coastal</strong> <strong>Wetland</strong> <strong>by</strong><strong>Non</strong>-native Phragmites australis and TyphaMirela G. Tulbure * , Carol A. Johnston, and Donald L. AugerDepartment <strong>of</strong> Biology and Microbiology, Box 2140DSouth Dakota State UniversityBrookings, South Dakota 57007ABSTRACT. <strong>Great</strong> <strong>Lakes</strong> coastal wetlands are subject to water level fluctuations that promote themaintenance <strong>of</strong> coastal wetlands. Point au Sauble, a Green Bay coastal wetland, was an open waterlagoon as <strong>of</strong> 1999, but became entirely vegetated as Lake Michigan experienced a prolonged period <strong>of</strong>below-average water levels. Repeat visits in 2001 and 2004 documented a dramatic change in emergentwetland vegetation communities. In 2001 non-native Phragmites and Typha were present but their coverwas sparse; in 2004 half <strong>of</strong> the transect was covered <strong>by</strong> a 3 m tall, invasive Phragmites and non-nativeTypha community. Percent similarity between plant species present in 2001 versus 2004 was approximately19% (Jaccard’s coefficient), indicating dramatic changes in species composition that took place inonly 3 years. The height <strong>of</strong> the dominant herbaceous plants and coverage <strong>by</strong> invasive species were significantlyhigher in 2004 than they were in 2001. However, floristic quality index and coefficient <strong>of</strong> conservatismwere greater in 2004 than 2001. Cover <strong>by</strong> plant litter did not differ between 2001 and 2004. Theprolonged period <strong>of</strong> below-average water levels between 1999 and early 2004 exposed unvegetatedlagoon bottoms as mud flats, which provided substrate for new plant colonization and created conditionsconducive to colonization <strong>by</strong> invasive taxa. PCR/RFLP analysis revealed that Phragmites from Point auSauble belongs to the more aggressive, introduced genotype. It displaces native vegetation and is tolerant<strong>of</strong> a wide range <strong>of</strong> water depth. Therefore it may disrupt the natural cycles <strong>of</strong> vegetation replacement thatoccur under native plant communities in healthy <strong>Great</strong> <strong>Lakes</strong> coastal wetlands.Phragmites australis, <strong>Great</strong> <strong>Lakes</strong> coastal wetlands, invasion, vegetation replace-INDEX WORDS:ment.INTRODUCTIONPhragmites australis (Cav.) Trin. ex Steud. (hereafterPhragmites) was historically infrequent inU.S. wetlands, but has expanded tremendously withthe introduction <strong>of</strong> Eurasian genotypes (Blossey2002). Phragmites is a cryptic invasive species(sensu Richardson et al. 2000) in the U.S., withboth native and non-native genotypes that differ intheir aggressiveness (Galatowitsch et al. 1999,Saltonstall 2002). Phragmites occurs throughout theentire U. S. and southern Canada in freshwater andbrackish to saline wetlands (Chambers et al. 1999),prevailing especially in tidal wetlands along the Atlanticcoast. However, recent expansion <strong>of</strong> Phragmitesoccurrence in the <strong>Great</strong> <strong>Lakes</strong> region has beenobserved (McNabb and Batterson 1991, Lynch andSaltonstall 2002, Wilcox et al. 2003). Phragmites is* Corresponding author. E-mail: Mirela.Tulbure@sdstate.educonsidered an indicator <strong>of</strong> wetland disturbance becauseit forms monospecific stands that displace nativespecies, reducing plant biodiversity and thehabitat available for associated fauna (Marks et al.1994, Chambers et al. 1999, Meyerson et al. 2000).Variations in climatic conditions (Minchinton2002), alteration <strong>of</strong> the hydrologic regime (Bart andHartman 2000, 2003), changes in land use (Lynchand Saltonstall 2002), and nutrient increase (Bertnesset al. 2002, Minchinton and Bertness 2003)may be responsible for Phragmites expansion.Saltonstall’s (2002) genetic study suggested that theinvasive haplotype M, introduced from Eurasia, isresponsible for the observed expansion. However,in areas where native and non-native populationsare sympatric, care should be taken to identify theorigins <strong>of</strong> populations subject to management. Thisis particularly important in the Midwest, where nativepopulations still thrive at many sites (Salton-269
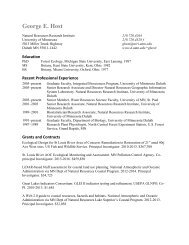
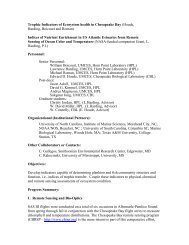
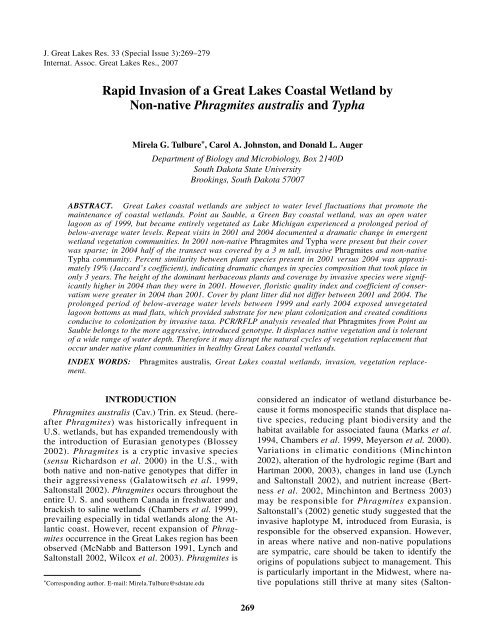
270 Tulbure et al.stall 2003). For example, Lynch and Saltonstall(2002) documented the expansion <strong>of</strong> the nativePhragmites genotype at a Lake Superior wetland.<strong>Coastal</strong> wetlands along Lake Michigan’s GreenBay are known to be dynamic, experiencing vastchanges in the extent <strong>of</strong> emergent vegetation aswater levels fluctuate over decadal cycles (Epsteinet al. 2002). Emergent plants germinate on lakebedexposed during low-water years, persist during averagewater level conditions, and decline after a series<strong>of</strong> high-water years, the marshes reverting toopen water (Harris et al. 1977, Bosley 1978). Typhais commonly mentioned as a key genus involved inthese vegetation cycles, but Phragmites is not.Data about plant species in wetlands <strong>of</strong> GreenBay on Lake Michigan were collected <strong>by</strong> the <strong>Great</strong><strong>Lakes</strong> Environmental Indicators project (GLEI)during mid-June 2001, when the water level <strong>of</strong>Lake Michigan was 54 cm below average (USCOE2006). During a repeat visit to wetlands <strong>of</strong> theGreen Bay area three years later, large stands <strong>of</strong>Phragmites were observed in the Point au Saublelagoon where little or no Phragmites had occurredin 2001. During the interim between the two sampledates, Lake Michigan experienced a prolonged period<strong>of</strong> below-average water levels.The goal <strong>of</strong> this paper is to document the rapidchange in wetland vegetation <strong>of</strong> a Green Bay lagoonover a 3-year period associated with the rapidinvasion <strong>of</strong> Phragmites. Specific objectives were tocompare vegetation structure and community compositionbefore and after Phragmites invasion, evaluateedaphic conditions within areas that were andwere not colonized <strong>by</strong> Phragmites, and determine ifthe expanding areas <strong>of</strong> Phragmites are <strong>of</strong> the invasivegenotype.METHODSStudy AreaThe 81 ha Point Au Sauble lagoon is located onthe eastern shore <strong>of</strong> Green Bay, 10 km northeast <strong>of</strong>the city <strong>of</strong> Green Bay in Brown County, Wisconsin.It is currently owned <strong>by</strong> the University <strong>of</strong> Wisconsin-GreenBay and has been preserved in a naturalstate <strong>by</strong> The Nature Conservancy and duck huntinggroups for many decades (UWGB C<strong>of</strong>rin Center forBiodiversity 2004). Point au Sauble is covered <strong>by</strong> avariety <strong>of</strong> plant communities such as floodplain forest,shrub-carr, sedge meadow, emergent aquatic,and <strong>Great</strong> <strong>Lakes</strong> beach, but the area sampled wasdescribed <strong>by</strong> earlier accounts as an open-water lagoon(Epstein et al. 2002). Although wetlands arecommon along the western shore <strong>of</strong> Green Bay,Point au Sauble is one <strong>of</strong> only a few coastal wetlandson the eastern shore <strong>of</strong> Green Bay.Abiotic Data CollectionThe soils at each plot were examined to a depth<strong>of</strong> 30 cm below the litter layer using a soil probe,and assigned to one <strong>of</strong> the following broad categories:organic, sand, silt, or clay. “Organic” soilswere those composed <strong>of</strong> organic soil material (peator muck) in a histic epipedon (Soil Survey Staff1999); undecomposed plant litter overlying the soilsurface was excluded when making this determination.Only the surface 30 cm was considered. Wedid not attempt to discern if soils in the organic categorywere true histosols. The texture <strong>of</strong> mineralsoils (i.e., sand, silt, clay) was determined <strong>by</strong> feelusing standard field methods (Soil Survey Staff1951). The hand texturing was done <strong>by</strong> co-authorJohnston, who is a pr<strong>of</strong>essional soil scientist certified<strong>by</strong> the American Society <strong>of</strong> Agronomy and experiencedat wetland soil characterization usingboth field and laboratory methods. Soil texture <strong>by</strong>plot in 2004 varied from silty to organic soils(Table 1).Lake level data recorded every 6 minutes atGreen Bay, Wisconsin (Station ID 9087079) wereobtained from the National Oceanic and AtmosphericAdministration (NOAA 2006), and were averagedover the time period from 0800 hours to1800 hours local standard time to determine averagewater levels on the days sampled. Monthly averageand monthly minimum lake levels, based ondata collected from 1918-2005, were obtained fromthe U.S. Army Corps <strong>of</strong> Engineers (USCOE 2006).Vegetation SamplingThe Point au Sauble lagoon was initially sampledon 19 Jun 01 as part <strong>of</strong> GLEI, a large, multi-investigatorproject designed to identify biotic indicators<strong>of</strong> human disturbance (Danz et al. 2005). The GLEIvegetation sampling protocol (Bourdaghs et al.2006, Johnston et al. 2007 this issue) was used inboth 2001 and 2004, when a repeat visit to the lagoonwas made on 7 Jul 04. A north-south trendingtransect was placed across the lagoon at Point auSauble, and 11 sampling locations (plots) were establishedat approximately 20 m intervals along thetransect (Fig. 1). At each sampling location, a 1 m 2plot was established and its geographic coordinates
Phragmites australis <strong>Invasion</strong> 271TABLE 1.plot.Point au Sauble wetland conditions <strong>by</strong>Water depthVariable/(cm)Substrate typePlot number 2001 2004 In 2004Plot 1 (at the North end<strong>of</strong> the peninsula) 10 26 SiltPlot 2 14 26 SiltPlot 3 15 27 SiltPlot 4 9 27 SiltPlot 5 8 20 SiltPlot 6 4 20 OrganicPlot 7 11 18 OrganicPlot 8 8 37 OrganicPlot 9 9 33 OrganicPlot 10 0 5 SandPlot 11 (at the South end<strong>of</strong> the peninsula) 0 0 Organicrecorded using a hand held Garmin GPSMAP 76unit (Garmin International Inc., Olathe, KS). Allvascular plant species observed within the plot wereidentified to the species or genus level; there wereno unidentified plants present. All GLEI projectfield crews met every summer and conducted fieldwork together to ensure that species identificationand the visual cover estimates were consistent betweenfield crews. The non-native cattail Typha angustifoliaand its hybrid Typha × glauca could notbe reliably distinguished because <strong>of</strong> the paucity <strong>of</strong>fruiting heads, and were combined into a singleclass called “invasive Typha.” Sagittaria latifoliaWilld. was identified as Sagittaria sp. <strong>by</strong> the GLEIfield crew in 2001, but because we found Sagittarialatifolia in 2004 at the same plots, we felt confidentto call Sagittaria latifolia the one identified in2001. Cover class was estimated visually for eachtaxon using modified Braun-Blanquet cover classranges: < 1%, 1 to < 5%, 5 to < 25%, 25 to < 50%,50 to < 75%, and 75 to 100% (ASTM 1997). Summedindividual taxa percent cover in a quadratcould exceed 100% because canopies <strong>of</strong> differentspecies overlap one another. Cover estimates werealso recorded for herbaceous litter, open water (definedas water open to the sun in patches 10 cm ×10 cm or greater), and standing water (defined asany water above the soil surface, including waterbelow thatch and green vegetation). Water depthand canopy height were recorded at each samplinglocation. The height <strong>of</strong> the dominant herbaceousplant was determined as the average height <strong>of</strong> thedominant herbaceous plant per plot, measured toFIG. 1. Aerial photo <strong>of</strong> the Point au Sauble peninsula (BrownCounty, Wisconsin) taken on 4 Oct 99. Circles indicate silty substrates,triangles and diamond indicate organic and sand substrates,respectively. Image courtesy <strong>of</strong> the U.S. Geological Survey.
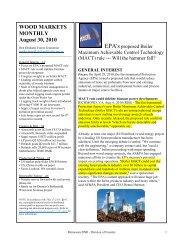
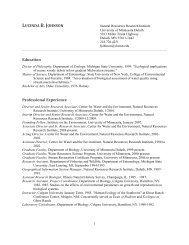
272 Tulbure et al.the nearest 5 cm. If a plant species could not beidentified in the field, it was collected, pressed, andidentified in the lab. Plant nomenclature conventionsin this study follow the Interagency TaxonomicInformation System (ITIS, http://www.itis.usda.gov), a national standardized plant nomenclaturesource. Prior to data analyses, cover classeswere converted to the midpoint percent cover <strong>of</strong>each class (e.g., 37.5% for the 50 to < 75% class).The average <strong>of</strong> midpoint percent cover was computedfor each plant species based on all plots in thetransect. Geographic coordinates <strong>of</strong> the initial 11sampling locations were uploaded into a GarminGPS unit, and used to return to the same locationson 7 Jul 04.Genetic Analysis <strong>of</strong> PhragmitesDNA was extracted from dried leaf tissues <strong>of</strong> oneramet (located in the center <strong>of</strong> the stand) <strong>of</strong> thePhragmites stand using Extract-N-Amp (Sigma-Aldrich, St. Louis, MO) according to manufacturer’sdirections. DNA from one ramet was judgedsufficient because all the Phragmites plants appearedto belong to the same clone, and shared morphologicalcharacteristics typical <strong>of</strong> the non-nativegenotype (Blossey 2002). Generally, in polyclonalreed stands, different clones are morphologicallydistinguishable (Koppitz 1999). Two non-codingchloroplast regions were amplified using the polymerasechain reaction (PCR). Amplification primerpairs used were trn and rbc (Saltonstall 2003). Two20 µL PCR reactions were made from each sample,generally according to the manufacturer’s directions.Instead <strong>of</strong> 4 µL <strong>of</strong> template, as recommended<strong>by</strong> the manufacturer, it was determined that betterresults were obtained using 1 µL <strong>of</strong> template. Thedifference was made up <strong>by</strong> adding 3 µL <strong>of</strong> a 1:1mixture <strong>of</strong> the Extract-N-Amp extraction and dilutionreagents. Either 50 ng each <strong>of</strong> forward and reversetrn primers or 12.5 ng each <strong>of</strong> rbc primerswere used.The two PCR products were subjected to restrictionenzyme digests to detect restriction fragmentslength polymorphisms (RFLP). Each PCR productwas divided into two 10 µL portions; one was subjectedto restriction digest and the other held as acontrol. From each plant, the rbc PCR product wasdigested using the restriction enzyme HhaI, whichcuts only the non-native genotype, and the trn PCRproduct was digested with RsaI, which cuts only thenative genotype (Saltonstall 2003). Restriction fragmentswere electrophoresed in 2% TAE gel and visualizedwith ethidium bromide using a ChemiDocXRS Imaging Station (BioRAD, Hercules, CA).Data AnalysisSpecies composition similarity was calculated for2001 and 2004 using Jaccard’s similarity index(Greig-Smith 1964). Mean coefficient <strong>of</strong> conservatism(a numerical score that ranges from 0 to 10,assigned to each plant species in a local flora that reflectsthe likelihood that a species is found in naturalhabitats) and floristic quality index (FQI) valueswere also compared in 2001 versus 2004. FQI iscomputed <strong>by</strong> multiplying the mean coefficient <strong>of</strong>conservatism <strong>of</strong> the species in a community (C – ) <strong>by</strong>the square root <strong>of</strong> the total number <strong>of</strong> native species:FQI = C – * √N, C-values used were those assigned forthe state <strong>of</strong> Wisconsin (Bernthal 2003).Species diversity and evenness were compared in2001 versus 2004. We used Shannon-Weinerspecies diversity index:S∑H′ =− p ln pi−1and Pielou’s J index for evenness: H´ / lnS, where:S is species richness and p i is the relative abundance<strong>of</strong> the ith species (Magurran 1988).Water depth and height <strong>of</strong> the dominant herbaceousplant in 2001 versus 2004 were comparedusing t-tests. Kruskal-Wallis nonparametric testswere used to compare the coverage <strong>by</strong> open water(defined as water open to the sun in patches 10 cm× 10 cm or greater), coverage <strong>by</strong> herbaceous litter,coverage <strong>by</strong> invasive species, and mean Phragmitescover per plot in 2001 versus 2004 (none <strong>of</strong> thedata sets were normally distributed). A one-wayANOVA followed <strong>by</strong> Tukey’s HSD comparison testwas used to compare 2004 Phragmites cover onthree different types <strong>of</strong> soil (i.e., silt, organic, andsand). Simple regression was used to test if therewas an effect <strong>of</strong> 2004 water depth on Phragmitescover. All tests were conducted at an alpha level <strong>of</strong>0.05 using the SAS ® 9.1 (SAS Institute 2001).RESULTSDigital orthophotography acquired on 10 Apr 99,when the lake level was 176.3 m (18 cm below average),showed an open water lagoon at Point auSauble (Fig. 1). The lake level dropped precipitouslylater in 1999, and was 27 to 54 cm below averagethroughout Jan 00 to Apr 04 (Fig. 2). Thelake level during the first field data collection on 16ii
Phragmites australis <strong>Invasion</strong> 273Jun 01 was 176.1 m, ~0.5 m below average. Lakelevel had rebounded to 176.5 m <strong>by</strong> the second fielddata collection date on 9 Jul 04 (Table 2).During initial vegetation sampling on 19 Jun 01,all 11 sample plots contained emergent wetlandvegetation. By 7 Jul 04 the water levels had reboundedto 176.5 m, mean water depth per plot wassignificantly greater, and mean coverage <strong>of</strong> openwater patches was lower. Despite the deeper water,all sample plots remained vegetated (Table 2).As <strong>of</strong> 2001, Sagittaria latifolia Willd. (arrowhead)was the predominant plant (Table 3). Sagittariaoccurred on both silty and sandy substrates.Two annual species, Bidens cernua L. (noddingbeggartick) and Impatiens capensis Meerb. (jewelweed)were also abundant. Bidens occurred towardsthe north edge <strong>of</strong> the transect, on silty substrates,with standing water as deep as 9 cm, while Impatiensgrew mainly on sandy substrates. Schoenoplectustabernaemontani (Torr.) M.T. Strong(s<strong>of</strong>tstem bulrush) was the fourth most abundantspecies with an average cover <strong>of</strong> 10.2%. InvasiveTypha was present but sparse (2.7% cover). It occurredin plots with sandy substrate, without standingwater. A few stems <strong>of</strong> Phragmites (cover class<strong>of</strong> 1 to 5%) were present in only a single plot.In 2004, the wetland was dominated <strong>by</strong> invasiveTypha and Phragmites (Table 2). Phragmites waspresent in four plots with a cover <strong>of</strong> 100%. Thesefour plots were located towards the north edge <strong>of</strong>the transect and the substrate was silty. Phragmiteswas also present with lower cover in two other plotswith silty (3% cover) and sandy substrate (37.5%cover). Invasive Typha was present in six plots,with a cover ranging from 60 to 100%. InvasiveTypha did not occur in the plots where Phragmitesoccurred except for the plot where Phragmites hadlow cover <strong>of</strong> 3%, and Typha generally grew on organicsoil substrates (five out <strong>of</strong> the six plots werecovered <strong>by</strong> organic substrate). Ricciocarpus natans,a free-floating liverwort, covered the water surfacebeneath the Phragmites, although it had not beenobserved in 2001. The species with the secondgreatest plant cover in 2001, Bidens cernua, wascompletely absent in 2004. Several other speciesFIG. 2. Monthly mean water levels (MWL) at Green Bay, Lake Michigan, WI from 1999to 2004 (USCOE 2006). Arrows denote dates <strong>of</strong> aerial photo acquisition and field sampling.
274 Tulbure et al.TABLE 2.P ≤ 0.05)Comparison <strong>of</strong> Point au Sauble wetland conditions between 2001 and 2004. (** significant atValue in Value in P- Degrees <strong>of</strong>Variable 2001 2004 value Statistics freedomSpecies richness 15 29 — — —Mean water depth (cm) 8 22 0.0003 ** t = 5.5 1, 10Mean canopy height (cm) 112 234 0.0002 * t = 5.7 1, 10Mean coverage <strong>by</strong> herbaceous litter (%) 79 81 0.9611 χ 2 < 0.1 1Mean coverage <strong>by</strong> open water (%) 16 8 0.0413 * χ 2 = 4.2 1Mean coverage <strong>by</strong> invasive species per plot (%) 3 84
Phragmites australis <strong>Invasion</strong> 275TABLE 3. Species present at Point au Sauble wetland in 2001 and 2004 and their C-values(Bernthal 2003).Scientific name C-value Cover in 2001 Cover in 2004Bidens cernua L. 4 23.9 —Calamagrostis canadensis (Michx.) Beauv. 5 — 1.4Carex bebbii Olney ex Fern. 4 — < 0.1Carex hystericina Muhl. ex Willd. 3 — < 0.1Carex lacustris Willd. 6 — < 0.1Cirsium arvense (L.) Scop. * — 0.3Calystegia sepium ssp. sepium (L.) R. Br 2 — < 0.1Cynoglossum <strong>of</strong>ficinale L. * — 3.4Eleocharis erythropoda Steud. 3 0.2 < 0.1Epilobium ciliatum Raf. 3 0.2 —Eupatorium perfoliatum L. 6 < 0.1 < 0.1Impatiens capensis Meerb. 2 13.7 1.4Juncus balticus Willd. 5 — < 0.1Leersia oryzoides (L.) Sw. 3 0.3 0.3Lemna minor L. 4 4.8 —Lycopus americanus Muhl. ex W. Bart 4 — < 0.1Lysimachia thyrsiflora L. 7 — 4.8Lythrum salicaria L. * < 0.1 —Phalaris arundinacea L. * 0.3 1.4Phragmites australis (Cav.) Trin. ex Steud. * 0.3 35.5Ranunculus sp. 1.6 —Ricciocarpus natans L. — 16.0Sagittaria latifolia Willd. 3 24.5 4.6Schoenoplectus fluviatilis (Torr.) M.T. Strong 6 — 1.4Schoenoplectus tabernaemontani (K.C. Gmel.) Palla 4 10.2 1.7Solanum dulcamara L. * — < 0.1Sparganium eurycarpum Engelm. ex Gray 5 — < 0.1Taraxacum <strong>of</strong>ficinale G.H. Weber ex Wiggers * — < 0.1Typha latifolia L. 1 0.8 —Invasive Typha * 2.7 45.7Urtica dioica L. 1 — 3.4Verbena hastata L. 3 — 1.4Veronica anagallis-aquatica L. 4 — < 0.1* indicates an introduced species that was not assigned a C-value; species identified at genus level werenot assigned any C-values.sponse <strong>of</strong> wetland plant species to a three-year(1996-1998) water level change in coastal LakeHuron wetlands. In their study, stem density, perplotspecies richness, and Shannon diversity in thewet meadow and transition zones decreased aswater depth increased from 1996 to 1997. An increasein these same measures was noted in 1998with the decrease in water level (Gathman et al.2005).Periods <strong>of</strong> extremely low water expose unvegetatedlagoon bottoms as mud flats, providing a substratefor new plant colonization. Annuals and otheropportunistic species such as Schoenoplectus tabernamontanirapidly increase in abundance, and aretypically replaced <strong>by</strong> cattail as the plant communitymatures (Harris et al. 1977, Bosley 1978). From1997 to 2001, the water level dropped 1.25 m inLake Michigan, the largest drop since data recordswere kept (NOAA 2003).Some <strong>of</strong> the observed species changes at Point auSauble were predictable outcomes <strong>of</strong> succession asplants colonized the exposed lagoon bottom. Theannual species Bidens cernua and Impatiens capensisdo not grow vigorously and are usually found onexposed sandy or muddy shores (Chadde 1998).Their loss was expected as the site evolved from anewly established community dominated <strong>by</strong> annualsto a more mature community dominated <strong>by</strong>
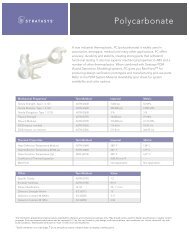
276 Tulbure et al.FIG. 3. PCR/RFLP analysis <strong>of</strong> non-nativePhragmites population from Point au Sauble wetland.Lanes 1 and 2 contain the rbc primer withthe HhaI digested DNA and undigested DNA,respectively. Lanes 3 and 4 contain the trn primerwith the RsaI digested DNA and undigested DNA,respectively. Lane 5 contains a 100 bp ladder(Promega, Madison, WI). The rbc productdigested and the trn product did not, indicatingthe source DNA was from the invasive genotype.perennials. The decreased cover <strong>of</strong> Schoenoplectustabernaemontani and Sagittaria latifolia was presumablydue to shading <strong>by</strong> taller successionalplants.Prior authors have identified the dynamic nature<strong>of</strong> Point au Sauble and other Green Bay wetlands inresponse to such water level fluctuations (Epstein etal. 2002, UWGB 2004). The difference between ourobserved changes at Point au Sauble and previousreports, which point out the dominance <strong>of</strong> Typhaspp. as the water level increases (UWGB 2004), isthe dominance <strong>of</strong> Phragmites. The fact that Phragmitesexpanded so rapidly in only 3 years is a cause<strong>of</strong> concern. Moreover, Phragmites from Point auSauble was found to belong to the more aggressive,introduced genotype. Therefore it may disrupt thenatural cycles <strong>of</strong> vegetation replacement that occurunder native plant communities in healthy coastalwetlands.Although there was an increase in species richnessbetween 2001 and 2004, we believe that this istransient based on our data collected at this site. Weexpect to see a decrease in species richness in plotswith the continued expansion and densification <strong>of</strong>Phragmites, similar to what we have seen at thefour plots where Phragmites had a 100% cover.Phragmites is an invasive taxon (sensu Richardsonet al. 2000) that is a clonal dominant (sensuBoutin and Keddy 1993). Under the predictions <strong>of</strong>the hump-backed model (Grime 2000, Moore andKeddy 1989), the large standing crop <strong>of</strong> this clonaldominant species would be expected to reducespecies richness because the greatest species richnessis usually reached at moderate standing crops.Phragmites forms monospecific stands with a consequentreduction in species diversity (Marks et al.1994). Such a reduction did occur in the four plotswhere Phragmites had a 100% cover in 2004,species richness being significantly lower in thesefour plots than in the plots where Phragmites wasnot present or had a low cover.“Mean coverage <strong>by</strong> invasive species” was an indicatorthat suggested a degradation <strong>of</strong> the lagoon.Species richness and other metrics commonly usedas wetland indicators (i.e., FQI and mean coefficient<strong>of</strong> conservatism) did not point out a degradation<strong>of</strong> this wetland. However, greater values <strong>of</strong> allthese three metrics are expected as the site evolvedfrom a newly established community dominated <strong>by</strong>annuals to a more mature community dominated <strong>by</strong>perennials. The greater height <strong>of</strong> the dominantherbaceous plants in 2004 can be explained <strong>by</strong> thedominance <strong>of</strong> Phragmites or Typha in almost all <strong>of</strong>the plots. These are invasive species in the U.S. andgrow taller than native species (Galatowitsch et al.1999). Plant size larger than that <strong>of</strong> associatespecies is a key trait that allows plant species todominate, such that tall stature is a characteristic <strong>of</strong>competitive species (Grime 1973, Grime 2000).Monoculture is achieved <strong>by</strong> larger species throughtheir ability to compete for light (tall shoots), forwater and nutrients (high below ground biomass),and through the presence <strong>of</strong> a high density <strong>of</strong> herbaceouslitter throughout the year (Grime 2000). BothTypha and Phragmites form mono-dominant stands,and both are well adapted to sustained inundation(Haslam 1971, Shay and Shay 1986). These fea-
Phragmites australis <strong>Invasion</strong> 277tures promote Phragmites as a good competitor inthe stands where it occurs (Haslam 1971).While predicting invasion <strong>of</strong> a community is difficultbecause there is no unique theory to successfullyexplain plant invasions (Williamson 1999,Grime 2000, Zedler and Kercher 2004), fluctuation<strong>of</strong> resource availability may be one <strong>of</strong> the key factorsthat control invasibility (Davis et al. 2000).New substrate availability makes an area susceptibleto invasion (Grime 2000) and is one <strong>of</strong> the factorsthat make riparian areas more prone to invasion(Tickner et al. 2001).Establishment <strong>of</strong> Phragmites typically occurs onbare, unvegetated moist soils after water levels recede(Chambers et al. 1999, Galatowitsch et al.1999, Ailstock et al. 2001, Pengra et al. 2007). Thisspecies typically invades starting from the uplandfringe <strong>of</strong> the wetland via stolons and rhizomes. Alternatively,it may start on a high point within thewetland, such as a dike remnant, and then spreadinto the wetland plain. Unlike rhizomes, stolons arelocated aboveground and usually elongate morerapidly than rhizomes. Phragmites propagation <strong>by</strong>seeds is limited (Haslam 1970, 1971). Vegetativepropagation is efficient through rhizome portionstransported <strong>by</strong> water, man, or stolons from near<strong>by</strong>colonies (Haslam 1971). We observed long Phragmitesstolons on beach areas north <strong>of</strong> the lagoon,and believe that stolon growth was the primarymechanism <strong>of</strong> Phragmites expansion within the lagoon.The rapid invasion <strong>of</strong> Point au Sauble <strong>by</strong> Phragmitescannot and should not be considered representative<strong>of</strong> all <strong>Great</strong> <strong>Lakes</strong> coastal wetlands.Although the extremely low water levels between1999 and early 2004 occurred throughout lakesMichigan and Huron, Phragmites stands observedelsewhere in Green Bay <strong>by</strong> co-author Tulbure as a2004 field assistant to Pengra (2005) were muchless extensive than those found at Point au Sable. Inthat study, Pengra and co-workers visited 82 GreenBay wetland locations with emergent vegetationand found that 34 <strong>of</strong> them had Phragmites presentin 2004. We believe that this could be because theAu Sauble wetland is a lagoon protected in the interior<strong>of</strong> a hook-shaped peninsula, whereas other sitesare sandy peninsulas and associated embaymentsthat are more open to wave action (e.g., Little TailPoint, and Long Tail Point, Wisconsin DNR 2006).Also, other sites had organic substrates (e.g., SensibaWildlife Area) rather than silty substrate asPoint au Sauble, which might have been less proneto Phragmites invasion. We believe that the exposure<strong>of</strong> unvegetated silty mineral soils at Point auSauble, which suggests the presence <strong>of</strong> a depositionalenvironment, created conditions conducive toPhragmites colonization and may be atypical forthe region. Based on these results, we predict thatsites with exposed mineral soils are most susceptibleto Phragmites invasion, and future studiesshould further test this hypothesis.The GLEI project was designed to be conductedas single-sampling event, not an analysis <strong>of</strong> changeover time. However, these results illustrate the benefits<strong>of</strong> the sampling and documentation protocolestablished <strong>by</strong> GLEI. Without the careful recordskept <strong>by</strong> the GLEI sampling crew in 2001, documentation<strong>of</strong> this rapid Phragmites expansion would nothave been possible.ACKNOWLEDGMENTSWe thank Dr. Elizabeth Lynch and an anonymousreviewer for helpful comments on an earlier draft.This research has been supported <strong>by</strong> a grant fromthe U.S. EPA’s Science to Achieve Results Estuarineand <strong>Great</strong> <strong>Lakes</strong> program through funding to the<strong>Great</strong> <strong>Lakes</strong> Environmental Indicators project, U.S.EPA Agreement EPA/R-828675. Although the researchdescribed in this article has been fundedwholly <strong>by</strong> the U.S. EPA, it has not been subjectedto the agency’s required peer and policy review andtherefore does not necessarily reflect the views <strong>of</strong>the agency and no <strong>of</strong>ficial endorsement should beinferred.REFERENCESAilstock, M.S., Norman, C.M., and Bushmann. P.J.2001. Common Reed, Phragmites australis: controland effects upon biodiversity in freshwater nontidalwetlands. Resour. Ecol. 9(1):49–59.ASTM (American Society for Testing and Materials).1997. ASTM E 1923, Standard Guide forSampling Terrestrial and <strong>Wetland</strong>s Vegetation. ASTMInternational, West Conshohocken, PA, USA.Bart, D., and Hartman, J.M. 2000. Environmental determinants<strong>of</strong> Phragmites australis expansion in a NewJersey salt marsh: an experimental approach. Oikos89:59–69.———, and Hartman, J.M. 2003. The role <strong>of</strong> large rhizomedispersals and low salinity windows in theestablishment <strong>of</strong> common reed, Phragmites australis,in salt marshes: new links to human activities. Estuaries26(2B):436–443.Bernthal, T.W. 2003. Development <strong>of</strong> a floristic qualityassessment methodology for Wisconsin. Final reportto the U.S. Environmental Protection Agency. Region
278 Tulbure et al.V [Online]. Available http://www.dnr.state.wi.us/org/es/science/publications/SS_986_2003.pdf. 25 Apr 05.Bertness, M.D., Ewanchuk, P.J., and Silliman, B.R.2002. Anthropogenic modification <strong>of</strong> New Englandsalt marshes. PNAS 99 (3):1395–1398.Blossey, B. 2002. Ecology and management <strong>of</strong> invasiveplants program. Phragmites: common reed. Morphologicaldifferences between native and introducedgenotypes. Diagnostic Service. [Online]. Availablehttp://www.invasiveplants.net. 25 Mar 05.Bosley T.R. 1978. Loss <strong>of</strong> wetlands on the west shore <strong>of</strong>Green Bay. T. Wisc. Acad. Sci. Art. Lett. 66:235–245.Bourdaghs, M., Johnston, C.A., and Regal, R.R. 2006.Properties and performance <strong>of</strong> the floristic qualityindex in <strong>Great</strong> <strong>Lakes</strong> coastal wetlands. <strong>Wetland</strong>s26:718–735.Boutin, C., and Keddy. P.A. 1993. A functional classification<strong>of</strong> wetland plants. J. Veg. Sci. 4:591–600.Chadde, S.W. 1998. A <strong>Great</strong> <strong>Lakes</strong> wetland flora: acomplete, illustrated guide to the aquatic and wetlandplants <strong>of</strong> the Upper Midwest. Calumet, Michigan:Pocketflora Press.Chambers R.M., Meyerson, L.A., and Saltonstall,K.1999. Expansion <strong>of</strong> Phragmites australis into tidalwetlands <strong>of</strong> North America. Aquat. Bot. 64:261–273.Danz, N.P., Regal, R.R., Niemi, G.J., Brady, V.J. Hollenhorst,T., Johnson, L.B., Host, G.E., Hanowski,J.M., Johnston, C.A., Brown, T., Kingston, J., andKelly, J.R. 2005. Environmentally stratified samplingdesign for the development <strong>of</strong> <strong>Great</strong> <strong>Lakes</strong> environmentalindicators. Environ. Monit. Assess. 102:41–65.Davis, M.A., Grime, J.P. and Thompson, K. 2000. Fluctuatingresources in plant communities: a general theory<strong>of</strong> invasibility. Ecology 88:528–534.Epstein, E.J., Spencer, E., and Feldkirchner, D. 2002. Adata compilation and assessment <strong>of</strong> coastal wetlands<strong>of</strong> Wisconsin’s <strong>Great</strong> <strong>Lakes</strong>, final report. Natural HeritageProgram, Bureau <strong>of</strong> Endangered Resources,Wisconsin Department <strong>of</strong> Natural Resources, Madison,WI, USA. PUBL ER-803 2002.Galatowitsch, S.M., Anderson, N.O., and Ascher, P.D.1999. Invasiveness in wetland plants in temperateNorth America. <strong>Wetland</strong>s 19:733–755.Gathman, J.P., Albert, D.A., and Burton, T.M. 2005.<strong>Rapid</strong> plant community response to water level peakin northern Lake Huron coastal wetlands. J. <strong>Great</strong><strong>Lakes</strong> Res. 31:160–170.Greig-Smith, P. 1964. Quantitative plant ecology, secondedition. London, United Kingdom: Butterworths.Grime, J.P. 1973. Competitive exclusion in herbaceousvegetation. Nature 242:344–347.——— . 2000. Plant strategies, vegetation processes andecosystem properties, second edition. Chichester,United Kingdom: John Wiley & Sons Ltd.Harris, H.J., Bosley, T.R., and Rosnik. F.D. 1977. GreenBay’s coastal wetlands: a picture <strong>of</strong> dynamic change.In Proc. Waubesa conf. wetlands, pp. 337–358. Institute<strong>of</strong> Environmental Studies, University <strong>of</strong> Wisconsin,Madison.Haslam, S.M. 1970. The performance <strong>of</strong> Phragmitescommunis Trin. in relation to water supply. Ann. Bot.34:867–877.——— . 1971. Biological flora <strong>of</strong> the British Isles: Phragmitescommunis Trin. Ecology 59:585–610.Johnston, C.A., Bedford, B.L., Bourdaghs, M., Brown,T., Frieswyk, C., Tulbure, M., Vaccaro, M., andZedler, J.B. 2007. Plant species indicators <strong>of</strong> physicalenvironment in <strong>Great</strong> <strong>Lakes</strong> coastal wetlands. J. <strong>Great</strong><strong>Lakes</strong> Res. 33 (Special Issue 3):106–124.Keddy, P.A., and Reznicek, A.A. 1986. <strong>Great</strong> <strong>Lakes</strong> vegetationdynamics: the role <strong>of</strong> fluctuating water levelsand buried seeds. J. <strong>Great</strong> <strong>Lakes</strong> Res. 12:25–36.Koppitz, H. 1999. Analysis <strong>of</strong> genetic diversity amongselected populations <strong>of</strong> Phragmites australis worldwide.Aquat. Bot. 64:209–221.Lynch, E.A., and Saltonstall, K. 2002. Paleoecologicaland genetic analyses provide evidence for recent colonization<strong>of</strong> native Phragmites australis populations ina Lake Superior wetland. <strong>Wetland</strong>s 22:637–646.Magurran, A.E. 1988. Ecological diversity and its measurement.Princeton, New Jersey: Princeton UniversityPress.Marks, M., Lapin, B., and Randall, J. 1994. Phragmitesaustralis (Phragmites communis): threats, managementand monitoring. Nat. Areas J. 14:285–294.McNabb, C.D., and Batterson, T.R. 1991. Occurrence <strong>of</strong>the common reed, Phragmites australis, along roadsidesin Lower Michigan. Mich. Academician23:211–220.Meyerson, L.A., Saltonstall, K., Windham, L., Kiviat, E.,and Findlay, S. 2000. A comparison <strong>of</strong> Phragmitesaustralis in freshwater and brackish marsh environmentsin North America. Wetl. Ecol. Manage.9:89–103.Minchinton, T.E. 2002. Precipitation during El Nino correlateswith increasing spread <strong>of</strong> Phragmites australisin New England, USA, coastal marshes. Mar. Ecol.-Prog. Ser. 242:305–309.——— , and Bertness, M.D. 2003. Disturbance-mediatedcompetition and the spread <strong>of</strong> Phragmites australis ina coastal marsh. Ecol. Appl. 13(5):1400–1416.Moore, D.R.J., and Keddy. P.A. 1989. The relationshipbetween species richness and standing crop in wetlands:the importance <strong>of</strong> scale. Vegetatio 79:99–106.National Oceanic and Atmospheric Administration. 2003.[Online]. Available http://www.publicaffairs.noaa.gov/releases2003/jul03/noaa03r507.html. 12 Jun 06.——— . 2006. Historic <strong>Great</strong> <strong>Lakes</strong> levels. [Online].Available http://tidesandcurrents.noaa.gov/ 14 Jun 06.Pengra, B.W. 2005. Remote sensing <strong>of</strong> Phragmites australiswith the EO-1 HyperionSensor. M.Sc. thesis,South Dakota State University, Brookings, SouthDakota.
Phragmites australis <strong>Invasion</strong> 279——— , Johnston, C.A., and Loveland, T.R. 2007. Mappingan invasive plant, Phragmites australis, incoastal wetlands using the EO-1 Hyperion hyperspectralsensor. Rem. Sensing Environ. DOI:10.1016/j.rse.2006.11.002.Richardson, D.M., Pysek, P., Rejmanek, M., Barbour,M.G., Panetta, F.D., and West, C.J. 2000. Naturalizationand invasion <strong>of</strong> alien plants: concepts and definitions.Divers. Distributions 6:93–107.Saltonstall, K. 2002. Cryptic invasion <strong>by</strong> a non-nativegenotype <strong>of</strong> the common reed, Phragmites australis,into North America. In Proc. Natl. Academy Sci.,U.S.A. 99:2445–2449.——— . 2003. Genetic variation among North Americanpopulations <strong>of</strong> Phragmites australis: implications formanagement. Estuaries 26(2B):444–451.SAS 2001. Cary, North Carolina: SAS Institute Inc.Shay, J.M., and Shay, C.T. 1986. Prairie marshes inwestern Canada, with specific reference to the ecology<strong>of</strong> five emergent macrophytes. Ca. J. Botany64:443–454.Soil Survey Staff. 1951. Soil Survey Manual. AgriculturalHandbook 18. United States Department <strong>of</strong> Agriculture.Soil Conservation Service. Washington D.C.,U.S.A.———. 1999. Soil Taxonomy. 2nd edition. AgriculturalHandbook 436, United States Department <strong>of</strong> Agriculture.Washington D.C., U.S.A.Tickner, D.P., Angold, P.G., Gurnell, A.M., and Mountford,J.O. 2001. Riparian plant invasions: hydrogeomorphologicalcontrol and ecological impacts. Prog.Phys. Geog. 25:22–52.United States Army Corps <strong>of</strong> Engineers (USCOE). 2006.[Online]. Historic <strong>Great</strong> <strong>Lakes</strong> levels. Available http://www.lre.usace.army.mil/greatlakes/hh/greatlakeswaterlevels/historicdata. 29 May 07.University <strong>of</strong> Wisconsin-Green Bay C<strong>of</strong>rin Center forBiodiversity. 2004. [Online]. Available http://www.uwgb.edu/biodiversity/ptsauble. 5 Apr 05.Wilcox, D.A. 2004. Implications <strong>of</strong> hydrologic variabilityon the succession <strong>of</strong> plants in <strong>Great</strong> <strong>Lakes</strong> wetlands.Aquat. Ecosys. Health Manage. 7(2):223–231.Wilcox, K.L., Petrie, S.A., Maynard, L.A., and Meyer,S.W. 2003. Historical distribution and abundance <strong>of</strong>Phragmites australis at Long Point, Lake Erie,Ontario. J. <strong>Great</strong> <strong>Lakes</strong> Res. 29(4):664–680.Williamson, M.H. 1999. <strong>Invasion</strong>. Ecography 22:5–12.Wisconsin Department <strong>of</strong> Natural Resources 2006.[Online]. Available http://dnr.wi.gov/org/land/er/publications/cw/NLMich. 30 Jan 07.Zedler, J.B., and Kercher, S. 2004. Causes and consequences<strong>of</strong> invasive plants in wetlands: opportunities,opportunists, and outcomes. Cr. Rev. Plant Sci.23(5):431–452.Submitted: 1 August 2006Accepted: 17 July 2007Editorial handling: Gerald J. Niemi