Some Estimates of Moose Populations in British Columbia During ...
Some Estimates of Moose Populations in British Columbia During ...
Some Estimates of Moose Populations in British Columbia During ...

You also want an ePaper? Increase the reach of your titles
YUMPU automatically turns print PDFs into web optimized ePapers that Google loves.
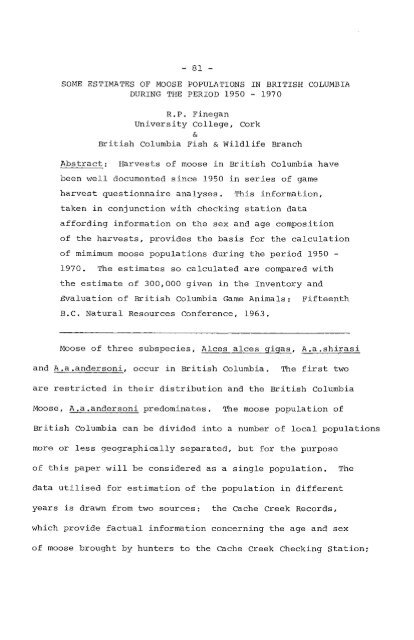
- 81 -<br />
SOME ESTIMATES OF MOOSE POPULATIONS IN BRITISH COLUMBIA<br />
DURING THE PERIOD 1950 - 1970<br />
Abstract:<br />
R.P. F<strong>in</strong>egan<br />
University College, Cork<br />
&<br />
<strong>British</strong> <strong>Columbia</strong> Fish & wildlife Branch<br />
Harvests <strong>of</strong> moose <strong>in</strong> <strong>British</strong> <strong>Columbia</strong> have<br />
been well documented s<strong>in</strong>ce 1950 <strong>in</strong> series <strong>of</strong> game<br />
harvest questionnaire analyses.<br />
This <strong>in</strong>formation,<br />
taken <strong>in</strong> conjunction with check<strong>in</strong>g station data<br />
afford<strong>in</strong>g <strong>in</strong>formation on the sex and age composition<br />
<strong>of</strong> the harvests, provides the basis for the calculation<br />
<strong>of</strong> mimimum moose populations dur<strong>in</strong>g the period 1950 -<br />
1970. The estimates so calculated are compared with<br />
the estimate <strong>of</strong> 300,000 given <strong>in</strong> the Inventory and<br />
Evaluation <strong>of</strong> <strong>British</strong> columbia Game Animals:<br />
B.C. Natural Resources Conference, 1963.<br />
Fifteenth<br />
<strong>Moose</strong> <strong>of</strong> three subspecies, Alces alces gigas, A.a.shirasi<br />
and A.a.andersoni, occur <strong>in</strong> <strong>British</strong> <strong>Columbia</strong>.<br />
The first two<br />
are restricted <strong>in</strong> their distribution and the <strong>British</strong> columbia<br />
<strong>Moose</strong>, A.a.andersoni predom<strong>in</strong>ates.<br />
The moose population <strong>of</strong><br />
<strong>British</strong> columbia can be divided <strong>in</strong>to a number <strong>of</strong> local populations<br />
more or less geographically separated, but for the purpose<br />
<strong>of</strong> this paper will be considered as a s<strong>in</strong>gle population.<br />
The<br />
data utilised for estimation <strong>of</strong> the population <strong>in</strong> different<br />
years is drawn from two sources:<br />
the Cache Creek Records,<br />
which provide factual <strong>in</strong>formation concern<strong>in</strong>g the age and sex<br />
<strong>of</strong> moose brought by hunters to the cache Creek Check<strong>in</strong>g station;
- 82 -<br />
and the Game Harvest Questionnaire Analysis, or Hunter sample,<br />
which provides <strong>in</strong>formation obta<strong>in</strong>ed from hunters through the<br />
use <strong>of</strong> mailed questionnaires.<br />
The reliability <strong>of</strong> the <strong>in</strong>formation<br />
so obta<strong>in</strong>ed has been critically exam<strong>in</strong>ed on a number <strong>of</strong> occasions<br />
(Sugden 1950, Lark<strong>in</strong> 1953, Taylor 1958, Mccaughran 1963,<br />
F<strong>in</strong>egan 1966) and can be regarded as satisfactory.<br />
A previous estimate <strong>of</strong> the moose population has been given<br />
as 300,000 (Rob<strong>in</strong>son 1963) and the op<strong>in</strong>ion was expressed that<br />
"A knowledge <strong>of</strong> the average annual harvest provides a valid<br />
basis for comput<strong>in</strong>g total population".<br />
considerable data has<br />
been collected s<strong>in</strong>ce then and it has become possible to calculate<br />
moose populations a little more closely.<br />
The figures provided<br />
here are crude and generally represent m<strong>in</strong>imum estimates, but<br />
the data is capable <strong>of</strong> ref<strong>in</strong>ement and the types <strong>of</strong> calculation<br />
used can be applied equally well to local populations with<strong>in</strong><br />
the general population.<br />
METHODS<br />
Three methods have been used to calculate m<strong>in</strong>imum population<br />
sizes dur<strong>in</strong>g the period 1950 to 1970:<br />
1. In the period 1950 - 1957 hunters were asked to report<br />
the numbers <strong>of</strong> moose they had seen dur<strong>in</strong>g their hunt.<br />
The ratio <strong>of</strong> Number Seen:Number Shot is, therefore,<br />
known, and by mak<strong>in</strong>g the assumption that all animals <strong>in</strong><br />
the population were seen once this can be applied to
- 83 -<br />
the harvest estimate to produce a population estimate.<br />
The possibility <strong>of</strong> bias due to overlap <strong>in</strong> observation,<br />
when there can be no overlap <strong>in</strong> the record <strong>of</strong> numbers<br />
shot, is reduced by the relatively low sampl<strong>in</strong>g levels<br />
employed dur<strong>in</strong>g this period (1 hunter <strong>in</strong> 15 to 1 hunter<br />
<strong>in</strong> 10), and by the large amount <strong>of</strong> territory available<br />
for moose hunt<strong>in</strong>g, giv<strong>in</strong>g low hunter density.<br />
2. Animals harvested <strong>in</strong> an age class <strong>of</strong> yearl<strong>in</strong>gs or over<br />
must have been alive <strong>in</strong> the previous year.<br />
For a given<br />
year the sum <strong>of</strong> harvests <strong>of</strong> successivelY older animals<br />
<strong>in</strong> the follow<strong>in</strong>g years provides the m<strong>in</strong>imum number alive<br />
<strong>in</strong> that given year.<br />
Sex and age ratios, provided by<br />
Cache Creek Records, can then be applied to give an<br />
estimate <strong>of</strong> total population.<br />
3. In a similar manner the m<strong>in</strong>imum recruitment <strong>of</strong> yearl<strong>in</strong>gs<br />
to the male population <strong>in</strong> a given year can be obta<strong>in</strong>ed<br />
from the sum <strong>of</strong> harvests <strong>of</strong> successively older age classes<br />
<strong>in</strong> the follow<strong>in</strong>g years.<br />
This provides an estimate <strong>of</strong><br />
the one-year-old class <strong>of</strong> males <strong>in</strong> the spr<strong>in</strong>g <strong>of</strong> that<br />
year, to which can be applied the age class distribution<br />
for the male component <strong>of</strong> the population <strong>in</strong> the same year<br />
to calculate the total number <strong>of</strong> males.<br />
Recruitment <strong>of</strong><br />
yearl<strong>in</strong>g females is assumed to be equal to that <strong>of</strong><br />
yearl<strong>in</strong>g males, as hunt<strong>in</strong>g mortality is low and evenly
- 84 -<br />
divided between male and female <strong>in</strong> the calf component <strong>of</strong><br />
the harvest <strong>of</strong> the preced<strong>in</strong>g year.<br />
The age class distribution<br />
for the female component <strong>of</strong> the population is then<br />
applied to calculate total number <strong>of</strong> females.<br />
The sum<br />
<strong>of</strong> male and female totals then affords an estimate <strong>of</strong> the<br />
spr<strong>in</strong>g population <strong>of</strong> moose <strong>in</strong> the given year.<br />
By use <strong>of</strong> these methods it has been possible to produce m<strong>in</strong>imum<br />
population estimates for most <strong>of</strong> the years with<strong>in</strong> the period<br />
1950 - 1970. The estimates with some support<strong>in</strong>g data are given<br />
<strong>in</strong> the tables.<br />
RESULTS AND DISCUSSION<br />
support<strong>in</strong>g data are given <strong>in</strong> Tables 1, 2 and 3.<br />
Estimated<br />
populations are given <strong>in</strong> Table 4.
- 85 -<br />
CONCLUSIONS<br />
Harvests <strong>of</strong> approximately 20,000 moose are be<strong>in</strong>g extracted<br />
from a hunted population <strong>of</strong> 100,000 moose compris<strong>in</strong>g the<br />
spr<strong>in</strong>g population, or 135,000 moose compris<strong>in</strong>g the fall population.<br />
The male component is evaluated at approximately 40,000 from<br />
which 13,000 are harvested annually.<br />
The extraction rate is,<br />
therefore, approximately 33%.<br />
The female component is evaluated<br />
at 60,000 from which 7,000 are harvested annually for an extraction<br />
rate <strong>of</strong> 12%.<br />
The juvenile component <strong>of</strong> 35,000 calves would<br />
provide just sufficient recruitment to susta<strong>in</strong> the harvest <strong>of</strong><br />
bulls, with hunt<strong>in</strong>g mortality almost equal to natality. The<br />
male component may, therefore, be regarded as fully utilized<br />
and harvested at maximum extraction rate, but the population<br />
estimates given refer only to the hunted population.<br />
There are<br />
many areas <strong>of</strong> <strong>British</strong> <strong>Columbia</strong> which are relatively <strong>in</strong>accessible<br />
and hunters are generally reluctant to hunt far from a road<br />
because <strong>of</strong> the difficulty <strong>of</strong> br<strong>in</strong>g<strong>in</strong>g out the carcass and the<br />
trophy.<br />
In addition logg<strong>in</strong>g for pulp is a factor <strong>in</strong> the<br />
creation <strong>of</strong> moose habitat and there are signs that moose are<br />
still extend<strong>in</strong>g their range <strong>in</strong> <strong>British</strong> <strong>Columbia</strong>.<br />
The actual<br />
population <strong>of</strong> moose would, therefore, considerably exceed the<br />
estimated hunted population <strong>of</strong> 135,000, and might well agree<br />
with, or exceed, the estimate <strong>of</strong> 300,000 made by Rob<strong>in</strong>son<br />
<strong>in</strong> 1963.
Table 1.<br />
- 86<br />
This shows the composition <strong>of</strong> moose harvests<br />
between 1950 and 1970.<br />
The data is <strong>in</strong>complete for the<br />
non-resident component <strong>of</strong> the harvest and the figures<br />
shown do not <strong>in</strong>clude the numbers <strong>of</strong> moose killed <strong>in</strong><br />
subsistence hunt<strong>in</strong>g (Indians, prospectors, trappers);<br />
illegally (poach<strong>in</strong>g); or accidentally (road kills,<br />
drown<strong>in</strong>gs).<br />
Cow moose seasons contributed a female<br />
component to the harvest from 1952 onwards.<br />
It can<br />
be seen that the numbers <strong>of</strong> moose harvested <strong>in</strong>creased<br />
from 4,129 <strong>in</strong> 1950 to a peak <strong>of</strong> 25,717 <strong>in</strong> 1968.<br />
Generally the moose harvest can be said to have<br />
stabilised s<strong>in</strong>ce 1961, with numbers around the 20,000<br />
mark, <strong>of</strong> which approximately 60% were males.<br />
The<br />
population was, therefore, sufficiently large to<br />
susta<strong>in</strong> such harvests, which represent known mortality,<br />
otherwise a decl<strong>in</strong>e <strong>in</strong> yield due to overharvest<strong>in</strong>g would<br />
have occurred dur<strong>in</strong>g the period under study.
Table l. Composition <strong>of</strong> <strong>Moose</strong> Harvests 1950 - 1970<br />
RESIDENT<br />
NON RESIDENT<br />
TOTAL<br />
YEAR MALE FEMALE JUVENILE TOTAL MALE FEMALE JUVENILE TOTAL HARVEST<br />
1950 3330 3330 (799) 4129<br />
1951 4880 4880 1389 6269<br />
1952 5546 1338 6884 NA 6884<br />
1953 4684 81* 4765 NA 4765<br />
1954 4115 778 4893 1015 5908<br />
1955 4910 1133 155 6198 NA 6198<br />
1956 4726 1457 319 6502 1245 7747<br />
1957 6012 3281 608 9901 882 167 23 (1072) 10973<br />
1958 8273 2578 695 11546 874 149 20 (1043) 12589<br />
1959 8402 3262 536 12220 998 136 22 (1156) 13376 OJ<br />
--J<br />
1960 8145 2280 868 11293 1153 129 22 (1304) 12597<br />
1961 10291 4101 862 15254 1532 300 46 1878 17132<br />
1962 9873 5408 1394 16675 NA NA NA 2047 18722<br />
1963 9531 5585 1394 16510 1546 445 74 (2065) 18575<br />
1964 10541 6241 1071 17851 1486 499 71 (2056) 19909<br />
1965 8897 5113 1215 15225 1872 793 159 2823 18048<br />
1966 11027 7173 1740 19940 2105 880 184 3169 23109<br />
1967 10353 7028 2016 19397 2257 867 158 3283 22680<br />
1968 12590 8282 1597 22469 2247 859 142 3248 25717<br />
1969 8901 5116 1188 15205 2383 608 152 3143 18348<br />
1970 9883 5276 1291 16450 2318 691 141 3150 19600<br />
* Low season <strong>in</strong> Wells Gray Park only<br />
( ) Cache Creek Records: less than true number<br />
NA Not available
Table 2.<br />
- 88-<br />
This table provides a breakdown <strong>of</strong> the age class<br />
distribution <strong>of</strong> the moose population, and is derived<br />
from Cache Creek Records, which provide <strong>in</strong>formation on<br />
the age class distribution <strong>of</strong> the harvest.<br />
The assumption<br />
is made that the majority <strong>of</strong> moose hunters are relatively<br />
unselective <strong>in</strong> tak<strong>in</strong>g bulls and that vulnerability and<br />
desirability <strong>of</strong> moose differ little between age classes<br />
over the age <strong>of</strong> yearl<strong>in</strong>g; the proportions <strong>of</strong> each age<br />
class <strong>in</strong> the harvest may thus be regarded as representative<br />
<strong>of</strong> the proportions <strong>of</strong> each age class <strong>in</strong> the population.<br />
There is a clear difference between the age structures<br />
<strong>of</strong> the male and female components <strong>of</strong> the population,<br />
and this is reflected <strong>in</strong> the mean ages, calculated<br />
as unweighted means <strong>in</strong> which the 5+ class is counted<br />
only as five.<br />
If the only major difference <strong>in</strong> mortality<br />
<strong>of</strong> male and female moose is that due to hunt<strong>in</strong>g then<br />
the figures illustrate that hunt<strong>in</strong>g mortality is large<br />
enough to have a marked effect on the structure <strong>of</strong><br />
male population.
Table 2. Age Class Distribution and Mean <strong>of</strong> <strong>Moose</strong> population* 1961 - 1970<br />
MALE<br />
FEMALE<br />
Age Class (Years)%<br />
Age Class (Years)%<br />
UNWEIGHTED<br />
UNWEIGHTED<br />
YEAR 1 2 3 4 5+ MEAN AGE 1 2 3 4 5+ MEAN AGE<br />
1961 36.6 20.5 18.3 14.6 9.9 2.40 15.3 19.4 17.6 21.8 25.9 3.23<br />
1962 27.8 25.4 19.9 12.1 14.8 2.61 25.1 18.9 18.5 14.1 23.4 2.92<br />
1963 26.8 24.6 19.8 12.5 16.3 2.67 15.9 16.5 21.8 18.2 27.6 3.25<br />
1964 28.8 19.5 21.3 15.9 14.6 2.68 19.4 15.8 20.2 18.7 25.9 3.16<br />
00<br />
1965 25.6 18.1 23.1 17.7 15.5 2.79 18.7 18.8 22.8 15.6 24.1 3.08<br />
1966 25.9 22.4 20.0 15.0 16.8 2.75 19.1 17.3 18.5 19.6 25.4 3.15<br />
1967 24.3 23.1 21.4 15.1 16.2 2.76 20.4 19.4 18.6 16.7 24.9 3.06<br />
1968 24.0 24.0 20.7 14.1 17.3 2.77 20.3 19.7 19.9 15.8 24.2 3.04<br />
1969 29.8 21.3 18.6 14.8 15.5 2.65 19.2 17.6 20.3 16.9 26.0 3.13<br />
1970 33.4 19.9 10.4 7.3 29.0 2.79 26.5 16.8 8.5 7.6 40.6 3.19<br />
\D<br />
*Spr<strong>in</strong>g Population
Table 3.<br />
- 90 -<br />
This table has been constructed to show the<br />
estimated numbers <strong>in</strong> each age class <strong>in</strong> the spr<strong>in</strong>g<br />
populations dur<strong>in</strong>g the period 1961 - 1970. The<br />
figures can be used to calculate m<strong>in</strong>imum recruitment<br />
to particular years or the m<strong>in</strong>imum numbers alive <strong>in</strong><br />
particular years.<br />
Thus, m<strong>in</strong>imum recruitment to the<br />
male yearl<strong>in</strong>g class can be calculated from the table<br />
to provide the follow<strong>in</strong>g:<br />
Year<br />
Recruitment<br />
1961 11,877<br />
1962 11,090<br />
1963 10,452<br />
1964 10,787<br />
1965 11,073<br />
1966 12,221<br />
Recruitment to the years 1967 to 1970 cannot be<br />
calculated <strong>in</strong> this fashion because <strong>of</strong> the limitation<br />
imposed by the <strong>in</strong>exact nature <strong>of</strong> the 5+ age class.
- 91-<br />
Table 3.<br />
Estimated Numbers <strong>in</strong> Each Age Glass <strong>of</strong><br />
<strong>Moose</strong> Harvests 1961-70<br />
MALE<br />
Age Class (Years)<br />
YEAR l~ 2~ 3., 4~ 5+ TOTAL<br />
1961 4327 2436 2163 1726 1171 11823<br />
1962 3162 2889 2263 1376 1683 11873<br />
1963 2969 2725 2193 1385 1805 11077<br />
1964 3452 2345 2562 1912 1756 12027<br />
1965 2757 1949 2487 1906 1669 10768<br />
1966 3388 2942 2626 1970 2206 13132<br />
1967 3052 2913 2699 1904 2042 12610<br />
1968 3561 3546 3071 2092 2567 14837<br />
1969 3363 2403 2099 1670 1749 11284<br />
1970 4075 2428 1269 891 3538 12201<br />
FEMALE<br />
Age Class (Years)<br />
TOTAL<br />
YEAR 1., 2~ 3., 4., 5+ TOTAL JUVENILE HARVEST<br />
1961 673 854 775 959 1140 4401 908 17132<br />
1962 1478 1113 1089 830 1378 5888 1461 18722<br />
1963 959 995 1315 1097 1664 6030 1468 18575<br />
1964 1308 1065 1361 1260 1746 6740 1142 19909<br />
1965 1105 1110 1347 921 1423 5906 1374 18048<br />
1966 1538 1393 1490 1578 2054 8053 1924 23109<br />
1967 1611 1532 1469 1318 1966 7896 2174 22680<br />
1968 1856 1801 1819 1444 2221 9141 1739 25717<br />
1969 1099 1008 1162 967 1488 5724 1340 18348<br />
1970 1581 1002 507 454 2423 5967 1432 19600
Table 4.<br />
- 92-<br />
Table 4 shows estimated populations, cover<strong>in</strong>g two<br />
periods with<strong>in</strong> the years 1950 to 1970.<br />
The first period,<br />
us<strong>in</strong>g Method 1 for calculation, covers the years<br />
1950 - 1957 and provides a mean value for the fall<br />
population <strong>of</strong> 84,960. The lowest value is 53,607<br />
<strong>in</strong> the year 1956, and the highest value is 143,101 for<br />
the year 1952.<br />
Normal productivity would be <strong>in</strong>sufficient<br />
to account for the leap from one year's population to<br />
the next <strong>in</strong> some cases, and the amount <strong>of</strong> variability<br />
is largely attributable to the <strong>in</strong>exactitude <strong>of</strong> the<br />
method <strong>of</strong> calculation. However, as the estimates can<br />
only refer to the hunted population an <strong>in</strong>crease from<br />
one year to the next may be partially expla<strong>in</strong>ed by<br />
the expansion <strong>of</strong> hunt<strong>in</strong>g <strong>in</strong>to previously unhunted,<br />
or very lightly hunted, areas -<br />
a process which was<br />
tak<strong>in</strong>g place at that time.<br />
Dur<strong>in</strong>g the same period the<br />
ratios <strong>of</strong> male:female:juvenile show a trend <strong>in</strong> which<br />
the number <strong>of</strong> females relatively dim<strong>in</strong>ished, while the<br />
cow:calf ratio <strong>in</strong>creased:<br />
from 1.0 : 2.6 : 1.1 to<br />
1.0 : 2.2 : 0.9. This is <strong>in</strong> keep<strong>in</strong>g with the effects<br />
<strong>of</strong> the antler less seasons which were <strong>in</strong>stituted dur<strong>in</strong>g<br />
this period.
- 93 -<br />
Table 4.<br />
Estimated populations Between the Years<br />
1950-1970.<br />
(a) Fall POEulations<br />
Method <strong>of</strong><br />
Year calculation Male Female Juvenile Total<br />
1950 13927 39771 16293 69991<br />
1951 22198 72175 30581 126176<br />
1952 28359 81554 33188 143101<br />
1953 19288 51247 20609 91144<br />
1954 1 14137 34197 12824 61158<br />
1955 15736 34623 13946 64305<br />
1956 13093 28423 12091 53607<br />
1957 17630 37908 15881 71420<br />
MEAN<br />
1950-57 18046 47487 19427 84960<br />
1961 30754<br />
1962 31492<br />
1963 31932<br />
1964 2 33353<br />
1965 33565<br />
1966 37377<br />
MEAN*<br />
1961-66 33000 72600 29700 135300<br />
*Mean rounded, us<strong>in</strong>g d ' : J=l 2.2 : 0.9<br />
(b) BEr<strong>in</strong>g: pOEulations<br />
Method <strong>of</strong><br />
Year calculation Male Female Juvenile Total<br />
1961 32450 77627 110077<br />
1962 39892 44183 84075<br />
1963 39000 65735 104735<br />
1964 3 37455 55603 93058<br />
1965 43254 59213 102467<br />
1966 47185 63984 111169<br />
MEAN<br />
1961-66 39873 61057 100930
- 94 -<br />
The second period covers the years 1961 to 1966,<br />
us<strong>in</strong>g Method 2 for calculation, and provides a mean <strong>of</strong><br />
135,000 for the fall population. The male:female:<br />
juvenile ratio applied <strong>in</strong> the calculation was 1.0<br />
2.2 : 0.9. This was derived from the 1955 - 1957<br />
cache creek Records, the closest data available, and<br />
possibly favours the female component too highly if<br />
the trend noted above cont<strong>in</strong>ued <strong>in</strong>to the second<br />
period.<br />
The male component is m<strong>in</strong>imal, based on the<br />
numbers which must have been alive <strong>in</strong> each year <strong>in</strong><br />
order to subscribe to later harvests.<br />
Also dur<strong>in</strong>g the second period <strong>of</strong> 1961 -<br />
1966 the<br />
spr<strong>in</strong>g populations, calculated by Method 3, show a mean<br />
for the period <strong>of</strong> 100,930 consist<strong>in</strong>g <strong>of</strong> 39,870 males<br />
and 61,057 females.<br />
The population estimates by this<br />
method <strong>of</strong> calculation range from 84,075 <strong>in</strong> the year<br />
1962 to 111,169 <strong>in</strong> the year 1966. There is thus a<br />
high degree <strong>of</strong> consistency <strong>in</strong> the data, collected<br />
<strong>in</strong>dependently <strong>in</strong> each <strong>of</strong> the years 1961 to 1970, which<br />
forms the basis <strong>of</strong> the estimates.<br />
The estimates for<br />
the female component show more variation than those<br />
for the male component, which is not surpris<strong>in</strong>g as<br />
they depend on fewer observations because <strong>of</strong> smaller<br />
numbers <strong>of</strong> females <strong>in</strong> the harvest.
- 95 -<br />
LITERATURE CITED<br />
F<strong>in</strong>egan, R.P. 1965, 1966, 1967, 1968, 1970. Game Harvest<br />
Questionnaire Analysis. B.C. Fish & wildlife Branch.<br />
1964 - 1970.<br />
F<strong>in</strong>egan, R.P. 1966. Reliability <strong>of</strong> the Hunter Sample: Game<br />
Harvest Questionnaire Analysis 1966: 160-165. B.C. Fish<br />
& Wildlife Branch.<br />
Lark<strong>in</strong>, P. 1955. Hunter Sample Analysis. B.C. Fish & Game<br />
Branch.<br />
McCaughran, D.A.<br />
Game Branch.<br />
1962 & 1963. Hunter Samples.<br />
1950 - 1963.<br />
B.C. Fish &<br />
Mccaughran, D.A. 1963. Goat Questionnaire Analysis 1963.<br />
B.C. Fish & Game Branch.<br />
Mccaughran, D.A. 1964. Game Harvest Questionnaire Analysis.<br />
B.C. Fish & Wildlife Branch. 1964 - 1970.<br />
Rob<strong>in</strong>son, D.J. 1962. Management <strong>of</strong> <strong>Moose</strong> by Population Ratios.<br />
42nd Annual Conference <strong>of</strong> the Western Association <strong>of</strong> State<br />
Fish & Game Commissioners: Seattle, Wash<strong>in</strong>gton.<br />
Rob<strong>in</strong>son, D.J. 1963. Inventory and Evaluation <strong>of</strong> the wildlife<br />
Resources <strong>of</strong> <strong>British</strong> columbia. 15th <strong>British</strong> columbia<br />
Natural Resources Conference.<br />
Sugden, L.G. 1950. Hunter sample 1950. B.C. Fish & Game<br />
Branch.<br />
Sugden, L.G. 1950. Hunter Samples. B.C. Fish & Game Branch.<br />
1950 - 1963.<br />
Taylor, E.W. 1958. The 1958 Hunter Sample Follow-Up Survey.<br />
B.C. Fish & Game Branch.<br />
Taylor, M.M. and E.W. 1951-1961. Hunter Samples. B.C. Fish<br />
& Game Branch. 1950 - 1963.<br />
various Authors. Cache Creek Records. B.C. Fish & Wildlife<br />
Branch. 1946 - 1970.