Hunting Economic Impact - Association of Fish and Wildlife Agencies
Hunting Economic Impact - Association of Fish and Wildlife Agencies
Hunting Economic Impact - Association of Fish and Wildlife Agencies
- No tags were found...

Create successful ePaper yourself
Turn your PDF publications into a flip-book with our unique Google optimized e-Paper software.
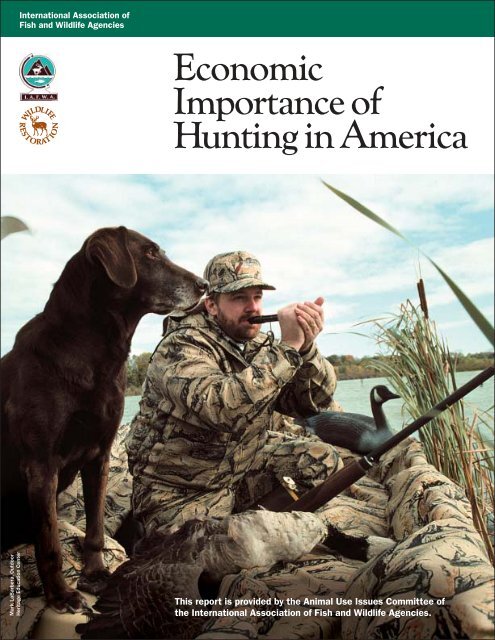
International <strong>Association</strong> <strong>of</strong><strong>Fish</strong> <strong>and</strong> <strong>Wildlife</strong> <strong>Agencies</strong><strong>Economic</strong>Importance <strong>of</strong><strong>Hunting</strong> in AmericaMark LaBarbera, OutdoorHeritage Education CenterThis report is provided by the Animal Use Issues Committee <strong>of</strong>the International <strong>Association</strong> <strong>of</strong> <strong>Fish</strong> <strong>and</strong> <strong>Wildlife</strong> <strong>Agencies</strong>.
Mark LaBarbera, Outdoor Heritage Education CenterIntroductionKelly Heath <strong>of</strong> rural Millston, Wisconsin,drove 80 miles round trip to the G<strong>and</strong>erMountain store in Eau Claire to buy theRemington 870 that best fits her. Shemade the trip many times, once to purchaseher new Mathews bow <strong>and</strong> accessories,<strong>and</strong> another time to buy Flambeaudecoys. Her spending is driven by herdesire to spend her spare time relaxing inpeaceful natural surroundings with theadded anticipation <strong>of</strong> getting close enoughto game to get a clean shot. As she gearsup to step outside with her hunting partner,Pat, she creates a sale, which providespr<strong>of</strong>it for the store’s corporate headquartersin Bloomington, Minnesota <strong>and</strong> formanufacturers in places like NorthCarolina, Wisconsin <strong>and</strong> Ohio. In turn,these companies buy supplies <strong>and</strong> payemployees. Kelly’s money helps salesmen,distributors <strong>and</strong> truck drivers who deliverthe hunting gear. Add together what Kellyspends by the number <strong>of</strong> times each yearshe stops at that G<strong>and</strong>er Mountain store,or the Flying J Truck Stop & Restaurantup the road, where she buys food <strong>and</strong> fuel,<strong>and</strong> her expenditures add up. Now multiplyit by 13 million hunters <strong>and</strong> you comeup with a major boost for the economy.Purchases by hunters like Kelly touch allparts <strong>of</strong> the nation, from oil field workersin Oklahoma to the wheat growers <strong>of</strong> thecentral plains, plus all their employees <strong>and</strong>suppliers everywhere.<strong>Hunting</strong> in America is big business, generatingmore than $67 billion in economicoutput <strong>and</strong> more than one million jobs inthe United States. The vast majority <strong>of</strong>Americans embrace hunting lock, stock<strong>and</strong> barrel for its social, cultural <strong>and</strong>conservation contributions.Like baseball <strong>and</strong> apple pie, hunting isan American tradition shared by young<strong>and</strong> old, rich <strong>and</strong> poor, regardless <strong>of</strong> socialor economic status. <strong>Hunting</strong> is notDemocratic or Republican; it knows nogeographic or congressional boundaries.Its history <strong>and</strong> heritage crosses all racial<strong>and</strong> ethnic boundaries.Yes, it is big business, which generates$25 billion in retail sales, $17 billion insalaries <strong>and</strong> wages, <strong>and</strong> employs 575,000Americans, creating sales tax, stateincome tax <strong>and</strong> federal income taxrevenues for government agencies <strong>and</strong>the people they serve. But hunting ismore than a positive economic force.It is also a strong, wholesome influenceon American society. It is a healthyAmerican activity, steeped in heritage,which touches the most important aspects<strong>of</strong> our lives, like families <strong>and</strong> friends,<strong>and</strong> a sense <strong>of</strong> stewardship for allthings wild.ABC’s <strong>of</strong> a<strong>Hunting</strong> EconomyA is for Archers <strong>and</strong> other hunters, but“B” is for Billions <strong>of</strong> Big Buck itemsBought from Businesses that Benefitfrom Buying by Bowhunters <strong>and</strong> othershooting sports enthusiasts. Yes, “B”is for Billions, as in the $5.3 Billionhunters spend on hunting-relatedtravel, <strong>and</strong> $6.4 Billion on huntingequipment, plus $8.4 Billion on otherbig-ticket items. So, then, is “C” forCash, Check or Credit Card?<strong>Hunting</strong> Is Good for Body <strong>and</strong> SoulAs the speed <strong>of</strong> business increases, <strong>and</strong>the pressures <strong>of</strong> global competition <strong>and</strong>consolidation in our high tech society putmore dem<strong>and</strong>s on working women <strong>and</strong>men, hunting provides a healthy escape.It <strong>of</strong>fers relaxation <strong>and</strong> affords qualitytime with family <strong>and</strong> friends. Whether in adeer or duck blind, farm field or ridgeline,hunting provides a peaceful, fun settingwhere people re-connect with each other<strong>and</strong> with nature.It is no wonder that more than 13 millionAmericans age 16 <strong>and</strong> older hunted in2001. When you look at hunting <strong>and</strong>target shooting combined, a 2001 RoperStarch study verified that more than26 million Americans participated in allshooting sports. That same independentscientific researched revealed that thepublic accepts the shooting sports just asit accepts tennis <strong>and</strong> golf.2
Mark LaBarbera, Outdoor Heritage Education CenterMark LaBarbera, Outdoor Heritage Education CenterHunters—An <strong>Economic</strong> PowerAnd hunters are good for the economy.They not only purchase hunting gear,trucks <strong>and</strong> boats; they also fill their gastanks <strong>and</strong> coolers. They stay at motels <strong>and</strong>resorts. They buy hunting clothes <strong>and</strong>those go<strong>of</strong>y hunting hats with sayings thatare sometimes funny <strong>and</strong> always a conversationpiece. On average, each hunterspends $1,896 per year on hunting, whichis 5.5% <strong>of</strong> the typical wage earner’s annualincome. These expenditures then “ripple”through the economy generating threetimes more impact for the U.S. economy.For many communities, hunting dollarskeep them afloat.Hunters also pay a truckload <strong>of</strong> specialexcise taxes. The <strong>Wildlife</strong> RestorationFund under the Pittman-Robertson legislationcollects these excise taxes on certainhunting equipment <strong>and</strong> apportionsthem to state natural resource agencies forconservation <strong>and</strong> education, whichincludes habitat restoration, shooting■ A hunter’s best friend is his dog <strong>and</strong> they show it—hunters spend $605 million onhunting dogs, well more than the $513 million skiers spend on ski equipment.■ Each year hunters spend more money on food for hunting trips than Americansspend on Domino’s pizza. Business generated by hunters is <strong>of</strong>ten the lifeblood<strong>of</strong> rural communities.■ Over a half million jobs in America are supported by hunters. That’s more jobsthan the combined employees <strong>of</strong> all the top U.S. based airlines includingAmerican, United, Delta, Northwest, Continental, US Airways, Southwest, AlaskaAir <strong>and</strong> American West.■ The $2.4 billion in annual federal income-tax money generated by hunters’spending could cover the annual paychecks <strong>of</strong> 100,000 troops. That’s 8 divisions,143 battalions, 3,300 platoons <strong>and</strong> some major money.Source: Congressional Sportsmen’s Foundationranges, wildlife research <strong>and</strong> more. Forfiscal year 2002, this program deliveredmore than $481 million to the states <strong>and</strong>territories <strong>of</strong> the United States, with morethan $292 million <strong>of</strong> it for sport fishrestoration <strong>and</strong> more than $188 million<strong>of</strong> it for wildlife restoration. Together,hunters <strong>and</strong> anglers may very well be themost important source <strong>of</strong> conservationfunding in the United States.<strong>Economic</strong> <strong>Impact</strong> Continues to GrowIn good times <strong>and</strong> bad, hunters set theirsights on spending more time in the fields<strong>and</strong> forests. Even when economic recession<strong>and</strong> uncertainty over homel<strong>and</strong> securityhave the nation <strong>and</strong> the economyrecoiling, hunters continue to aim theirleisure time <strong>and</strong> money toward shootingsports activities. For example, since 1991,when the nation was mired in a similarrecession <strong>and</strong> war, retail sales have grownnearly 17% (adjusted for inflation).Many just do not realize the positiveimpacts generated by hunters. A recentreport released by the CongressionalSportsmen’s Foundation highlights thatAmericans spend more on hunting dogsthan they do for ski equipment. If that’snot enough, the $2.4 billion in federalincome tax revenue generated by hunterscould cover the annual paychecks for100,000 U.S. Army troops. At the statelevel, the hunter’s economic effects canbe especially important. In Georgia, forexample, hunting expenditures wereone-third greater than the value <strong>of</strong> thisstate’s famous peanut harvest, providing atremendous boost to rural areas. Those arethe kinds <strong>of</strong> numbers that should turn thehead <strong>of</strong> any state legislator or politician.And that’s just the point.3
“Does hunting drive the economy?You bet, especially in ruralcommunities! A lot <strong>of</strong> us paygood money traveling <strong>and</strong> huntingon farms <strong>and</strong> ranches across theUnited States. And rural communitiessure are glad to see us.”Bill Miller, Executive Director,North American <strong>Hunting</strong> ClubMark LaBarbera, Outdoor Heritage Education CenterSales <strong>and</strong> the Ripple EffectThe shooting sports are so much morethan simply pulling a trigger or releasing abowstring. They represent financial opportunityfor every American community,especially rural economies. Each purchasemade by hunters sets <strong>of</strong>f a chain reaction<strong>of</strong> economic benefits.When Marlin Firearms in New Haven,Connecticut, Leupold & Stevens inBeaverton, Oregon <strong>and</strong> Weatherby, Inc.in Atascadero, California pay theiremployees to produce hunting products,their employees use that money to buyfood, clothes, housing <strong>and</strong> other goods<strong>and</strong> services. The stores, farmers, gasstations <strong>and</strong> others that make <strong>and</strong> sellthose goods <strong>and</strong> services, in turn, spendtheir earnings, <strong>and</strong> a positive ripple flowsthrough the economy.They all pay sales taxes <strong>and</strong> incometaxes. In addition, hunting productmanufacturers pay excise taxes to benefitconservation.North, South, East <strong>and</strong> West, hunting’spositive economic impact creates jobs<strong>and</strong> helps urban <strong>and</strong> rural communitiesthroughout the United States. Just askretailer Butch Hebert, owner <strong>of</strong> Boone’sCorner in beautiful southwest Louisiana,who said, “We beef up our inventory15%-20% each year to prepare forhunting season.”Top Ten States Ranked by Annual <strong>Hunting</strong>-Related Retail SalesAnd down the road, Trudy Young <strong>of</strong>Young’s Grocery, said she banks onextra sales <strong>of</strong> food, cooking supplies <strong>and</strong>everything from batteries to toilet paperwhen hunting season begins in thisoutdoor paradise.“Hunter-vationists”“Most hunters don’t realize the enormouseffect they can have on state <strong>and</strong> nationaleconomies,” said John Baughman,Executive Vice President <strong>of</strong> theInternational <strong>Association</strong> <strong>of</strong> <strong>Fish</strong> <strong>and</strong><strong>Wildlife</strong> <strong>Agencies</strong> (IAFWA). “And mostelected <strong>of</strong>ficials don’t realize the conservationcontributions <strong>and</strong> economic power <strong>of</strong>hunters <strong>and</strong> the hunting business. Thisreport should make it clear,” he said.Retail SalesTotal Multiplier Effect1 Texas $1,761,285,042 $3,636,484,7382 Pennsylvania $1,165,059,772 $2,275,366,6323 Wisconsin $960,104,751 $1,770,420,2304 New York $891,031,344 $1,529,508,7165 Alabama $799,303,993 $1,576,405,4556 Ohio $713,886,248 $1,539,487,8977 Michigan $671,670,664 $1,281,527,9148 Minnesota $664,200,412 $1,316,964,3129 Tennessee $623,025,977 $1,321,659,46710 Louisiana $581,066,601 $992,471,903Big Wheels Keep onTurning, Proud HuntersKeep on SpendingHunters travel near <strong>and</strong> far to spendtime in beautiful surroundings. Inperson or via phone calls, faxes <strong>and</strong>emails, they plan their outings withfriends <strong>and</strong> families, as they anticipatethe adventure, similar to planning thefamily vacation. When they drive torural destinations <strong>and</strong> spend the night,the cumulative effect is amazingly big.Even after September 11, 2001, whenthe travel industry was suffering,hunters were hitting the road <strong>and</strong>patronizing rural motels, diners, gasstations <strong>and</strong> other businesses. Onlodging alone for the entire year 2001,hunters spent $276 million! Withoutthe steadfast economic input fromhunters, America’s economy—includingrural businesses that rely ontourism—would suffer.4
Theodore Roosevelt Conservation AllianceState natural resource agencies managefish <strong>and</strong> wildlife for the benefit <strong>of</strong> all citizens,regardless <strong>of</strong> whether they hunt orfish. Yet, sportsmen who buy licenses <strong>and</strong>purchase equipment provide most <strong>of</strong> theirbudgets. Despite the significant contributionsby sportsmen <strong>and</strong> their supportingindustries, wildlife agencies constantlyhear the old, worn-out argument about“jobs versus the environment.” The fact is,employment, economy <strong>and</strong> environmentall start with “E.” Healthy naturalresources create jobs, enhance the economy<strong>and</strong> support both rural <strong>and</strong> urbancommunities that properly manage thoseresources.“Well, hunters <strong>and</strong> the hunting industrycan argue for both healthy habitat <strong>and</strong>jobs concurrently,” according to IAFWAPresident Brent Manning, who is also thelong-time head <strong>of</strong> the Illinois Department<strong>of</strong> Natural Resources. “It takes money toconserve <strong>and</strong> restore habitat <strong>and</strong> wildlife.Sportsmen are the single largest source <strong>of</strong>conservation revenues. When people canaccess healthier habitats, they have morefun <strong>and</strong> spend more money. This cycle createsjobs <strong>and</strong> boosts revenues for greaterconservation efforts. Everyone wins.”The numbers in this report make it easyto underst<strong>and</strong> the economic impact <strong>of</strong>hunting in every state. While everyoneknows that hunting is good for families,our social well-being <strong>and</strong> environmentalstewardship, they <strong>of</strong>ten overlook itsimportant economic impact. Howeveryou look at it, hunting is a major boost tothe economy <strong>and</strong> the environment. Asthis report clearly shows, Americans havemore reasons than ever before to supporthunting—an activity that greatly benefitsthe country as a whole. The samewhistling <strong>of</strong> waterfowl wings <strong>and</strong> springgobbles that inspired George Washington,Thomas Jefferson <strong>and</strong> our other Americanforefathers, can stir the imaginations <strong>and</strong>economies <strong>of</strong> future generations. In theend, history <strong>and</strong> our heirs will judge ourleadership by the actions we take <strong>and</strong>the decisions we make regarding ourresources—natural, social <strong>and</strong>economic—during our time on Earth.Tested <strong>and</strong> ReliableMost <strong>of</strong> the statistics in this reportare from the 2001 National Survey<strong>of</strong> <strong>Fish</strong>ing, <strong>Hunting</strong> <strong>and</strong> <strong>Wildlife</strong>-Associated Recreation, initiated atthe request <strong>of</strong> state natural resourceagencies, <strong>and</strong> conducted every fiveyears for the U.S. <strong>Fish</strong> <strong>and</strong> <strong>Wildlife</strong>Service by the U.S. Census Bureau.The numbers are based on U.S.citizens 16 years <strong>of</strong> age <strong>and</strong> older.Independent third parties, such asresource economics consulting firmSouthwick Associates, use provenresearch methods to develop economicinformation <strong>and</strong> analyze the data.Mark LaBarbera, Outdoor Heritage Education Center5
Numbers <strong>of</strong> Hunters <strong>and</strong> Days <strong>of</strong> <strong>Hunting</strong>, 2001Number <strong>of</strong> Hunters Per State by Type <strong>of</strong> <strong>Hunting</strong>Days <strong>of</strong> <strong>Hunting</strong> Per State by Type <strong>of</strong> <strong>Hunting</strong>All Deer Migratory Bird Upl<strong>and</strong> Game All Deer Migratory Bird Upl<strong>and</strong> Game<strong>Hunting</strong> <strong>Hunting</strong> Only <strong>Hunting</strong> Only <strong>Hunting</strong> Only <strong>Hunting</strong> <strong>Hunting</strong> Only <strong>Hunting</strong> Only <strong>Hunting</strong> OnlyAlabama 422,782 378,753 93,737 -! 7,615,502 6,308,547 480,660 -!Alaska 93,354 18,615* 14,431* -! 1,145,862 182,769* 122,918* -!Arizona 147,504 62,672* 60,889* 58,686* 1,693,994 556,192* 334,516* 545,523*Arkansas 430,694 314,429 171,158 -! 8,411,150 4,791,835 1,859,911 -!California 273,675 -! -! -! 3,425,654 -! -! -!Colorado 280,596 98,709* -! -! 2,610,127 625,312* -! -!Connecticut 45,262 -! -! -! 765,506 -! -! -!Delaware 15,925 10,602* -! -! 225,815 155,029* -! -!Florida 226,252 156,259* -! -! 4,693,274 2,930,383* -! -!Georgia 416,833 331,942 85,675* -! 7,972,711 5,769,381 473,595* -!Hawaii 16,940 -! -! -! 316,003 -! -! -!Idaho 196,543 124,517 36,404* 65,408 2,100,413 836,871 307,869* 647,407Illinois 310,458 238,443* -! -! 4,521,757 3,145,684* -! -!Indiana 290,181 215,016 -! -! 5,000,118 2,592,588 -! -!Iowa 242,981 132,894 55,920* 137,042 3,989,010 1,345,951 584,200* 1,526,980Kansas 291,193 139,920 78,562 186,516 3,646,631 1,295,331 590,237 1,853,705Kentucky 322,654 230,787 56,904* -! 4,663,776 2,280,762 385,569* -!Louisiana 332,556 206,594 142,063 -! 6,441,650 4,250,049 1,217,637 -!Maine 164,480 145,399 -! 51,785 2,468,778 1,918,348 -! 562,361Maryl<strong>and</strong> 145,126 126,262 -! -! 1,798,899 1,298,332 -! -!Massachusetts 66,018 55,701* -! -! 1,157,640 610,371* -! -!Michigan 753,507 666,801 -! -! 8,993,683 6,265,880 -! -!Minnesota 596,602 474,927 183,668* 241,248 8,437,408 4,587,084 1,661,055* 1,857,180Mississippi 356,786 288,455 0* -! 8,481,295 6,689,993 0* -!Missouri 488,611 372,726 68,848* -! 6,605,601 3,783,251 840,866* -!Montana 228,858 154,500 -! 43,206* 2,442,222 1,074,933 -! 460,995*Nebraska 173,307 78,010 48,022 108,323 2,203,652 662,126 397,611 1,203,092Nevada 47,147 -! 28,831* -! 490,298 -! 235,514* -!New Hampshire 78,189 67,169 -! -! 1,459,049 1,000,798 -! -!New Jersey 134,772 111,383 -! -! 3,119,724 2,742,281 -! -!New Mexico 130,133 74,765 34,144* -! 1,667,054 398,622 262,414* -!New York 714,140 651,386 -! 162,028* 13,187,353 9,132,819 -! 1,180,083*North Carolina 295,228 207,260 102,283 51,753 7,526,009 4,746,764 1,245,184 539,817North Dakota 139,262 74,030 60,863* -! 1,634,942 553,635 408,660* -!Ohio 490,395 417,209 -! 115,317* 10,233,091 4,061,849 -! 1,354,938*Oklahoma 260,599 198,954 81,109* 74,684* 5,642,357 2,978,901 1,073,500* 1,209,314*Oregon 248,422 183,343 41,992* 55,013* 2,947,339 1,527,641 341,007* 457,172*Pennsylvania 999,749 932,379 -! 214,635* 13,955,198 7,412,976 -! 2,348,369*Rhode Isl<strong>and</strong> -! -! -! -! -! -! -! -!South Carolina 265,183 207,049 70,675* -! 4,744,340 3,506,727 366,250* -!South Dakota 208,635 68,362 50,838 147,512 2,424,869 474,372 526,374 1,608,604Tennessee 359,398 228,125 97,334* -! 6,650,666 3,665,105 797,223* -!Texas 1,201,054 859,881 500,404 174,364* 14,081,256 8,297,931 4,178,589 674,343*Utah 198,271 138,801 52,422 53,807 2,454,904 788,757 509,681 262,081Vermont 99,989 92,297 -! 20,778* 1,509,576 1,118,168 -! 223,987*Virginia 354,841 312,992 -! -! 5,817,697 4,059,282 -! -!Washington 227,242 156,466 49,878* 72,065* 2,950,917 1,121,989 521,798* 752,772*West Virginia 283,990 259,029 -! -! 5,166,160 2,707,187 -! -!Wisconsin 659,664 596,464 -! 193,278 9,652,829 7,051,627 -! 1,935,159Wyoming 133,340 65,952 -! -! 1,304,045 475,902 -! -!United States 13,034,000 10,272,000 2,956,000 3,184,343 228,167,000 133,456,955 29,309,799 29,621,447* = small samples size (45 or less)!= sample size too small to report reliably (25 or less)Source: U.S. <strong>Fish</strong> <strong>and</strong> <strong>Wildlife</strong> Service, “2001 National Survey <strong>of</strong> <strong>Fish</strong>ing, <strong>Hunting</strong> <strong>and</strong> <strong>Wildlife</strong>-Associated Recreation”6
Travel <strong>and</strong> Equipment Expenditures, 2001MigratoryUpl<strong>and</strong><strong>Hunting</strong>, All Types Deer <strong>Hunting</strong> Bird <strong>Hunting</strong> Game <strong>Hunting</strong>Number <strong>of</strong> Hunters 13,034,000 11,075,514 3,214,693 3,184,343Days <strong>of</strong> hunting 228,167,000 133,456,955 29,309,799 29,621,447Food, drink & refreshments $1,980,395,000 $1,104,712,983 $227,971,968 $245,925,790Lodging (motels, cabins, lodges or campgrounds, etc.) $469,547,000 $239,372,400 $52,396,842 $92,625,855Public transportation, including airplanes, trains, buses, & car rentals, etc $185,994,000 $41,932,806 $64,655,466 $31,235,160Transportation by private vehicle $1,603,326,000 $828,435,272 $181,892,253 $232,467,606Guide fees, pack trip or package fees $377,233,000 $98,865,063 $35,071,012 $50,149,437Public l<strong>and</strong> use or access fees $53,499,000 $31,759,038 $8,949,085 $2,165,629Private l<strong>and</strong> use or access fees (except leases) $370,858,000 $226,701,013 $45,995,544 $59,309,874Heating & cooking fuel $89,232,000 $57,047,393 $12,871,216 $6,474,217Equipment rental such as boats, hunting or camping equipment, etc. $36,395,000 $18,072,262 $2,402,294 $6,609,083Boat fuel $42,553,000 $11,046,742 $11,981,573 $2,756,146Boat launching fees $6,448,000 $1,828,788 $1,503,188 $94,245Boat mooring, storage, maintenance, insurance, etc. $36,912,000 $9,971,545 $11,252,785 $2,342,090Rifles $907,470,000 $493,054,228 $71,006,832 $29,046,992Shotguns $676,619,000 $121,351,243 $272,622,743 $134,550,007Muzzleloaders & other primitive firearms $105,507,000 $75,702,787 $7,453,560 $158,348H<strong>and</strong>guns $277,270,000 $81,800,768 $48,230,418 $15,022,458Bows, arrows & archery equipment $462,097,000 $334,113,948 $4,793,042 $912,307Telescopic sights $307,033,000 $179,189,675 $7,192,147 $4,878,168Decoys & game calls $139,686,000 $31,907,778 $77,267,260 $6,005,580Ammunition $651,896,000 $228,796,083 $166,876,951 $58,344,642H<strong>and</strong> loading equipment & components $139,919,000 $60,765,491 $17,419,884 $11,006,956<strong>Hunting</strong> dogs <strong>and</strong> associated costs $604,616,000 $69,075,596 $246,363,096 $123,090,676Other hunting equipment (cases, knives, etc.) $289,595,000 $122,338,719 $41,969,451 $21,872,779Camping equipment $182,237,000 $59,861,264 $4,992,868 $9,438,486Binoculars, field glasses, telescopes, etc. $172,056,000 $79,472,570 $12,565,450 $3,208,125Special hunting clothes, foul weather gear, boots, waders, etc. $543,582,000 $247,287,091 $65,819,519 $22,055,994Processing <strong>and</strong> taxidermy costs $391,793,000 $270,106,515 $12,060,052 $6,449,926Books <strong>and</strong> magazines devoted to hunting $124,313,000 $34,945,016 $12,468,260 $3,506,760Dues or contributions $282,846,000 $93,287,050 $74,641,567 $17,597,330Other support items (such as snowshoes, ski, equipment repair, etc.) $97,553,000 $62,216,394 $8,455,570 $1,587,166Bass boat $5,448,000 $0 $996,676 $0Other motor boat $98,542,000 $15,392,235 $11,710,405 $4,433,918Canoe or other non-motor boat $24,670,000 $0 $3,118,201 $0Boat motor, trailer, hitch, or accessories $60,650,000 $2,512,794 $12,879,796 $0Pick-up, camper, van, travel tent trailer, motor home, house trailer $4,246,589,000 $834,183,878 $247,047,964 $96,651,311Cabin $754,034,000 $105,027,734 $83,741,422 $0Off-road vehicle: trail bike, 4x4 vehicle, 4-wheeler, snowmobile, etc. $3,218,532,000 $1,689,579,160 $48,511,537 $64,266,212Other special equipment (ice chests, airplane, etc) $23,095,000 $12,782,266 $837,353 $245,108Licenses, tags, permits <strong>and</strong> other similar fees $693,038,000 $356,691,914 $84,807,477 $87,513,361L<strong>and</strong> owned primarily for hunting, 2001 expenses <strong>and</strong> payments $3,351,389,000 $1,889,658,965 $282,050,289 $363,252,214L<strong>and</strong> leased primarily for hunting, 2001 expenses <strong>and</strong> payments $624,503,000 $453,144,070 $90,013,168 $37,501,021Total $24,708,970,000 $10,673,990,535 $2,674,856,184 $1,854,750,9787
<strong>Economic</strong> <strong>Impact</strong> <strong>of</strong> All <strong>Hunting</strong> Activities, 2001Total Multiplier Salaries Sales <strong>and</strong> State FederalRetail Sales Effect <strong>and</strong> Wages Jobs Motor Fuel Taxes Income Taxes Income TaxesAlabama $799,303,993 $1,576,405,455 $364,648,966 16,871 $31,228,117 $13,593,015 $37,868,855Alaska $248,346,761 $397,077,968 $95,754,092 4,691 $925,655 $0 $9,684,220Arizona $298,419,269 $561,894,450 $136,594,890 5,237 $16,266,426 $3,287,020 $23,296,831Arkansas $520,101,597 $905,815,861 $203,483,807 10,506 $23,139,321 $9,687,635 $20,043,029* California $525,932,593 $1,062,776,490 $264,357,583 8,932 $35,989,912 $12,688,694 $47,464,527Colorado $470,637,986 $951,555,426 $260,194,726 9,862 $16,387,910 $8,368,268 $43,692,743* Connecticut $44,294,220 $76,001,860 $18,231,716 586 $1,848,266 $556,823 $3,358,876* Delaware $14,772,355 $23,145,969 $4,254,956 188 $150,252 $157,793 $639,672Florida $399,119,139 $714,610,292 $180,334,346 7,338 $21,691,959 $0 $28,863,087Georgia $515,992,151 $1,015,485,086 $253,742,459 10,303 $15,201,481 $11,700,925 $40,673,230*Hawaii $16,974,189 $27,830,441 $6,365,560 242 $946,162 $447,388 $1,066,269Idaho $319,067,286 $536,360,001 $125,790,189 6,197 $17,676,032 $4,063,023 $12,687,394Illinois $451,462,287 $949,427,464 $243,446,926 8,438 $23,716,676 $5,366,826 $43,109,812Indiana $276,785,454 $530,440,648 $122,231,233 5,085 $13,108,455 $3,006,079 $19,247,658Iowa $228,024,305 $443,304,732 $101,192,121 4,523 $12,956,316 $5,493,278 $15,049,717Kansas $245,668,336 $488,491,801 $113,173,214 5,408 $14,559,327 $4,284,817 $11,581,486Kentucky $450,465,575 $916,866,556 $195,222,034 8,494 $25,735,350 $10,846,970 $29,691,506Louisiana $581,066,601 $992,471,903 $211,858,208 9,184 $25,325,539 $5,168,016 $32,315,638Maine $196,652,268 $325,627,728 $73,914,792 3,643 $9,347,646 $3,124,673 $7,453,782Maryl<strong>and</strong> $161,375,339 $300,995,052 $69,414,648 2,617 $7,378,111 $2,624,037 $11,695,355Massachusetts $67,507,420 $121,630,601 $30,819,293 973 $3,511,692 $1,486,091 $5,726,096Michigan $671,670,664 $1,281,527,914 $325,888,323 12,144 $38,486,602 $8,816,245 $55,311,742Minnesota $664,200,412 $1,316,964,312 $323,178,837 12,419 $42,862,125 $11,567,030 $53,791,714Mississippi $393,549,827 $733,332,414 $156,760,798 7,444 $27,188,929 $5,567,756 $16,089,174Missouri $437,194,608 $853,390,343 $191,169,148 8,007 $17,786,455 $7,362,338 $29,950,530Montana $250,094,314 $422,980,401 $101,208,129 5,592 $7,189,476 $3,961,108 $9,603,611Nebraska $232,387,841 $411,232,344 $99,640,824 5,005 $12,648,256 $3,850,215 $9,953,717Nevada $156,310,900 $246,730,849 $60,330,517 2,256 $10,024,621 $0 $10,216,438New Hampshire $86,981,254 $154,889,884 $36,413,786 1,429 $826,538 $0 $5,977,886New Jersey $158,692,106 $298,565,998 $71,007,643 2,719 $7,743,486 $1,673,076 $11,846,449New Mexico $196,004,211 $342,455,764 $82,202,479 4,057 $10,311,784 $3,082,134 $8,283,465New York $891,031,344 $1,529,508,716 $340,677,521 11,487 $32,373,967 $10,611,609 $61,235,190North Carolina $458,008,129 $896,002,783 $223,508,461 9,485 $22,228,780 $10,666,001 $34,669,885North Dakota $123,859,833 $214,268,457 $45,365,957 2,252 $7,745,141 $456,150 $4,558,664Ohio $713,886,248 $1,539,487,897 $367,989,800 14,392 $35,957,454 $22,485,423 $60,540,280Oklahoma $292,800,051 $573,214,716 $137,122,217 6,755 $14,496,136 $7,887,812 $13,829,971Oregon $481,813,350 $879,563,630 $200,619,348 8,279 $7,922,109 $15,714,527 $31,781,358Pennsylvania $1,165,059,772 $2,275,366,632 $521,440,650 19,204 $50,870,062 $14,600,338 $89,145,482! Rhode Isl<strong>and</strong> - - - - - - -South Carolina $370,844,792 $712,649,156 $163,340,428 6,981 $19,279,251 $6,302,890 $25,197,657South Dakota $251,243,111 $442,142,629 $109,081,915 5,656 $13,219,926 $0 $10,720,926Tennessee $623,025,977 $1,321,659,467 $307,238,128 11,641 $36,937,656 $0 $51,604,672Texas $1,761,285,042 $3,636,484,738 $864,139,228 31,711 $93,021,192 $0 $148,055,527Utah $331,035,484 $671,442,932 $171,869,263 7,604 $18,693,995 $6,827,855 $18,195,462Vermont $60,848,108 $96,329,197 $21,934,518 1,037 $2,993,986 $541,390 $2,255,790Virginia $391,190,770 $724,962,684 $158,154,598 6,641 $17,122,351 $6,879,162 $24,732,077Washington $424,187,470 $749,632,996 $183,227,869 6,801 $28,045,189 $0 $31,175,763West Virginia $227,593,090 $366,386,409 $74,117,090 3,818 $13,722,778 $2,659,244 $7,309,117Wisconsin $960,104,751 $1,770,420,230 $427,420,204 19,214 $42,258,403 $10,159,876 $44,946,720Wyoming $135,034,776 $224,765,256 $56,550,480 2,996 $6,378,410 $0 $5,494,200United States $24,708,970,000 $67,568,137,514 $16,771,153,961 575,368 $955,425,665 $267,623,550 $2,986,651,410* = small samples size (45 or less)!= sample size too small to report reliably (25 or less)NOTE: The U.S. total does not equal the sum <strong>of</strong> state data as economic activity across state borders are not included in the state totals, in addition to other factors.NOTE: The expenditures reported above are greater than those reported by the U.S. <strong>Fish</strong> <strong>and</strong> <strong>Wildlife</strong> Service. Sportsmen <strong>of</strong>ten attributed purchases to bothfishing <strong>and</strong> hunting (especially vehicles <strong>and</strong> big-ticket items). These items were not included in the Service’s hunting expenditure estimates. Such items wereincluded above by prorating each item’s cost based on each respondent’s total days <strong>of</strong> hunting <strong>and</strong> fishing activity.8
<strong>Economic</strong> <strong>Impact</strong> <strong>of</strong> Deer <strong>Hunting</strong>, 2001Total Multiplier Salaries Sales <strong>and</strong> State FederalRetail Sales Effect <strong>and</strong> Wages Jobs Motor Fuel Taxes Income Taxes Income TaxesAlabama $498,972,354 $957,938,307 $226,773,092 10,960 $19,347,927 $8,324,599 $23,083,163* Alaska $16,526,440 $27,652,891 $6,654,110 304 $39,085 $0 $694,823* Arizona $68,668,302 $131,336,314 $34,816,151 1,438 $3,549,178 $802,006 $5,509,776Arkansas $212,413,838 $383,007,221 $89,285,768 4,363 $11,914,262 $4,310,052 $9,040,878! California - - - - - - -* Colorado $56,580,476 $113,434,884 $28,471,454 1,050 $3,129,281 $923,957 $4,862,725! Connecticut - - - - - - -* Delaware $10,579,823 $16,451,436 $2,826,582 114 $72,637 $108,369 $454,582* Florida $162,743,298 $296,687,222 $75,954,513 3,163 $8,194,646 $0 $11,952,316Georgia $311,598,854 $613,296,550 $156,402,620 6,349 $9,570,072 $7,212,676 $25,073,774!Hawaii - - - - - - -Idaho $108,587,156 $181,628,868 $40,876,616 1,998 $6,029,559 $1,335,034 $4,138,367* Illinois $232,328,693 $477,775,192 $117,466,679 4,026 $10,585,774 $2,600,052 $20,930,113Indiana $177,113,198 $352,716,685 $81,747,967 3,333 $8,252,865 $2,025,830 $13,064,842Iowa $47,562,906 $87,697,324 $22,036,073 1,000 $2,822,892 $1,192,635 $3,233,976Kansas $80,097,623 $153,587,485 $35,606,503 1,733 $4,392,204 $1,332,080 $3,612,796Kentucky $202,452,620 $409,282,198 $86,930,233 3,714 $11,235,278 $4,837,007 $13,414,347Louisiana $185,115,421 $320,956,819 $72,813,871 3,350 $8,747,226 $1,706,638 $10,560,714Maine $98,155,242 $160,046,593 $36,852,957 1,872 $4,618,169 $1,509,350 $3,660,478Maryl<strong>and</strong> $82,325,619 $156,031,398 $37,042,269 1,358 $4,102,355 $1,411,355 $6,351,309* Massachusetts $40,416,961 $73,983,647 $19,232,534 603 $2,006,281 $928,546 $3,586,654Michigan $281,774,267 $506,134,291 $134,709,492 5,386 $15,417,104 $3,497,431 $21,829,356Minnesota $235,768,787 $465,106,329 $122,257,391 4,825 $15,134,840 $4,295,446 $19,989,046Mississippi $241,699,902 $441,442,806 $96,073,748 4,645 $16,389,001 $3,386,893 $9,777,447Missouri $228,156,541 $445,203,660 $98,037,066 4,158 $8,973,428 $3,748,934 $15,212,545Montana $118,240,968 $193,447,268 $43,960,634 2,420 $3,091,283 $1,725,358 $4,180,012Nebraska $36,020,982 $62,457,936 $14,708,337 675 $2,345,215 $598,549 $1,532,734!Nevada - - - - - - -New Hampshire $39,432,538 $67,873,231 $16,507,425 667 $633,552 $0 $2,655,995New Jersey $116,365,125 $216,365,872 $50,611,630 1,897 $5,552,406 $1,193,515 $8,559,892New Mexico $58,967,609 $105,821,959 $26,001,932 1,254 $3,327,850 $988,455 $2,649,782New York $523,449,848 $901,835,139 $207,067,163 6,932 $20,800,327 $6,491,057 $37,360,317North Carolina $311,419,807 $607,062,577 $149,951,934 6,316 $14,989,948 $7,180,490 $23,392,764North Dakota $33,778,413 $57,341,754 $12,975,226 639 $2,065,541 $131,639 $1,309,146Ohio $399,250,756 $861,031,218 $202,119,352 7,733 $18,395,788 $12,366,408 $33,737,026Oklahoma $159,664,457 $305,194,136 $71,514,926 3,523 $7,017,560 $4,113,763 $7,212,620Oregon $152,792,249 $271,060,549 $61,914,519 2,586 $3,985,193 $4,840,902 $9,719,692Pennsylvania $500,957,315 $986,432,766 $232,943,299 8,699 $22,320,738 $6,522,412 $39,485,325! Rhode Isl<strong>and</strong> - - - - - - -South Carolina $190,550,172 $346,549,025 $82,190,167 3,564 $9,794,077 $3,133,512 $12,532,999South Dakota $35,458,014 $62,100,244 $15,704,098 780 $2,207,960 $0 $1,577,098Tennessee $283,004,034 $577,100,885 $133,385,003 5,073 $16,200,250 $0 $22,348,499Texas $989,041,737 $2,019,154,516 $475,345,926 17,907 $49,340,987 $0 $80,132,855Utah $132,093,633 $264,057,217 $66,421,898 2,980 $7,600,503 $2,610,347 $6,990,558Vermont $34,402,565 $56,449,251 $13,350,295 630 $1,676,926 $329,844 $1,374,350Virginia $183,594,199 $337,490,046 $74,638,438 3,192 $7,808,664 $3,227,079 $11,507,332Washington $76,996,949 $139,301,882 $35,996,196 1,357 $5,810,624 $0 $6,064,357West Virginia $145,376,727 $233,146,324 $45,539,039 2,350 $8,446,859 $1,633,539 $4,486,447Wisconsin $534,981,692 $925,777,288 $208,255,175 9,794 $20,657,835 $4,554,418 $21,469,195Wyoming $49,361,129 $81,853,733 $20,405,054 1,109 $2,066,535 $0 $1,954,625United States $10,673,990,535 $27,885,673,982 $6,882,025,422 238,972 $410,660,686 $117,130,178 $1,217,459,816* = small samples size (45 or less)!= sample size too small to report reliably (25 or less)NOTE: The U.S. total does not equal the sum <strong>of</strong> state data as economic activity across state borders are not included in the state totals, in addition to other factors.NOTE: The expenditures reported above are greater than those reported by the U.S. <strong>Fish</strong> <strong>and</strong> <strong>Wildlife</strong> Service. Sportsmen <strong>of</strong>ten attributed purchases to bothfishing <strong>and</strong> hunting (especially vehicles <strong>and</strong> big-ticket items). These items were not included in the Service’s hunting expenditure estimates. Such items wereincluded above by prorating each item’s cost based on each respondent’s total days <strong>of</strong> hunting <strong>and</strong> fishing activity.9
<strong>Economic</strong> <strong>Impact</strong> <strong>of</strong> Migratory Bird <strong>and</strong> Upl<strong>and</strong> Bird <strong>Hunting</strong>, 2001Total Multiplier Salaries Sales <strong>and</strong> State FederalMigratory Bird <strong>Hunting</strong> Retail Sales Effect <strong>and</strong> Wages Jobs Motor Fuel Taxes Income Taxes Income TaxesAlabama $48,007,338 $89,957,697 $22,180,399 1,090 $1,718,001 $809,167 $2,239,411* Alaska $13,096,459 $21,036,584 $4,682,007 223 $59,606 $0 $479,701* Arizona $22,911,714 $43,376,162 $11,643,912 451 $1,363,791 $278,690 $1,927,106Arkansas $154,319,435 $270,286,245 $63,978,610 3,418 $6,884,282 $3,018,305 $6,186,954* Georgia $37,633,444 $78,468,678 $18,486,244 771 $1,397,035 $845,533 $2,905,972* Idaho $17,147,779 $30,597,199 $7,876,955 373 $1,141,734 $268,226 $809,003*Iowa $31,117,872 $59,834,090 $14,621,300 722 $1,735,149 $777,645 $1,981,400Kansas $30,574,329 $62,376,149 $15,569,549 763 $1,731,712 $579,617 $1,574,228* Kentucky $24,242,161 $49,919,103 $11,215,598 540 $1,470,777 $617,904 $1,560,117Louisiana $105,644,001 $192,061,529 $44,633,728 2,047 $4,747,288 $1,048,568 $6,492,589* Minnesota $117,805,141 $251,857,295 $59,259,014 2,347 $7,852,511 $2,076,996 $9,666,244* Mississippi $18,183,730 $32,788,221 $7,145,245 336 $1,284,289 $254,727 $736,445* Missouri $35,219,862 $66,691,082 $15,542,741 656 $1,671,796 $596,112 $2,421,471Nebraska $34,885,935 $62,564,781 $14,954,048 718 $2,001,572 $593,625 $1,527,002*Nevada $38,307,160 $61,528,966 $15,101,250 590 $2,112,502 $0 $2,484,972*New Mexico $14,619,582 $26,506,745 $6,734,903 369 $790,320 $235,767 $642,021North Carolina $46,247,037 $90,933,254 $23,673,334 1,020 $2,104,663 $1,121,446 $3,627,660* North Dakota $28,256,408 $50,768,919 $11,313,302 560 $1,816,072 $114,188 $1,138,796* Oklahoma $27,915,397 $57,026,767 $14,001,370 698 $1,516,214 $803,766 $1,404,041* Oregon $56,868,216 $112,457,220 $27,183,785 1,211 $744,344 $2,104,111 $4,054,635* South Carolina $20,822,426 $37,710,818 $9,282,274 426 $1,010,019 $336,404 $1,348,233South Dakota $44,253,112 $78,847,058 $20,456,400 1,041 $2,278,643 $0 $2,030,488*Tennessee $139,865,819 $318,813,596 $73,039,886 2,696 $8,482,396 $0 $12,470,998Texas $306,956,227 $652,603,285 $163,358,524 5,980 $16,601,024 $0 $28,029,714Utah $41,137,806 $83,507,061 $22,359,696 1,005 $2,378,236 $877,703 $2,351,752*Washington $65,304,639 $120,762,169 $31,360,099 1,189 $3,392,754 $0 $5,264,981United States $2,674,856,184 $7,391,383,699 $1,874,091,622 66,274 $78,286,732 $17,358,499 $328,151,852Upl<strong>and</strong> Bird <strong>Hunting</strong>* Arizona $34,953,681 $65,391,906 $17,213,494 662 $2,162,320 $413,437 $2,872,379Idaho $39,779,969 $66,339,564 $15,015,324 764 $1,979,746 $462,164 $1,490,446Iowa $53,209,171 $96,866,303 $21,409,765 1,010 $3,039,122 $1,149,842 $3,035,220Kansas $121,386,038 $246,923,163 $54,587,840 2,615 $7,668,545 $2,063,357 $5,579,668Maine $23,689,361 $38,558,652 $8,294,026 390 $1,172,532 $366,798 $855,005Minnesota $61,692,387 $121,270,152 $28,342,736 1,079 $4,650,674 $1,020,863 $4,746,388* Montana $16,228,291 $28,754,854 $6,957,424 370 $659,761 $280,166 $674,232Nebraska $54,021,097 $95,460,965 $21,096,077 1,062 $4,002,744 $814,210 $2,105,393*New York $66,500,415 $112,787,333 $22,391,246 762 $2,658,695 $691,470 $4,004,254North Carolina $10,412,012 $20,263,052 $4,925,925 223 $638,382 $227,841 $725,198* Ohio $49,761,090 $93,754,598 $21,603,732 955 $1,573,176 $1,309,612 $3,241,851* Oklahoma $31,690,615 $65,597,728 $15,305,183 790 $1,844,895 $873,056 $1,507,414* Oregon $38,969,168 $74,229,657 $16,990,638 767 $1,123,107 $1,312,361 $2,506,608*Pennsylvania $69,628,647 $142,792,274 $33,873,698 1,326 $3,630,608 $948,464 $5,570,245South Dakota $117,115,384 $209,411,323 $51,121,738 2,800 $6,349,402 $0 $4,874,788*Texas $69,064,704 $137,752,117 $30,832,979 1,209 $1,913,668 $0 $5,063,440Utah $27,187,016 $52,484,015 $12,797,999 585 $1,316,934 $495,705 $1,336,354*Vermont $4,668,188 $7,460,438 $1,607,882 80 $219,949 $38,672 $161,131*Washington $125,103,890 $215,608,855 $44,565,724 1,558 $8,988,047 $0 $7,853,629Wisconsin $93,014,636 $168,290,356 $37,620,658 1,750 $4,804,333 $840,164 $3,897,293United States $1,854,750,978 $4,890,531,443 $1,184,861,158 42,338 $60,396,638 $13,308,182 $206,232,649Upl<strong>and</strong> Birds = quail, pheasant <strong>and</strong> grouse.* = small samples size (45 or less)NOTE: States not listed have sample sizes too small to report reliably (25 or less).NOTE: The U.S. total does not equal the sum <strong>of</strong> state data as economic activity across state borders are not included in the state totals, in addition to other factors.NOTE: The expenditures reported above are greater than those reported by the U.S. <strong>Fish</strong> <strong>and</strong> <strong>Wildlife</strong> Service. Sportsmen <strong>of</strong>ten attributed purchases to bothfishing <strong>and</strong> hunting (especially vehicles <strong>and</strong> big-ticket items). These items were not included in the Service’s hunting expenditure estimates. Such items wereincluded above by prorating each item’s cost based on each respondent’s total days <strong>of</strong> hunting <strong>and</strong> fishing activity.10
<strong>Economic</strong> Contributions Per State From Non-Resident HuntersSales <strong>and</strong> Number <strong>of</strong> Days <strong>of</strong>Total Multiplier Salaries Motor State Federal Visiting <strong>Hunting</strong>Retail Sales Effect <strong>and</strong> Wages Jobs Fuel Taxes Income Taxes Income Taxes Hunters by VisitorsAlabama $85,048,992 $162,612,119 39,412,201 $2,118 $4,204,976 $1,706,652 4754572.125 117,451 1,008,294* Alaska $115,341,699 $195,768,928 53,954,284 $2,817 $265,691 $0 5816068.118 21292.14 193090.17* Arizona $21,911,937 $41,570,349 11,610,485 $512 $701,983 $321,126 2275990.979 26916.31 141560.73Arkansas $144,380,768 $251,710,459 58,162,459 $3,097 $6,257,691 $2,855,578 $5,907,988 127,667 1,440,119* California $17,637,334 $37,250,896 9,834,427 $343 $977,256 $487,209 $1,822,498 12,456 47,808Colorado $227,730,688 $451,196,323 115,866,881 $4,535 $7,616,988 $3,847,915 $20,090,891 121,315 930,457! Connecticut - - - - - - - - -! Delaware - - - - - - - - -* Florida $24,705,194 $44,841,722 12,077,802 $490 $1,568,992 $0 $1,929,001 35,267 189,512* Georgia $77,400,933 $154,326,561 36,328,887 $1,557 $2,103,206 $1,768,819 $6,148,538 61,901 633,394!Hawaii - - - - - - - - -Idaho $87,687,164 $149,368,353 36,824,056 $1,880 $4,466,089 $1,232,967 $3,850,122 46,721 363,390* Illinois $92,276,660 $197,385,887 51,394,205 $2,017 $4,257,425 $1,282,949 $10,305,473 64,062 362,789! Indiana - - - - - - - - -*Iowa $22,773,000 $41,913,977 9,841,834 $463 $1,184,310 $562,116 $1,540,007 52,296 180,658Kansas $67,664,827 $139,494,661 31,916,835 $1,658 $3,845,934 $1,313,542 $3,550,388 103,667 644,668* Kentucky $39,576,775 $74,998,137 15,754,087 $717 $2,414,573 $916,265 $2,508,102 51,150 210,667* Louisiana $26,604,375 $49,201,553 12,168,198 $529 $1,232,236 $297,903 $1,862,789 44,217 396,790Maine $50,312,668 $86,003,585 22,460,637 $1,284 $2,159,945 $1,101,132 $2,626,706 41,423 337,940Maryl<strong>and</strong> $25,778,296 $48,140,622 11,017,320 $428 $1,340,959 $428,980 $1,911,965 29,749 154,202! Massachusetts - - - - - - - - -* Michigan $38,489,240 $72,353,890 18,492,973 $712 $2,271,466 $516,683 $3,241,587 52,812 534,399* Minnesota $52,736,748 $109,072,499 27,850,233 $1,089 $2,540,644 $1,014,242 $4,716,668 28,546 938,452Mississippi $115,778,589 $216,711,194 45,798,776 $2,253 $7,499,614 $1,685,220 $4,869,790 111,443 1,892,497Missouri $72,896,216 $148,094,303 33,650,745 $1,359 $3,187,239 $1,249,412 $5,082,700 83,020 377,708Montana $85,548,991 $156,664,235 40,820,235 $2,471 $2,236,145 $1,750,589 $4,244,260 59,270 389,797* Nebraska $94,512,234 $165,231,487 43,959,446 $2,417 $4,036,396 $1,859,305 $4,806,743 46,911 364,053!Nevada - - - - - - - - -*New Hampshire $29,271,206 $51,499,606 13,074,522 $508 $382,797 $0 $2,125,245 26,174 321,273!New Jersey - - - - - - - - -*New Mexico $30,887,107 $57,523,792 14,788,760 $804 $1,112,412 $610,470 $1,640,684 25,525 146,051New York $46,999,516 $85,675,272 18,765,100 $599 $2,564,626 $553,725 $3,195,320 79,146 390,445* North Carolina $12,085,442 $23,788,105 6,111,032 $263 $589,496 $295,920 $961,889 26,552 197,529* North Dakota $34,237,054 $62,372,473 13,539,888 $690 $2,380,337 $139,830 $1,397,428 52,961 278,817* Ohio $70,239,014 $147,340,640 39,693,927 $1,748 $3,292,149 $2,730,295 $7,351,111 37,931 281,550* Oklahoma $6,868,152 $14,184,773 3,487,217 $183 $353,407 $213,307 $373,999 19,669 96,115* Oregon $21,515,132 $39,259,400 10,251,143 $551 $487,246 $1,045,523 $2,114,486 14,595 135,317Pennsylvania $269,277,160 $488,494,521 98,804,155 $3,724 $6,364,755 $2,831,628 $17,289,110 142,208 992,560! Rhode Isl<strong>and</strong> - - - - - - - - -* South Carolina $54,099,366 $92,009,029 19,387,606 $897 $2,422,573 $809,763 $3,237,265 40,704 238,471South Dakota $143,070,069 $254,637,546 65,180,182 $3,471 $7,240,365 $0 $6,580,194 118,840 1,251,960Tennessee $68,368,733 $146,285,282 33,365,673 $1,241 $4,667,143 $0 $5,502,876 74,824 616,802Texas $156,752,884 $318,400,081 76,613,589 $3,101 $5,545,460 $0 $14,479,003 97,977 642,105* Utah $26,526,944 $53,704,023 13,803,039 $681 $1,690,088 $611,197 $1,628,770 22,667 125,843*Vermont $12,301,332 $20,413,029 4,512,729 $229 $575,965 $119,649 $498,539 25,601 190,214*Virginia $38,479,516 $73,639,197 16,540,370 $765 $1,644,949 $792,743 $2,850,083 75,346 442,810!Washington - - - - - - - - -*West Virginia $46,523,130 $79,122,691 15,992,614 $852 $3,026,815 $593,425 $1,631,070 57,586 565,949*Wisconsin $265,819,109 $503,281,377 119,364,580 $5,400 $9,171,422 $2,855,328 $12,631,811 72,162 655,057Wyoming $70,719,571 $118,637,482 28,949,683 $1,576 $3,196,590 $0 $2,890,805 68,219 498,399United States $3,183,973,725 $8,434,976,795 $2,142,954,393 78,230 $123,078,354 $40,401,408 $406,079,284 2,029,000 20,672,000* = small samples size (45 or less)!= sample size too small to report reliably (25 or less)NOTE: The U.S. total does not equal the sum <strong>of</strong> state data as economic activity across state borders are not included in the state totals, in addition to other factors.NOTE: The expenditures reported above are greater than those reported by the U.S. <strong>Fish</strong> <strong>and</strong> <strong>Wildlife</strong> Service. Sportsmen <strong>of</strong>ten attributed purchases to bothfishing <strong>and</strong> hunting (especially vehicles <strong>and</strong> big-ticket items). These items were not included in the Service’s hunting expenditure estimates. Such items wereincluded above by prorating each item’s cost based on each respondent’s total days <strong>of</strong> hunting <strong>and</strong> fishing activity.11
International <strong>Association</strong> <strong>of</strong> <strong>Fish</strong> <strong>and</strong> <strong>Wildlife</strong> <strong>Agencies</strong>444 North Capitol Street, NW, Suite 544Washington, DC 20001www.iafwa.org202-624-7890 · 202-624-7891 faxThis hunting economic impact study wasproduced by Southwick Associates, Inc,Fern<strong>and</strong>ina Beach, FL with help fromMark LaBarbera <strong>and</strong> the OutdoorHeritage Education Center, Shakopee,MN. Funding was provided by theInternational <strong>Association</strong> <strong>of</strong> <strong>Fish</strong> <strong>and</strong><strong>Wildlife</strong> <strong>Agencies</strong>’ Animal Use IssuesCommittee through the U.S. <strong>Fish</strong> <strong>and</strong><strong>Wildlife</strong> Service under CooperativeGrant Agreement No. DC N-10-RO usingFederal Aid in <strong>Wildlife</strong> Restorationadministrative funds.Photo ©/credits: Mark LaBarbera, Nikon/ChevalierAdvertising, Outdoor Heritage Education Center©2002 IAFWA, Washington, DC