Hunting Economic Impact - Association of Fish and Wildlife Agencies
Hunting Economic Impact - Association of Fish and Wildlife Agencies
Hunting Economic Impact - Association of Fish and Wildlife Agencies
- No tags were found...

You also want an ePaper? Increase the reach of your titles
YUMPU automatically turns print PDFs into web optimized ePapers that Google loves.
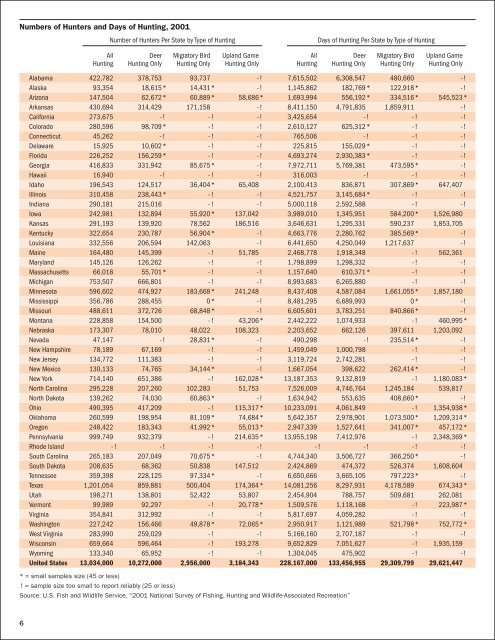
Numbers <strong>of</strong> Hunters <strong>and</strong> Days <strong>of</strong> <strong>Hunting</strong>, 2001Number <strong>of</strong> Hunters Per State by Type <strong>of</strong> <strong>Hunting</strong>Days <strong>of</strong> <strong>Hunting</strong> Per State by Type <strong>of</strong> <strong>Hunting</strong>All Deer Migratory Bird Upl<strong>and</strong> Game All Deer Migratory Bird Upl<strong>and</strong> Game<strong>Hunting</strong> <strong>Hunting</strong> Only <strong>Hunting</strong> Only <strong>Hunting</strong> Only <strong>Hunting</strong> <strong>Hunting</strong> Only <strong>Hunting</strong> Only <strong>Hunting</strong> OnlyAlabama 422,782 378,753 93,737 -! 7,615,502 6,308,547 480,660 -!Alaska 93,354 18,615* 14,431* -! 1,145,862 182,769* 122,918* -!Arizona 147,504 62,672* 60,889* 58,686* 1,693,994 556,192* 334,516* 545,523*Arkansas 430,694 314,429 171,158 -! 8,411,150 4,791,835 1,859,911 -!California 273,675 -! -! -! 3,425,654 -! -! -!Colorado 280,596 98,709* -! -! 2,610,127 625,312* -! -!Connecticut 45,262 -! -! -! 765,506 -! -! -!Delaware 15,925 10,602* -! -! 225,815 155,029* -! -!Florida 226,252 156,259* -! -! 4,693,274 2,930,383* -! -!Georgia 416,833 331,942 85,675* -! 7,972,711 5,769,381 473,595* -!Hawaii 16,940 -! -! -! 316,003 -! -! -!Idaho 196,543 124,517 36,404* 65,408 2,100,413 836,871 307,869* 647,407Illinois 310,458 238,443* -! -! 4,521,757 3,145,684* -! -!Indiana 290,181 215,016 -! -! 5,000,118 2,592,588 -! -!Iowa 242,981 132,894 55,920* 137,042 3,989,010 1,345,951 584,200* 1,526,980Kansas 291,193 139,920 78,562 186,516 3,646,631 1,295,331 590,237 1,853,705Kentucky 322,654 230,787 56,904* -! 4,663,776 2,280,762 385,569* -!Louisiana 332,556 206,594 142,063 -! 6,441,650 4,250,049 1,217,637 -!Maine 164,480 145,399 -! 51,785 2,468,778 1,918,348 -! 562,361Maryl<strong>and</strong> 145,126 126,262 -! -! 1,798,899 1,298,332 -! -!Massachusetts 66,018 55,701* -! -! 1,157,640 610,371* -! -!Michigan 753,507 666,801 -! -! 8,993,683 6,265,880 -! -!Minnesota 596,602 474,927 183,668* 241,248 8,437,408 4,587,084 1,661,055* 1,857,180Mississippi 356,786 288,455 0* -! 8,481,295 6,689,993 0* -!Missouri 488,611 372,726 68,848* -! 6,605,601 3,783,251 840,866* -!Montana 228,858 154,500 -! 43,206* 2,442,222 1,074,933 -! 460,995*Nebraska 173,307 78,010 48,022 108,323 2,203,652 662,126 397,611 1,203,092Nevada 47,147 -! 28,831* -! 490,298 -! 235,514* -!New Hampshire 78,189 67,169 -! -! 1,459,049 1,000,798 -! -!New Jersey 134,772 111,383 -! -! 3,119,724 2,742,281 -! -!New Mexico 130,133 74,765 34,144* -! 1,667,054 398,622 262,414* -!New York 714,140 651,386 -! 162,028* 13,187,353 9,132,819 -! 1,180,083*North Carolina 295,228 207,260 102,283 51,753 7,526,009 4,746,764 1,245,184 539,817North Dakota 139,262 74,030 60,863* -! 1,634,942 553,635 408,660* -!Ohio 490,395 417,209 -! 115,317* 10,233,091 4,061,849 -! 1,354,938*Oklahoma 260,599 198,954 81,109* 74,684* 5,642,357 2,978,901 1,073,500* 1,209,314*Oregon 248,422 183,343 41,992* 55,013* 2,947,339 1,527,641 341,007* 457,172*Pennsylvania 999,749 932,379 -! 214,635* 13,955,198 7,412,976 -! 2,348,369*Rhode Isl<strong>and</strong> -! -! -! -! -! -! -! -!South Carolina 265,183 207,049 70,675* -! 4,744,340 3,506,727 366,250* -!South Dakota 208,635 68,362 50,838 147,512 2,424,869 474,372 526,374 1,608,604Tennessee 359,398 228,125 97,334* -! 6,650,666 3,665,105 797,223* -!Texas 1,201,054 859,881 500,404 174,364* 14,081,256 8,297,931 4,178,589 674,343*Utah 198,271 138,801 52,422 53,807 2,454,904 788,757 509,681 262,081Vermont 99,989 92,297 -! 20,778* 1,509,576 1,118,168 -! 223,987*Virginia 354,841 312,992 -! -! 5,817,697 4,059,282 -! -!Washington 227,242 156,466 49,878* 72,065* 2,950,917 1,121,989 521,798* 752,772*West Virginia 283,990 259,029 -! -! 5,166,160 2,707,187 -! -!Wisconsin 659,664 596,464 -! 193,278 9,652,829 7,051,627 -! 1,935,159Wyoming 133,340 65,952 -! -! 1,304,045 475,902 -! -!United States 13,034,000 10,272,000 2,956,000 3,184,343 228,167,000 133,456,955 29,309,799 29,621,447* = small samples size (45 or less)!= sample size too small to report reliably (25 or less)Source: U.S. <strong>Fish</strong> <strong>and</strong> <strong>Wildlife</strong> Service, “2001 National Survey <strong>of</strong> <strong>Fish</strong>ing, <strong>Hunting</strong> <strong>and</strong> <strong>Wildlife</strong>-Associated Recreation”6