Hunting Economic Impact - Association of Fish and Wildlife Agencies
Hunting Economic Impact - Association of Fish and Wildlife Agencies
Hunting Economic Impact - Association of Fish and Wildlife Agencies
- No tags were found...

Create successful ePaper yourself
Turn your PDF publications into a flip-book with our unique Google optimized e-Paper software.
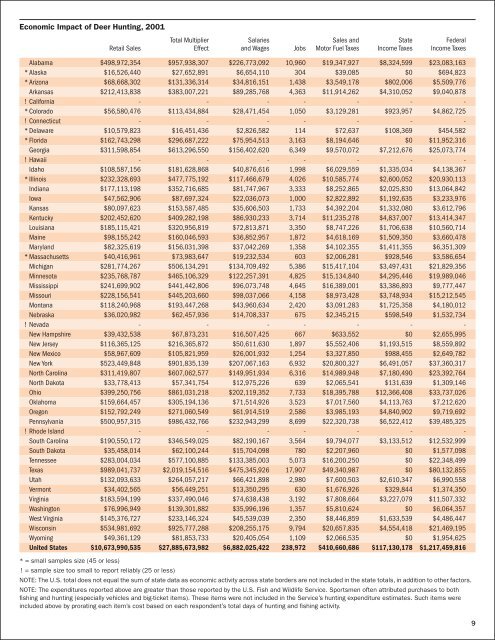
<strong>Economic</strong> <strong>Impact</strong> <strong>of</strong> Deer <strong>Hunting</strong>, 2001Total Multiplier Salaries Sales <strong>and</strong> State FederalRetail Sales Effect <strong>and</strong> Wages Jobs Motor Fuel Taxes Income Taxes Income TaxesAlabama $498,972,354 $957,938,307 $226,773,092 10,960 $19,347,927 $8,324,599 $23,083,163* Alaska $16,526,440 $27,652,891 $6,654,110 304 $39,085 $0 $694,823* Arizona $68,668,302 $131,336,314 $34,816,151 1,438 $3,549,178 $802,006 $5,509,776Arkansas $212,413,838 $383,007,221 $89,285,768 4,363 $11,914,262 $4,310,052 $9,040,878! California - - - - - - -* Colorado $56,580,476 $113,434,884 $28,471,454 1,050 $3,129,281 $923,957 $4,862,725! Connecticut - - - - - - -* Delaware $10,579,823 $16,451,436 $2,826,582 114 $72,637 $108,369 $454,582* Florida $162,743,298 $296,687,222 $75,954,513 3,163 $8,194,646 $0 $11,952,316Georgia $311,598,854 $613,296,550 $156,402,620 6,349 $9,570,072 $7,212,676 $25,073,774!Hawaii - - - - - - -Idaho $108,587,156 $181,628,868 $40,876,616 1,998 $6,029,559 $1,335,034 $4,138,367* Illinois $232,328,693 $477,775,192 $117,466,679 4,026 $10,585,774 $2,600,052 $20,930,113Indiana $177,113,198 $352,716,685 $81,747,967 3,333 $8,252,865 $2,025,830 $13,064,842Iowa $47,562,906 $87,697,324 $22,036,073 1,000 $2,822,892 $1,192,635 $3,233,976Kansas $80,097,623 $153,587,485 $35,606,503 1,733 $4,392,204 $1,332,080 $3,612,796Kentucky $202,452,620 $409,282,198 $86,930,233 3,714 $11,235,278 $4,837,007 $13,414,347Louisiana $185,115,421 $320,956,819 $72,813,871 3,350 $8,747,226 $1,706,638 $10,560,714Maine $98,155,242 $160,046,593 $36,852,957 1,872 $4,618,169 $1,509,350 $3,660,478Maryl<strong>and</strong> $82,325,619 $156,031,398 $37,042,269 1,358 $4,102,355 $1,411,355 $6,351,309* Massachusetts $40,416,961 $73,983,647 $19,232,534 603 $2,006,281 $928,546 $3,586,654Michigan $281,774,267 $506,134,291 $134,709,492 5,386 $15,417,104 $3,497,431 $21,829,356Minnesota $235,768,787 $465,106,329 $122,257,391 4,825 $15,134,840 $4,295,446 $19,989,046Mississippi $241,699,902 $441,442,806 $96,073,748 4,645 $16,389,001 $3,386,893 $9,777,447Missouri $228,156,541 $445,203,660 $98,037,066 4,158 $8,973,428 $3,748,934 $15,212,545Montana $118,240,968 $193,447,268 $43,960,634 2,420 $3,091,283 $1,725,358 $4,180,012Nebraska $36,020,982 $62,457,936 $14,708,337 675 $2,345,215 $598,549 $1,532,734!Nevada - - - - - - -New Hampshire $39,432,538 $67,873,231 $16,507,425 667 $633,552 $0 $2,655,995New Jersey $116,365,125 $216,365,872 $50,611,630 1,897 $5,552,406 $1,193,515 $8,559,892New Mexico $58,967,609 $105,821,959 $26,001,932 1,254 $3,327,850 $988,455 $2,649,782New York $523,449,848 $901,835,139 $207,067,163 6,932 $20,800,327 $6,491,057 $37,360,317North Carolina $311,419,807 $607,062,577 $149,951,934 6,316 $14,989,948 $7,180,490 $23,392,764North Dakota $33,778,413 $57,341,754 $12,975,226 639 $2,065,541 $131,639 $1,309,146Ohio $399,250,756 $861,031,218 $202,119,352 7,733 $18,395,788 $12,366,408 $33,737,026Oklahoma $159,664,457 $305,194,136 $71,514,926 3,523 $7,017,560 $4,113,763 $7,212,620Oregon $152,792,249 $271,060,549 $61,914,519 2,586 $3,985,193 $4,840,902 $9,719,692Pennsylvania $500,957,315 $986,432,766 $232,943,299 8,699 $22,320,738 $6,522,412 $39,485,325! Rhode Isl<strong>and</strong> - - - - - - -South Carolina $190,550,172 $346,549,025 $82,190,167 3,564 $9,794,077 $3,133,512 $12,532,999South Dakota $35,458,014 $62,100,244 $15,704,098 780 $2,207,960 $0 $1,577,098Tennessee $283,004,034 $577,100,885 $133,385,003 5,073 $16,200,250 $0 $22,348,499Texas $989,041,737 $2,019,154,516 $475,345,926 17,907 $49,340,987 $0 $80,132,855Utah $132,093,633 $264,057,217 $66,421,898 2,980 $7,600,503 $2,610,347 $6,990,558Vermont $34,402,565 $56,449,251 $13,350,295 630 $1,676,926 $329,844 $1,374,350Virginia $183,594,199 $337,490,046 $74,638,438 3,192 $7,808,664 $3,227,079 $11,507,332Washington $76,996,949 $139,301,882 $35,996,196 1,357 $5,810,624 $0 $6,064,357West Virginia $145,376,727 $233,146,324 $45,539,039 2,350 $8,446,859 $1,633,539 $4,486,447Wisconsin $534,981,692 $925,777,288 $208,255,175 9,794 $20,657,835 $4,554,418 $21,469,195Wyoming $49,361,129 $81,853,733 $20,405,054 1,109 $2,066,535 $0 $1,954,625United States $10,673,990,535 $27,885,673,982 $6,882,025,422 238,972 $410,660,686 $117,130,178 $1,217,459,816* = small samples size (45 or less)!= sample size too small to report reliably (25 or less)NOTE: The U.S. total does not equal the sum <strong>of</strong> state data as economic activity across state borders are not included in the state totals, in addition to other factors.NOTE: The expenditures reported above are greater than those reported by the U.S. <strong>Fish</strong> <strong>and</strong> <strong>Wildlife</strong> Service. Sportsmen <strong>of</strong>ten attributed purchases to bothfishing <strong>and</strong> hunting (especially vehicles <strong>and</strong> big-ticket items). These items were not included in the Service’s hunting expenditure estimates. Such items wereincluded above by prorating each item’s cost based on each respondent’s total days <strong>of</strong> hunting <strong>and</strong> fishing activity.9