Hunting Economic Impact - Association of Fish and Wildlife Agencies
Hunting Economic Impact - Association of Fish and Wildlife Agencies
Hunting Economic Impact - Association of Fish and Wildlife Agencies
- No tags were found...

You also want an ePaper? Increase the reach of your titles
YUMPU automatically turns print PDFs into web optimized ePapers that Google loves.
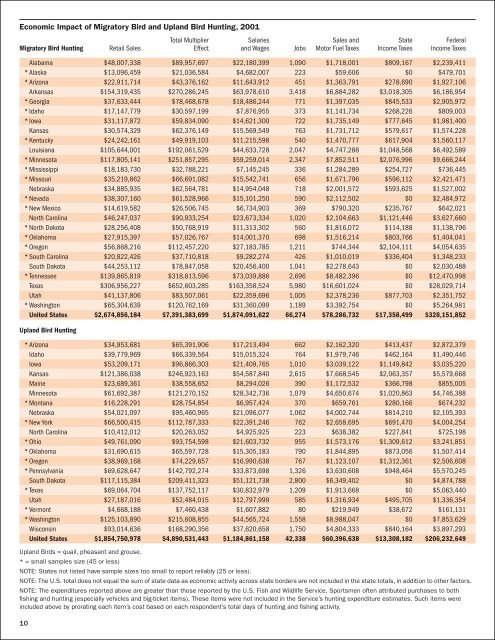
<strong>Economic</strong> <strong>Impact</strong> <strong>of</strong> Migratory Bird <strong>and</strong> Upl<strong>and</strong> Bird <strong>Hunting</strong>, 2001Total Multiplier Salaries Sales <strong>and</strong> State FederalMigratory Bird <strong>Hunting</strong> Retail Sales Effect <strong>and</strong> Wages Jobs Motor Fuel Taxes Income Taxes Income TaxesAlabama $48,007,338 $89,957,697 $22,180,399 1,090 $1,718,001 $809,167 $2,239,411* Alaska $13,096,459 $21,036,584 $4,682,007 223 $59,606 $0 $479,701* Arizona $22,911,714 $43,376,162 $11,643,912 451 $1,363,791 $278,690 $1,927,106Arkansas $154,319,435 $270,286,245 $63,978,610 3,418 $6,884,282 $3,018,305 $6,186,954* Georgia $37,633,444 $78,468,678 $18,486,244 771 $1,397,035 $845,533 $2,905,972* Idaho $17,147,779 $30,597,199 $7,876,955 373 $1,141,734 $268,226 $809,003*Iowa $31,117,872 $59,834,090 $14,621,300 722 $1,735,149 $777,645 $1,981,400Kansas $30,574,329 $62,376,149 $15,569,549 763 $1,731,712 $579,617 $1,574,228* Kentucky $24,242,161 $49,919,103 $11,215,598 540 $1,470,777 $617,904 $1,560,117Louisiana $105,644,001 $192,061,529 $44,633,728 2,047 $4,747,288 $1,048,568 $6,492,589* Minnesota $117,805,141 $251,857,295 $59,259,014 2,347 $7,852,511 $2,076,996 $9,666,244* Mississippi $18,183,730 $32,788,221 $7,145,245 336 $1,284,289 $254,727 $736,445* Missouri $35,219,862 $66,691,082 $15,542,741 656 $1,671,796 $596,112 $2,421,471Nebraska $34,885,935 $62,564,781 $14,954,048 718 $2,001,572 $593,625 $1,527,002*Nevada $38,307,160 $61,528,966 $15,101,250 590 $2,112,502 $0 $2,484,972*New Mexico $14,619,582 $26,506,745 $6,734,903 369 $790,320 $235,767 $642,021North Carolina $46,247,037 $90,933,254 $23,673,334 1,020 $2,104,663 $1,121,446 $3,627,660* North Dakota $28,256,408 $50,768,919 $11,313,302 560 $1,816,072 $114,188 $1,138,796* Oklahoma $27,915,397 $57,026,767 $14,001,370 698 $1,516,214 $803,766 $1,404,041* Oregon $56,868,216 $112,457,220 $27,183,785 1,211 $744,344 $2,104,111 $4,054,635* South Carolina $20,822,426 $37,710,818 $9,282,274 426 $1,010,019 $336,404 $1,348,233South Dakota $44,253,112 $78,847,058 $20,456,400 1,041 $2,278,643 $0 $2,030,488*Tennessee $139,865,819 $318,813,596 $73,039,886 2,696 $8,482,396 $0 $12,470,998Texas $306,956,227 $652,603,285 $163,358,524 5,980 $16,601,024 $0 $28,029,714Utah $41,137,806 $83,507,061 $22,359,696 1,005 $2,378,236 $877,703 $2,351,752*Washington $65,304,639 $120,762,169 $31,360,099 1,189 $3,392,754 $0 $5,264,981United States $2,674,856,184 $7,391,383,699 $1,874,091,622 66,274 $78,286,732 $17,358,499 $328,151,852Upl<strong>and</strong> Bird <strong>Hunting</strong>* Arizona $34,953,681 $65,391,906 $17,213,494 662 $2,162,320 $413,437 $2,872,379Idaho $39,779,969 $66,339,564 $15,015,324 764 $1,979,746 $462,164 $1,490,446Iowa $53,209,171 $96,866,303 $21,409,765 1,010 $3,039,122 $1,149,842 $3,035,220Kansas $121,386,038 $246,923,163 $54,587,840 2,615 $7,668,545 $2,063,357 $5,579,668Maine $23,689,361 $38,558,652 $8,294,026 390 $1,172,532 $366,798 $855,005Minnesota $61,692,387 $121,270,152 $28,342,736 1,079 $4,650,674 $1,020,863 $4,746,388* Montana $16,228,291 $28,754,854 $6,957,424 370 $659,761 $280,166 $674,232Nebraska $54,021,097 $95,460,965 $21,096,077 1,062 $4,002,744 $814,210 $2,105,393*New York $66,500,415 $112,787,333 $22,391,246 762 $2,658,695 $691,470 $4,004,254North Carolina $10,412,012 $20,263,052 $4,925,925 223 $638,382 $227,841 $725,198* Ohio $49,761,090 $93,754,598 $21,603,732 955 $1,573,176 $1,309,612 $3,241,851* Oklahoma $31,690,615 $65,597,728 $15,305,183 790 $1,844,895 $873,056 $1,507,414* Oregon $38,969,168 $74,229,657 $16,990,638 767 $1,123,107 $1,312,361 $2,506,608*Pennsylvania $69,628,647 $142,792,274 $33,873,698 1,326 $3,630,608 $948,464 $5,570,245South Dakota $117,115,384 $209,411,323 $51,121,738 2,800 $6,349,402 $0 $4,874,788*Texas $69,064,704 $137,752,117 $30,832,979 1,209 $1,913,668 $0 $5,063,440Utah $27,187,016 $52,484,015 $12,797,999 585 $1,316,934 $495,705 $1,336,354*Vermont $4,668,188 $7,460,438 $1,607,882 80 $219,949 $38,672 $161,131*Washington $125,103,890 $215,608,855 $44,565,724 1,558 $8,988,047 $0 $7,853,629Wisconsin $93,014,636 $168,290,356 $37,620,658 1,750 $4,804,333 $840,164 $3,897,293United States $1,854,750,978 $4,890,531,443 $1,184,861,158 42,338 $60,396,638 $13,308,182 $206,232,649Upl<strong>and</strong> Birds = quail, pheasant <strong>and</strong> grouse.* = small samples size (45 or less)NOTE: States not listed have sample sizes too small to report reliably (25 or less).NOTE: The U.S. total does not equal the sum <strong>of</strong> state data as economic activity across state borders are not included in the state totals, in addition to other factors.NOTE: The expenditures reported above are greater than those reported by the U.S. <strong>Fish</strong> <strong>and</strong> <strong>Wildlife</strong> Service. Sportsmen <strong>of</strong>ten attributed purchases to bothfishing <strong>and</strong> hunting (especially vehicles <strong>and</strong> big-ticket items). These items were not included in the Service’s hunting expenditure estimates. Such items wereincluded above by prorating each item’s cost based on each respondent’s total days <strong>of</strong> hunting <strong>and</strong> fishing activity.10