View PowerPoint Presentation - Vision Research Coordinating Center
View PowerPoint Presentation - Vision Research Coordinating Center
View PowerPoint Presentation - Vision Research Coordinating Center

You also want an ePaper? Increase the reach of your titles
YUMPU automatically turns print PDFs into web optimized ePapers that Google loves.
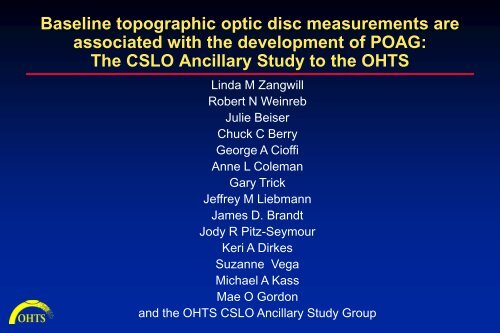
Baseline topographic optic disc measurements are<br />
associated with the development of POAG:<br />
The CSLO Ancillary Study to the OHTS<br />
Linda M Zangwill<br />
Robert N Weinreb<br />
Julie Beiser<br />
Chuck C Berry<br />
George A Cioffi<br />
Anne L Coleman<br />
Gary Trick<br />
Jeffrey M Liebmann<br />
James D. Brandt<br />
Jody R Pitz-Seymour<br />
Keri A Dirkes<br />
Suzanne Vega<br />
Michael A Kass<br />
Mae O Gordon<br />
and the OHTS CSLO Ancillary Study Group
Grant Support<br />
NEI EY11158<br />
NEI EY09341 and EY09307<br />
and the National <strong>Center</strong> on<br />
Minority Health and Health<br />
Disparities,<br />
Merck <strong>Research</strong> Laboratories<br />
Unrestricted grants from<br />
<strong>Research</strong> to Prevent Blindness<br />
Financial Disclosures<br />
Linda M Zangwill: (F) Heidelberg Engineering, Carl Zeiss Meditec<br />
Robert N Weinreb: (F) Heidelberg Engineering, Carl Zeiss Meditec<br />
Julie Beiser: None<br />
Chuck C Berry: None<br />
George A Cioffi: None<br />
Anne L Coleman: None<br />
Gary Trick: (C,R) Heidelberg Engineering<br />
Jeffrey M Liebmann: (F,C) Heidelberg Engineering<br />
James D. Brandt: None<br />
Jody R Pitz-Seymour: None<br />
Keri A Dirkes: None<br />
Suzanne Vega: None<br />
Michael A Kass: None<br />
Mae O Gordon: None
CSLO Ancillary Study to the OHTS<br />
Objectives:<br />
• To determine the effectiveness of HRT to objectively and<br />
quantitatively detect glaucomatous changes of the optic<br />
disc in ocular hypertensive patients<br />
• To describe racial differences in optic disc topography in<br />
ocular hypertensive patients<br />
• To assess the effect of ocular hypotensive treatment on<br />
optic disc topography<br />
• To determine whether optic disk topographic<br />
measurements are an accurate predictor of glaucoma
CSLO Ancillary Study:<br />
7of the 22 OHTS Study <strong>Center</strong>s Participating<br />
• Devers Eye Institute<br />
– PI: Jack A. Cioffi, MD<br />
– Coordinator: Kathryn Sherman<br />
• Henry Ford Medical <strong>Center</strong><br />
– PI: Gary Trick, PhD<br />
– Coordinator: Melanie Gutowski<br />
• Jules Stein Eye Institute, UCLA<br />
– PI: Anne L. Coleman, MD, PhD<br />
– Coordinators: Tina Gonzales, Jackie<br />
Sanguinet<br />
• New York Eye and Ear Infirmary<br />
– PI: Jeffrey M. Liebmann, MD<br />
– Coordinator: Jean Walker<br />
• Scheie Eye Institute, U. of Pennsylvania<br />
– PI: Jody R. Piltz-Seymour, MD<br />
– Coordinator: Jane Anderson<br />
• University of California-Davis,<br />
– PI: James D. Brandt, MD<br />
– Coordinators: Ingrid Clark, Vickie Jaicheum<br />
• University of California-San Diego<br />
– PI: Robert N. Weinreb MD<br />
– Rigby Slight, MD<br />
– Coordinators: Valerie Lepper, R.N.<br />
Eva Kroneker, Rivak Hoffman
UCSD CSLO Reading <strong>Center</strong><br />
Robert N. Weinreb, MD, Primary Investigator<br />
Linda M. Zangwill, PhD, Co-investigator<br />
Chuck C Berry, PhD, Biostatistician<br />
Keri L. Dirkes, MPH, Supervisor<br />
Suzanne Vega, MPH, Coordinator<br />
Amanda Policastro, Coordinator<br />
Amanda R. Smith, MPH, Coordinator<br />
Michelle Cambou, MPH , Coordinator<br />
Chris Asvar , Coordinator<br />
Isabela Niculae, MPH , Coordinator
Image Acquisition Methods<br />
• Heidelberg Retina Tomograph (HRT1) images<br />
acquired annually at dilated exam<br />
• Both eyes: 10-degree field of view images<br />
• OD: An additional 15 degree field of view<br />
• 3 scans taken for each field of view<br />
• K-values used to correct for magnification error<br />
• Image series exported to CSLO Reading <strong>Center</strong><br />
• No processing at study centers
Standardized, centralized image<br />
processing at CSLO Reading <strong>Center</strong><br />
(UC San Diego)<br />
Quality Assurance<br />
• Data Completeness<br />
• Image Quality<br />
• Only Certified Operators Acquire Images<br />
Image Processing<br />
• Creation of Mean Topographies<br />
• Outlining of Disc Margin<br />
• Exporting Data to OHTS Data <strong>Coordinating</strong> <strong>Center</strong>
CSLO OHTS Ancillary Study Participants<br />
Demographic Characteristics<br />
African-American Other Total<br />
Number of subjects* 75 (17%) 376 (83%) 451<br />
Gender (% male) 29% 45% 42%<br />
Mean Age (years) 54.4 8.5 54.4 9.4 54.4 9.3<br />
* With informed consent
CSLO Ancillary<br />
Study to the OHTS<br />
Conclusions<br />
• HRT topographic measurements are strongly correlated<br />
with stereophotographic assessment of horizontal and<br />
vertical cup disc ratios - even in OHTS participants with<br />
normal appearing optic discs<br />
• These results suggest that the HRT optic disc<br />
measurements describe features that are reflected in<br />
standardized assessment of cup-to-disk diameter ratios<br />
from stereophotographs<br />
AJO 2004;137:219-227
CSLO Ancillary<br />
Study to the OHTS<br />
Conclusions<br />
Arch Ophthalmol<br />
2004;122:22-28<br />
• African-Americans have significantly larger optic discs, cups, neuroretinal<br />
rims and cup-to-disc ratios, and smaller rim-to-disc ratios than other OHTS<br />
CSLO Ancillary Study participants<br />
• After adjusting for the difference in disc area, none of the differences in optic<br />
disc topography between African-Americans and other participants remained<br />
statistically significant<br />
• These results highlight the need to consider race and optic disc size when<br />
evaluating the appearance of the optic disc in glaucoma
Racial Differences in Optic Disc Area<br />
(both eyes)<br />
3<br />
2<br />
1<br />
Other<br />
(N=725)<br />
p=
Univariate Results:<br />
Racial Differences in Optic Disc Topopgraphy<br />
African Americans had larger:<br />
• Disc area<br />
• Cup area, volume and depth<br />
• Rim area and volume<br />
• RNFL cross-sectional area<br />
African Americans had smaller:<br />
• Rim to disc ratios
African American Eye<br />
Disc area: 2.2 mm 2<br />
Cup area: 0.9 mm 2<br />
Rim area: 1.4 mm 2<br />
Rim/Disc area: 0.6<br />
Caucasian Eye<br />
Disc area: 1.9 mm 2<br />
Cup area: 0.4 mm 2<br />
Rim area: 1.5 mm 2<br />
Rim/Disc area: 0.8
AreaBRefG<br />
2<br />
1<br />
0<br />
p
0.9<br />
0.8<br />
0.7<br />
0.6<br />
0.5<br />
0.4<br />
0.3<br />
0.2<br />
0.1<br />
0<br />
p
mm2<br />
0.9<br />
0.8<br />
0.7<br />
0.6<br />
0.5<br />
0.4<br />
0.3<br />
0.2<br />
0.1<br />
0<br />
p Median<br />
(n=434)<br />
African American<br />
Other
Multivariate Results:<br />
Racial Differences are no Longer Statistically Significant<br />
(P-Values Adjusted for optic disc area, IOP, first study visit and age)<br />
mm2<br />
0.8<br />
0.7<br />
0.6<br />
0.5<br />
0.4<br />
0.3<br />
0.2<br />
0.1<br />
0<br />
p=.39<br />
p=.5<br />
p=.49<br />
Cup Area Mean Cup Depth Cup Volume<br />
African American<br />
Other
Objective:<br />
• To determine whether baseline confocal<br />
scanning laser ophthalmoscopy (CSLO) optic<br />
disc topographic measurements are associated<br />
with the development of primary open angle<br />
glaucoma (POAG) in ocular hypertension.
Risk Factor versus Predictive Factor<br />
• Epidemiologists differentiate between risk factors<br />
and early damage<br />
• Structural and functional indices of glaucoma may<br />
be predictive factors but are not risk factors
Optic Disc Parameters Evaluated Included<br />
• Disc Area<br />
• Cup Area<br />
• Cup/Disc Area Ratio<br />
• Cup Volume<br />
• Cup Shape<br />
• Rim Area<br />
• Rim/Disc Area Ratio<br />
• Rim Volume<br />
• Cup Depth<br />
• RNFL Thickness<br />
• RNFL Cross-sectional Area<br />
• Mean Height Contour
Optic Disc Parameters Indices Included<br />
(Outside normal limits or within normal limits compared to<br />
normative data)<br />
HRT Classification (linear discriminant function)<br />
Moorfields Regression Analysis<br />
• Global<br />
• Six regions<br />
• Overall (If any of the six regions or global is outside normal limits)
Moorfields Regression Analysis<br />
Measured rim area compared to predicted age-corrected rim area,<br />
adjusted for disc area<br />
within normal limits (WNL)<br />
Classified as:<br />
outside normal limits (ONL)
Moorfields Regression Analyses<br />
Outside Normal Limits
Moorfields Regression Analyses<br />
Outside Normal Limits<br />
Borderline: Considered WNL for this analysis
Sample HRT Data from OHTS CSLO<br />
Ancillary Study Patient
OHTS POAG Endpoints<br />
• 2 consecutive optic disc endpoints (Optic Disc Reading <strong>Center</strong>)<br />
OR<br />
• 3 consecutive visual field endpoints (Visual Field Reading <strong>Center</strong>)<br />
Endpoint committee for final determination
Subjects Included in Analysis<br />
• Good quality baseline images<br />
– most baseline CSLO images obtained after randomization<br />
– CSLO Ancillary Study was funded in July 1995 after OHTS began recruitment<br />
– Added site later to increase African American enrollment<br />
• If first CSLO image was acquired on or after the OHTS<br />
examination with a suspicious photographic or visual field finding<br />
later confirmed as POAG by the OHTS endpoint committee, that<br />
eye was excluded from the analysis
Baseline Predictors of POAG Endpoints<br />
CSLO Ancillary Study to the OHTS Subjects<br />
Subjects for<br />
this study<br />
{<br />
36 Reached POAG<br />
Endpoint<br />
(n=41 eyes)<br />
439 with CSLO imaging<br />
(n=874 eyes)<br />
438 with CSLO before POAG<br />
(n=865 eyes)<br />
432 Did not reach a<br />
POAG Endpoint<br />
(n=824 eyes)<br />
Images not acquired before<br />
POAG (1 participant (OU) & 7<br />
unilateral eyes)
POAG Endpoints in 41 eyes of 36 participants<br />
• POAG initial suspicious dates before October 2003- confirmed and<br />
entered into the database by February 9, 2004.<br />
• 5 bilateral POAG, 31 unilateral POAG<br />
– 9 (22%) eyes reached a visual field endpoint first<br />
– 31 (76%) eyes reached an optic disc endpoint first<br />
– 1 (2%) eye reached visual field and optic disc endpoint concurrently
CSLO OHTS Ancillary Study Participants<br />
POAG (n=36) Not POAG (n=402)<br />
Mean Age (years) 57.5 9.4 54.8 9.1<br />
Mean IOP (mm Hg) 25.1 + 2.8 25.0 + 2.3<br />
Mean Visual Field PSD (dB) 1.95 + .20 1.90 + .21<br />
Mean Photo based VCDR .47 + .18 .38 + .19<br />
Mean Corneal Thickness (µm) 554.3 + 37.4 577.0 + 37.0<br />
Mean Follow-up (months) 48.4 + 25.2 79.5 + 20.8<br />
% African Americans 14% 21%
Significant Baseline CSLO Measurements<br />
Associated with the Development of POAG<br />
from Multivariate Proportional Hazards Models<br />
(Adjusting for age, IOP, PSD, CCT and history of heart disease, with medication status as a time dependent covariate)<br />
Hazards Ratio (95% CI)<br />
Mean Height Contour (per .1 mm greater) 2.7 (1.6, 4.5)<br />
Mean Cup Depth (per .1 mm greater) 1.6 (1.1, 2.2)<br />
Reference Plane Height (per .1 mm greater) 1.5 (1.0, 2.2)<br />
Cup Area-to-Disc area (per .1 greater) 1.2 (1.0, 1.5)<br />
Cup Volume below reference (per .1 mm 3 greater) 1.2 (1.0, 1.4)<br />
Rim Area (per .1 mm 2 greater) 0.6 (0.4, 0.8)<br />
Rim Volume (per .1 mm 3 greater) 0.6 (0.5, 0.9)<br />
Rim Area-to-Disc area (per .1 greater) 0.8 (0.6, 0.9)
Significant Baseline CSLO Indices<br />
Associated with the Development of POAG<br />
from Multivariate Proportional Hazards Models<br />
(Adjusting for age, IOP, PSD, CCT and history of heart disease, with medication status as a time dependent covariate)<br />
Hazards Ratio (95% CI)<br />
(outside normal limits versus not)<br />
HRT Classification (LDF) 2.5 (1.3, 4.9)<br />
Moorfields Regression Analysis<br />
Overall (Any region ONL) 2.4 (1.0, 5.6)<br />
Global (Global values ONL) 3.4 (1.1, 10.0)<br />
Temporal Inferior 5.8 (1.6, 21.0)<br />
Nasal Inferior 4.2 (1.6, 10.9)<br />
Temporal Superior 3.3 (0.98, 11.0)
Baseline CSLO measurements<br />
Not Associated with the Development of POAG<br />
from Multivariate Proportional Hazards Models<br />
(Adjusting for age, IOP, PSD, CCT, history of heart disease, with medication status as a time dependent covariate)<br />
Hazards Ratio (95% CI)<br />
Disc area (per .4 mm 2 greater) 0.9 (0.6, 1.3)<br />
RNFL thickness (per .1mm greater) 0.6 (0.4, 1.2)<br />
Cup Shape (per .1 greater) 1.0 (0.6, 1.7)<br />
RNFL Cross Sectional area (per .3mm 2 greater) 0.7 (0.5, 1.1)
Mean Height Contour<br />
(above and below median values)<br />
Kaplan-Meier Survival Curves<br />
Rim Area<br />
(above and below median values)<br />
Moorfields Regression<br />
Analysis Global
Summary of Results<br />
• Baseline CSLO topographic optic disc measurements when<br />
used alone or combined with central corneal thickness, IOP,<br />
history of vascular disease are significantly associated with the<br />
development of POAG among individuals with ocular<br />
hypertension.<br />
• Majority of eyes with CSLO classifications “outside normal<br />
limits” at baseline did not develop POAG within the follow-up<br />
period of this analysis
“Predictive accuracy” during follow-up period<br />
(% of POAG and non-POAG correctly classified at baseline)<br />
HRT<br />
Classification<br />
Outside<br />
Normal<br />
Limits<br />
MRA Overall Outside<br />
Normal<br />
Limits<br />
MRA Global Outside<br />
Normal<br />
Limits<br />
MRA Temporal<br />
Inferior<br />
MRA nasal<br />
Inferior<br />
MRA<br />
temporal<br />
superior<br />
Outside<br />
Normal<br />
Limits<br />
Outside<br />
Normal<br />
Limits<br />
Outside<br />
Normal<br />
Limits<br />
Not at<br />
POAG<br />
(n=402)<br />
POAG<br />
(n=36)<br />
Sensitivity Specificity Negative<br />
Predictive<br />
Value<br />
Positive<br />
Predictive<br />
Value<br />
128 20 55% 68% 95% 14%<br />
61 10 28% 85% 93% 14%<br />
14 5 14% 96% 93% 27%<br />
13 3 8% 97% 92% 19%<br />
24 7 19% 94% 93% 23%<br />
6 4 11% 99% 93% 40%
Need for Longer Follow-up<br />
to better evaluate predictive accuracy<br />
• Majority of eyes with outside normal limit values did not develop<br />
POAG during current follow-up period.<br />
• Important to determine whether participants with POAG<br />
endpoints and CSLO indices within normal limits at baseline, had<br />
CSLO measurements outside normal limits during their later<br />
follow-up examinations.
This Study Did Not:<br />
• Determine whether the OHTS prediction model that includes<br />
baseline CSLO measurements is improved over one that<br />
includes baseline stereophotograph cup-disc ratio measurements<br />
– additional POAG endpoints are needed<br />
• Determine whether CSLO is a better predictive tool than other<br />
instruments, such as the GDX or the OCT<br />
• Recommend specific CSLO parameters
Thank You<br />
UCSD Hamilton Glaucoma <strong>Center</strong>
Mean Height Contour<br />
• Displays height values moving around optic disc, in order:<br />
Temporal -> Superior -> Nasal -> Inferior -> Temporal<br />
Temp Superior Nasal Inferior Temp Temp Superior Nasal Inferior Temp<br />
Normal Eye<br />
Double hump pattern<br />
Glaucoma Eye<br />
Inferior RNFL Loss
Mean Height Contour<br />
• Y axis goes from negative to positive values, moving<br />
from inside the eye outward toward the back of the retina<br />
Inside Eye<br />
- (negative values)<br />
0 (zero)<br />
+ (positive values)<br />
Back of retina<br />
Average height in<br />
parapapillary region
Sample HRT Data from OHTS CSLO<br />
Ancillary Study Patient<br />
HRT Classification