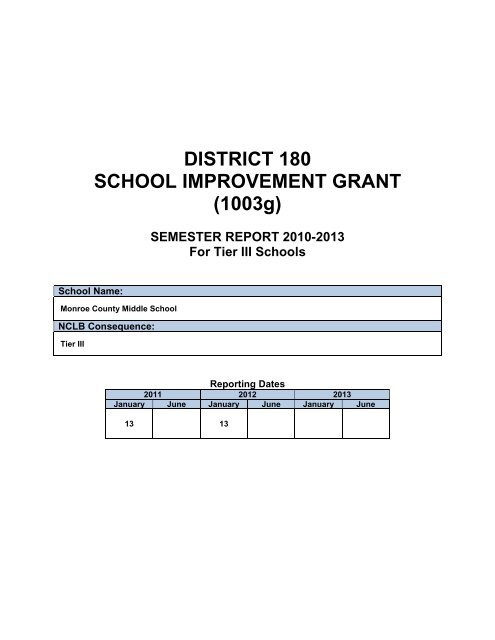
Monroe County Middle School - Monroe County Schools
Monroe County Middle School - Monroe County Schools
Monroe County Middle School - Monroe County Schools
- No tags were found...

You also want an ePaper? Increase the reach of your titles
YUMPU automatically turns print PDFs into web optimized ePapers that Google loves.
On-Demand Writing Grade 8 40.74 42.18Our 7 th grade reading scores were down primarily due to a maternity leave for ourreading teacher.Our 8 th grade math scores are down due to having a new inexperienced teacher.Our 6 th grade math scores are up due to the additional teacher we added with theSIG funds.Reading InterventionsBaseline% ofstudentsserved2009-2010% of studentsservedAug-DecJan-June2010-2011% of studentsprogressing to a lessintensive tieredinterventionAug-DecJan-JuneGrade28.8 21.6 15.06 37.0Grade56.0 19.4 31.5 11.37Grade35.6 38.0 20.08 61.0Additional Comments aboutthe increase or decrease ofstudents with disabilityreferrals:These less intensive aremy best estimates,because I failed to reportthese last year.Additional Comments aboutthe increase or decrease ofAfrican American students’referrals:Grade6Grade7Grade8% of studentsservedAug-DecJan-June26.16 7.5552.00 42.0045.32 15.82% of studentsprogressing to a lessintensive tieredinterventionAug-Jan-JuneDec2011-2012Additional Comments about the increase ordecrease of students with disabilityreferrals:RTI has changed to a teacherrecommendation/score program. Muchmore effective in both identifying andintervening.Additional Comments about the increase ordecrease of African American students’referrals:Grade6Grade7% of studentsservedAug-DecJan-June% of studentsprogressing to a lessintensive tieredinterventionAug-Jan-JuneDec2012-2013Additional Comments about the increase ordecrease of students with disabilityreferrals:
Grade8Additional Comments about the increase ordecrease of African American students’referrals:I can’t determine the baseline scores for the reading interventions in 09-10.Math InterventionsBaseline% ofstudentsserved2009-2010<strong>School</strong>Year% of studentsservedAug-DecJan-June2010-2011% of studentsprogressing to a lessintensive tieredinterventionAug-DecJan-JuneGrade 6 37.0 24.4 20.0 16.5Grade 7 60.0 32.37 42.0 18.0Additional Comments aboutthe increase or decrease ofstudents with disabilityreferrals:The less intensive aremy best estimates,because it was failed tobe reported last year.Grade 8 77.0 26.8 50.5 20.0 Additional Comments aboutthe increase or decrease ofAfrican American students’referrals:Grade 6% of studentsservedAug-Dec43.60Jan-June2011-2012% of studentsprogressing to a lessintensive tieredinterventionAug-Jan-JuneDec36.04Grade 7 30.00 16.66Grade 8 26.61 38.12Additional Comments about the increaseor decrease of students with disabilityreferrals:Additional Comments about the increaseor decrease of African Americanstudents’ referrals:Grade 6Grade 7Grade 8% of studentsservedAug-DecJan-June2012-2013% of studentsprogressing to a lessintensive tieredinterventionAug-Jan-JuneDecAdditional Comments about the increaseor decrease of students with disabilityreferrals:Additional Comments about the increase
or decrease of African Americanstudents’ referrals:I can’t determine the baseline scores for the math interventions for 09-10.Explore [% Below Benchmark]Baseline 2009-2010 2010-2011 2011-2012 2012-2013English 38 39 46Math 57 77 82Reading 59 61 72Science 86 85 90Composite 14.9 14.9 14.4Interventions for Explore [Report in Percentages]Percent of2010-20112011-2012Aug-DecJan-JuneAug-DecJan-Junestudentsreceivingsupport asa result ofExplorescores.65.565.572.572.5Describe interventionsand/or supportsRTI, All Math andreading interventionist,Math and ReadingTutoring after school,RTI, Students selfanalyze their scores,Explore/Plan/ACT EPASnight, Math and ReadingTutoring after schoolImproved RTI, Allclassroom assessmentnow timed, Selfanalyzing of scores bystudent, EPAS night,Math and readinginterventionistRTI, Timedassessments, Math andReading interventionist,After school tutoringData to showresults for theinterventionsand/or supportsRTI Prep. ForExplore for 4 weeksprior to testAnalyzing explorescores after KCCTtestRTI Prep for 5weeks prior to test,bellringerAnalyzing personalscores, Given to 7 thgrade in addition to8 th , Referral to RTI ifbenchmark notreached, bellringerCommentsSelf analyzing ofscores will improvestudents awarenessof importance of testFormativeassessments daily(bellringer)Studentacknowledgment oftest scores. Explorewas given to 7 th gradealso. We will alsogive to 6 th next year.MCMS is in a GEARUP District and willreceive funding toassist in raisingExplore test scoreseffective in the Fallof 2012
2012-2013Aug-DecJan-JunePercent ofstudentsreceivingsupport asa result ofExplorescores.Describe interventionsand/or supportsData to showresults for theinterventionsand/or supportsComments7 th grade Explore Scores 2011-12English 48 13.5Math 83 14.7Reading 72 13.2Science 94 15.1Composite 74.257 th grade scored essentially the same as the 8 th grade. Promising fornext year. Planning to give to 6 th grade next year, also.CONTENT FOCUS – English Language Arts/LiteracySIG ANNUAL SMARTGOALFOR ALL STUDENTS(Report of Progress on SMARTGoals listed in SIG Application)Goal: Teachers will implement Adolescent Literacystrategies for 2 lessons per week, as measured by:walkthrus,guided planning checklists, and teacherdeveloped formative assessments. The anticipatedoutcome will be a decrease in novice and apprenticestudents as measured on our thinklink results.Person Responsible: Tony Harlan, Debbie CroweName ofMeasurement:Baseline 2009-20102010-2011 2011-2012 2012-2013Thinklink 32.0 31.43 41.5Was goal met?(Yes or No)Showed a decrease of app. 1% in 10-11.yesAfter 3 rdassessmentIf goal was not met, what will the district be doing to assist the school in reachinggoals?
2010-11 average of all 3 thinklink test2011-11 average of all 3 thinklink testPercent will drop after administration of 3 rd thinklink assessmentSIG BENCHMARK DATA FOR ALL STUDENTS (Report of Progress on Benchmark Goalslisted in SIG Application)Baseline 2010-2011 2011-2012 2012-2013Name of 2009- Aug-Assessment: 2010 DecJan-June Aug-Dec Jan-June Aug-Dec Jan-JuneThinklink% Proficientor above68.0 69.4 67.6 60.7% Novice 6.0 5.7 7.8 12.4SIG BENCHMARK DATA FOR SUB GROUPS (Report of Progress on Benchmark Goalslisted in SIG Application)Baseline 2010-2011 2011-2012 2012-20132009-2010Aug-DecJan-JuneAug-DecJan-JuneAug-DecJan-June%ProficientAfrican-American90.0 75.0 55.6% Novice 10.0 0 11.0Free/ReducedLunch%Proficient65.7 63.4 50.2% Novice 6.3 7.9 13.2Students withDisabilities%Proficient18.4 35.3 0% Novice 28.9 8.8 40.9I can’t accurately determine the baseline scores, because they haven’t beenasked for in the past. We also didn’t keep up with data as efficiently then as wedo now.CONTENT FOCUS – MathematicsSIG ANNUAL SMARTGOALFOR ALL STUDENTSGoal: All teachers will implement differentiated mathstrategies for two lessons per week, measured by walkthrus,guided planning checklists, and teacherdeveloped formative assessments. The anticipated
(Report of Progress on SMARTGoals listed in SIG Application)outcome will be a decrease in novice and apprenticestudents as measured on our thinklink scores.Person Responsible: Tony Harlan, Debbie CroweName ofMeasurement:Baseline 2009-2010Thinklink 46.0 45.61Was goal met?(Yes or No)10-11 By less than 1 percent2010-2011 2011-2012 2012-2013yes55.7, 37.846.75Yes, add 3 rd testafter administeredIf goal was not met, what will the district be doing to assist the school in reachinggoals?2010-11 an average of all 3 Thinklink test2011-12 an average of the first two Thinklink testI anticipate the percentage to drop even lower after the third assessment, since we dropped by10% from the second to the third last year.SIG BENCHMARK DATA FOR ALL STUDENTS (Report of Progress on Benchmark Goalslisted in SIG Application)Baseline 2010-2011 2011-2012 2012-2013Name of 2009- Aug-Assessment: 2010 DecJan-June Aug-Dec Jan-June Aug-Dec Jan-JuneThinklink% Proficientor above67.0 41.4 51.5 62.2% Novice 11.0 20.2 18.0 11.2SIG BENCHMARK DATA FOR SUB GROUPS (Report of Progress on Benchmark Goalslisted in SIG Application)Baseline 2010-2011 2011-2012 2012-20132009-2010Aug-DecJan-JuneAug-DecJan-JuneAug-DecJan-June%ProficientAfrican-American30.0 55.5 80.0% Novice 30.0 11.1 10.0Free/ReducedLunch%Proficient32.5 45.2 60.6
% Novice 23.6 23.4 13.3Students withDisabilities%Proficient2.6 14.3 34.6% Novice 78.9 51.4 30.8I can’t accurately determine the 09-10 baselines, because they weren’t asked forbefore. We also didn’t keep data as efficiently then as we do now.From our original app. dated Spring 2010On July 1 st 2010, we began implementation of instructional practice and datacollection. This will be to determine the intervention and instructional practicesthat are occurring.2010-11-As based by the 2011 KCCT, 45% of sixth grade students with disabilities willscore proficient/distinguished in reading and 25% will score proficient/distinguished in math.-As based by the 2011 KCCT, 27% of seventh grade students with disabilities willscore proficient/distinguished in reading and 35% will scoreproficient/distinguished in math.-As based by the 2011 KCCT, 19% of eighth grade students with disabilities willscore proficient/distinguished in reading and 32% will scoreproficient/distinguished in math.-As based by the 2011 KCCT, 57% of all students that are on free/reduced lunchwill score proficient/distinguished in reading and 52% will scoreproficient/distinguished in math.Actual Scores:6 th 7 th 8 th F/RYear 09-10Math 16 14 16 50Reading 39 20 20 56Year 10-11Math 36 40 0 55Reading 36 46 10 60We reached our goals with the exception of 8 th grade Math and reading and 6 thgrade reading. Very proud of these results. It is evident the goals helped exceedthe year 09-10 versus 10-11, with the exception of 8 th grade. We changed our
Data Summary QuestionsData Summary for January 20121. What does the data tell us?Student and teacher attendance has improved for teachers by 1.4% over our baseline year,and by 1.5 for students over the baseline year. Our largest decline on KCCT has been in8 th grade math with the largest increase in 7 th grade science, followed by 6 th grade mathand 8 th grade social studies. Reading scores have become stagnant with novice studentsfrom special ed. numbers decreasing. Novice students in math show steady decreasealong with free/reduce and African American students.A majority of our students are in an intensive intervention setting and moving to al lessintensive intervention setting due to our improved RTI program along with betterinstructional strategies.Over the past three years our explore scores have shown to be decreasing.Our thinklink scores show increases in both math and reading; we feel confident that thisindicates our scores will increase on the K-PREP.2. What does the data not tell us? Example: Report such things as reasons for lowerstudent or teacher attendance, reductions in novice levels, increases in interventions, etc.Why our explore interventions are not working? We use explore bellringers, timedassessments, timed bellringers, and a focus on test taking strategies for the explore. Whywere our 7 th grade explore scores essentially the same as the 8 th ? Why our math scoresshow improvement while reading are not moving.3. What are causes for celebration?Our overall KCCT scores show increases in reading, math, science, social studies and ondemand writing. Our current thinklink scores and our improved RTI program are also causefor celebration. Improved attendance of both students and teachers over the same timeperiod last year are celebration worthy.4. What are the opportunities for improvement?Increased explore scores to reach benchmarks, refine formative assessment and guidedplanning, and continued improvement of our RTI program.5. What are our next steps?Monitor results of our walk-through data and provide better feedback to teachers forimprovement in instructional strategies and the use of formative assessment.Ensure instructional practice, assessments, learning targets and classroom activities arealigned with common core and college readiness standards.
Data Summary for June 20121. What does the data tell us?2. What does the data not tell us? Example: Report such things as reasons for lower studentor teacher attendance, reductions in novice levels, increases in interventions, etc.3. What are causes for celebration?4. What are the opportunities for improvement?5. What are our next steps?Data Summary for January 20131. What does the data tell us?2. What does the data not tell us? Example: Report such things as reasons for lower studentor teacher attendance, reductions in novice levels, increases in interventions, etc.3. What are causes for celebration?4. What are the opportunities for improvement?5. What are our next steps?Data Summary for June 20131. What does the data tell us?2. What does the data not tell us? Example: Report such things as reasons for lower studentor teacher attendance, reductions in novice levels, increases in interventions, etc.3. What are causes for celebration?4. What are the opportunities for improvement?
5. What are our next steps?