- Page 1 and 2:
Graphics with PSTricksGetting the p
- Page 3 and 4:
1.1. Getting the pointsAny picture
- Page 5 and 6:
Graphics with PSTricksThe PSTricks
- Page 7 and 8:
Graphics with PSTricksillustrated i
- Page 9 and 10:
Graphics with PSTricks\begin{pspict
- Page 11 and 12:
Graphics with PSTricks\begin{pspict
- Page 13 and 14:
Graphics with PSTricks100 1 2In thi
- Page 15 and 16:
1.4. Ends of LinesLines can be prov
- Page 17 and 18:
Graphics with PSTricks\begin{pspict
- Page 19 and 20:
parameter value descriptiondotsize
- Page 21 and 22:
Graphics with PSTricksThe default v
- Page 23 and 24:
1.5. Bent Lines and PolygonsAs in t
- Page 25 and 26:
“filled up” polygon. For exampl
- Page 27 and 28:
Graphics with PSTricksGetting the p
- Page 29 and 30:
1.6. Simple CurvesCircles, ellipses
- Page 31 and 32:
321030 ◦ 60 ◦Graphics with PSTr
- Page 33 and 34:
Graphics with PSTricksGetting the p
- Page 35 and 36:
Graphics with PSTricksAnother curve
- Page 37 and 38:
Ordinary colorsMore colorsFill—in
- Page 39 and 40:
Colorful TricksOrdinary colorsMore
- Page 41 and 42:
\begin{pspicture}(0,0)(3,3)\psframe
- Page 43 and 44:
NAME CMYK COLOR NAME CMYK COLORGree
- Page 45 and 46:
\begin{pspicture}(0,0)(4,4)\psframe
- Page 47 and 48:
2.4. Custom colorsIf you are not sa
- Page 49 and 50:
2.5. From one color to anotherThere
- Page 51 and 52:
\begin{center}\definecolor{myblue}{
- Page 53 and 54:
\pscircle[linestyle=none,%linewidth
- Page 55 and 56:
Borderline TricksDouble boundaryIns
- Page 57 and 58:
3.1. Double boundaryIn the first ch
- Page 59 and 60:
doublesep=5pt,%doublecolor=Blue]%(1
- Page 61 and 62:
\begin{pspicture}(0,0)(4,2)\psframe
- Page 63 and 64:
Borderline TricksDouble boundaryIns
- Page 65 and 66:
3.3. Borders—visible or invisible
- Page 67 and 68:
\begin{pspicture}(0,0)(3,3)\psframe
- Page 69 and 70:
3.4. ShadowsAn object can be given
- Page 71:
\begin{pspicture}(0,0)(3.5,3.5)\psp
- Page 77 and 78:
A “closed” curve joining specif
- Page 79 and 80:
4.2. Invisible endsthere’s a thir
- Page 81 and 82:
Curvy Tricks543543Open and closed c
- Page 83 and 84:
Curvy Tricks55Open and closed curve
- Page 85 and 86:
value of 0 for the third number in
- Page 87 and 88: Curvy Tricks4.4. A new curveAnother
- Page 89 and 90: This point, which we denote by z 12
- Page 91 and 92: 5. More on CoordinatesCoordinate gr
- Page 93 and 94: example:\psgrid(2,3)(1,2)(5,4)431 2
- Page 95 and 96: More on Coordinatesparameter meanin
- Page 97 and 98: Instead of scaling by the same amou
- Page 99 and 100: 5.3. Another type of coordinatesThe
- Page 101 and 102: \definecolor{PaleApricot}{cmyk}{0,0
- Page 103 and 104: \begin{pspicture}(0,-0.5)(6,3.5)\Sp
- Page 105 and 106: such that the required point has x-
- Page 107 and 108: 5.5. Changing the systemIn drawing
- Page 109 and 110: \begin{pspicture}(0,0)(4,4)\pspolyg
- Page 111 and 112: Appendix—Math in PostScriptWe’v
- Page 113 and 114: Placing ThingsPlacing and rotating
- Page 115 and 116: Placing Things6.1. Placing and rota
- Page 117 and 118: Placing Things\begin{pspicture}(0,1
- Page 119 and 120: Placing Things98Placing and rotatin
- Page 121 and 122: BASELINEheightwidthbydepthBASELINEP
- Page 123 and 124: Placing ThingsFor vertically shifti
- Page 125 and 126: Placing Things\definecolor{PaleApri
- Page 127 and 128: Placing Thingsangle letter meaning
- Page 129 and 130: Placing ThingsCPlacing and rotating
- Page 131 and 132: We show below The positions of the
- Page 133 and 134: Placing Things\begin{pspicture}(-4,
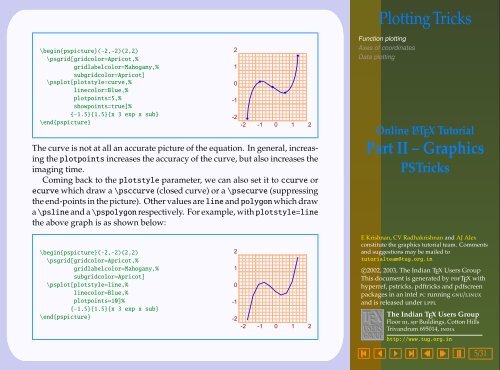
- Page 135 and 136: Plotting TricksFunction plottingAxe
- Page 137: 7.1. Function plottingFor a mathema
- Page 141 and 142: Plotting Tricks\psset{unit=0.5}\beg
- Page 143 and 144: 7.2. Axes of coordinatesOften in ma
- Page 145 and 146: Plotting Tricks323(3,2)•Function
- Page 147 and 148: We have included a background grid
- Page 149 and 150: Plotting Tricks\begin{pspicture}(-2
- Page 151 and 152: \begin{pspicture}(-3,-3)(3,3)\psaxe
- Page 153 and 154: Plotting Tricks\begin{pspicture}(-3
- Page 155 and 156: Note that the entries in the first
- Page 157 and 158: Plotting Tricks\psset{unit=0.66}\re
- Page 159 and 160: 7.3. Data plottingThe command \pspl
- Page 161 and 162: Plotting Tricks\begin{pspicture}(0,
- Page 163 and 164: The last command we describe for da
- Page 165 and 166: Plotting Tricks\savedata{\dirdata}[
- Page 167 and 168: Simple customizationHigher level cu
- Page 169 and 170: we can use \colgrid every time we n
- Page 171 and 172: 8.2. Higher level customizationApar
- Page 173 and 174: Let’s now take a closer look at t
- Page 175 and 176: this is the state we are in:Custom
- Page 177 and 178: Custom Graphics\psset{unit=1.5cm}\b
- Page 179 and 180: treating the current point as the f
- Page 181 and 182: Custom Graphics\begin{pspicture}(-2
- Page 183 and 184: Custom Graphics\begin{pspicture}(0,
- Page 185 and 186: Custom Graphics\renewcommand{\pshla
- Page 187 and 188: Custom Graphics\begin{pspicture}(0,