Marketing%20Strategies%20and%20the%20Difference%20Level%20of%20Sales%20and%20Profits
Marketing%20Strategies%20and%20the%20Difference%20Level%20of%20Sales%20and%20Profits
Marketing%20Strategies%20and%20the%20Difference%20Level%20of%20Sales%20and%20Profits

Create successful ePaper yourself
Turn your PDF publications into a flip-book with our unique Google optimized e-Paper software.
www.ccsenet.org/ijbm International Journal of Business and Management Vol. 7, No. 23; 2012<br />
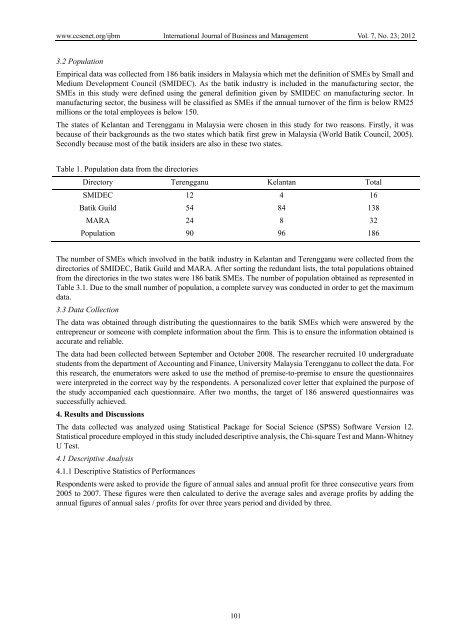
3.2 Population<br />
Empirical data was collected from 186 batik insiders in Malaysia which met the definition of SMEs by Small and<br />
Medium Development Council (SMIDEC). As the batik industry is included in the manufacturing sector, the<br />
SMEs in this study were defined using the general definition given by SMIDEC on manufacturing sector. In<br />
manufacturing sector, the business will be classified as SMEs if the annual turnover of the firm is below RM25<br />
millions or the total employees is below 150.<br />
The states of Kelantan and Terengganu in Malaysia were chosen in this study for two reasons. Firstly, it was<br />
because of their backgrounds as the two states which batik first grew in Malaysia (World Batik Council, 2005).<br />
Secondly because most of the batik insiders are also in these two states.<br />
Table 1. Population data from the directories<br />
Directory Terengganu Kelantan Total<br />
SMIDEC 12 4 16<br />
Batik Guild 54 84 138<br />
MARA 24 8 32<br />
Population 90 96 186<br />
The number of SMEs which involved in the batik industry in Kelantan and Terengganu were collected from the<br />
directories of SMIDEC, Batik Guild and MARA. After sorting the redundant lists, the total populations obtained<br />
from the directories in the two states were 186 batik SMEs. The number of population obtained as represented in<br />
Table 3.1. Due to the small number of population, a complete survey was conducted in order to get the maximum<br />
data.<br />
3.3 Data Collection<br />
The data was obtained through distributing the questionnaires to the batik SMEs which were answered by the<br />
entrepreneur or someone with complete information about the firm. This is to ensure the information obtained is<br />
accurate and reliable.<br />
The data had been collected between September and October 2008. The researcher recruited 10 undergraduate<br />
students from the department of Accounting and Finance, University Malaysia Terengganu to collect the data. For<br />
this research, the enumerators were asked to use the method of premise-to-premise to ensure the questionnaires<br />
were interpreted in the correct way by the respondents. A personalized cover letter that explained the purpose of<br />
the study accompanied each questionnaire. After two months, the target of 186 answered questionnaires was<br />
successfully achieved.<br />
4. Results and Discussions<br />
The data collected was analyzed using Statistical Package for Social Science (SPSS) Software Version 12.<br />
Statistical procedure employed in this study included descriptive analysis, the Chi-square Test and Mann-Whitney<br />
U Test.<br />
4.1 Descriptive Analysis<br />
4.1.1 Descriptive Statistics of Performances<br />
Respondents were asked to provide the figure of annual sales and annual profit for three consecutive years from<br />
2005 to 2007. These figures were then calculated to derive the average sales and average profits by adding the<br />
annual figures of annual sales / profits for over three years period and divided by three.<br />
101