Marketing%20Strategies%20and%20the%20Difference%20Level%20of%20Sales%20and%20Profits
Marketing%20Strategies%20and%20the%20Difference%20Level%20of%20Sales%20and%20Profits
Marketing%20Strategies%20and%20the%20Difference%20Level%20of%20Sales%20and%20Profits

Create successful ePaper yourself
Turn your PDF publications into a flip-book with our unique Google optimized e-Paper software.
www.ccsenet.org/ijbm International Journal of Business and Management Vol. 7, No. 23; 2012<br />
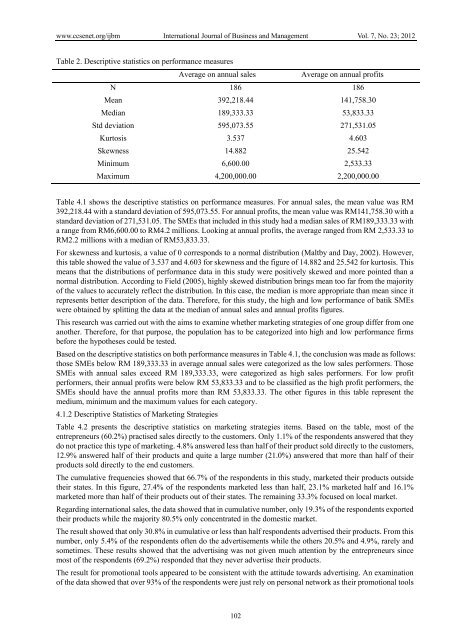
Table 2. Descriptive statistics on performance measures<br />
Average on annual sales Average on annual profits<br />
N 186 186<br />
Mean 392,218.44 141,758.30<br />
Median 189,333.33 53,833.33<br />
Std deviation 595,073.55 271,531.05<br />
Kurtosis 3.537 4.603<br />
Skewness 14.882 25.542<br />
Minimum 6,600.00 2,533.33<br />
Maximum 4,200,000.00 2,200,000.00<br />
Table 4.1 shows the descriptive statistics on performance measures. For annual sales, the mean value was RM<br />
392,218.44 with a standard deviation of 595,073.55. For annual profits, the mean value was RM141,758.30 with a<br />
standard deviation of 271,531.05. The SMEs that included in this study had a median sales of RM189,333.33 with<br />
a range from RM6,600.00 to RM4.2 millions. Looking at annual profits, the average ranged from RM 2,533.33 to<br />
RM2.2 millions with a median of RM53,833.33.<br />
For skewness and kurtosis, a value of 0 corresponds to a normal distribution (Maltby and Day, 2002). However,<br />
this table showed the value of 3.537 and 4.603 for skewness and the figure of 14.882 and 25.542 for kurtosis. This<br />
means that the distributions of performance data in this study were positively skewed and more pointed than a<br />
normal distribution. According to Field (2005), highly skewed distribution brings mean too far from the majority<br />
of the values to accurately reflect the distribution. In this case, the median is more appropriate than mean since it<br />
represents better description of the data. Therefore, for this study, the high and low performance of batik SMEs<br />
were obtained by splitting the data at the median of annual sales and annual profits figures.<br />
This research was carried out with the aims to examine whether marketing strategies of one group differ from one<br />
another. Therefore, for that purpose, the population has to be categorized into high and low performance firms<br />
before the hypotheses could be tested.<br />
Based on the descriptive statistics on both performance measures in Table 4.1, the conclusion was made as follows:<br />
those SMEs below RM 189,333.33 in average annual sales were categorized as the low sales performers. Those<br />
SMEs with annual sales exceed RM 189,333.33, were categorized as high sales performers. For low profit<br />
performers, their annual profits were below RM 53,833.33 and to be classified as the high profit performers, the<br />
SMEs should have the annual profits more than RM 53,833.33. The other figures in this table represent the<br />
medium, minimum and the maximum values for each category.<br />
4.1.2 Descriptive Statistics of Marketing Strategies<br />
Table 4.2 presents the descriptive statistics on marketing strategies items. Based on the table, most of the<br />
entrepreneurs (60.2%) practised sales directly to the customers. Only 1.1% of the respondents answered that they<br />
do not practice this type of marketing. 4.8% answered less than half of their product sold directly to the customers,<br />
12.9% answered half of their products and quite a large number (21.0%) answered that more than half of their<br />
products sold directly to the end customers.<br />
The cumulative frequencies showed that 66.7% of the respondents in this study, marketed their products outside<br />
their states. In this figure, 27.4% of the respondents marketed less than half, 23.1% marketed half and 16.1%<br />
marketed more than half of their products out of their states. The remaining 33.3% focused on local market.<br />
Regarding international sales, the data showed that in cumulative number, only 19.3% of the respondents exported<br />
their products while the majority 80.5% only concentrated in the domestic market.<br />
The result showed that only 30.8% in cumulative or less than half respondents advertised their products. From this<br />
number, only 5.4% of the respondents often do the advertisements while the others 20.5% and 4.9%, rarely and<br />
sometimes. These results showed that the advertising was not given much attention by the entrepreneurs since<br />
most of the respondents (69.2%) responded that they never advertise their products.<br />
The result for promotional tools appeared to be consistent with the attitude towards advertising. An examination<br />
of the data showed that over 93% of the respondents were just rely on personal network as their promotional tools<br />
102