DECEMBER 2001 June 24, 2002 The number of Crime Index ...
DECEMBER 2001 June 24, 2002 The number of Crime Index ...
DECEMBER 2001 June 24, 2002 The number of Crime Index ...

Create successful ePaper yourself
Turn your PDF publications into a flip-book with our unique Google optimized e-Paper software.
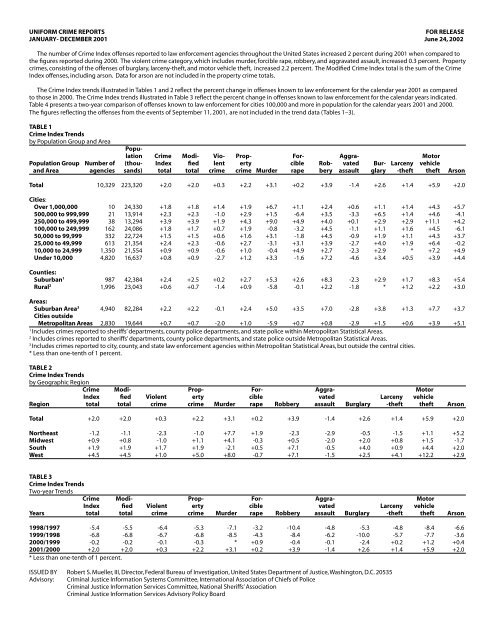
UNIFORM CRIME REPORTSFOR RELEASEJANUARY- <strong>DECEMBER</strong> <strong>2001</strong> <strong>June</strong> <strong>24</strong>, <strong>2002</strong><strong>The</strong> <strong>number</strong> <strong>of</strong> <strong>Crime</strong> <strong>Index</strong> <strong>of</strong>fenses reported to law enforcement agencies throughout the United States increased 2 percent during <strong>2001</strong> when compared tothe figures reported during 2000. <strong>The</strong> violent crime category, which includes murder, forcible rape, robbery, and aggravated assault, increased 0.3 percent. Propertycrimes, consisting <strong>of</strong> the <strong>of</strong>fenses <strong>of</strong> burglary, larceny-theft, and motor vehicle theft, increased 2.2 percent. <strong>The</strong> Modified <strong>Crime</strong> <strong>Index</strong> total is the sum <strong>of</strong> the <strong>Crime</strong><strong>Index</strong> <strong>of</strong>fenses, including arson. Data for arson are not included in the property crime totals.<strong>The</strong> <strong>Crime</strong> <strong>Index</strong> trends illustrated in Tables 1 and 2 reflect the percent change in <strong>of</strong>fenses known to law enforcement for the calendar year <strong>2001</strong> as comparedto those in 2000. <strong>The</strong> <strong>Crime</strong> <strong>Index</strong> trends illustrated in Table 3 reflect the percent change in <strong>of</strong>fenses known to law enforcement for the calendar years indicated.Table 4 presents a two-year comparison <strong>of</strong> <strong>of</strong>fenses known to law enforcement for cities 100,000 and more in population for the calendar years <strong>2001</strong> and 2000.<strong>The</strong> figures reflecting the <strong>of</strong>fenses from the events <strong>of</strong> September 11, <strong>2001</strong>, are not included in the trend data (Tables 1–3).TABLE 1<strong>Crime</strong> <strong>Index</strong> Trendsby Population Group and AreaPopulation<strong>Crime</strong> Modi- Vio- Prop- For- Aggra- MotorPopulation Group Number <strong>of</strong> (thou- <strong>Index</strong> fied lent erty cible Rob- vated Bur- Larceny vehicleand Area agencies sands) total total crime crime Murder rape bery assault glary -theft theft ArsonTotal 10,329 223,320 +2.0 +2.0 +0.3 +2.2 +3.1 +0.2 +3.9 -1.4 +2.6 +1.4 +5.9 +2.0Cities:Over 1,000,000 10 <strong>24</strong>,330 +1.8 +1.8 +1.4 +1.9 +6.7 +1.1 +2.4 +0.6 +1.1 +1.4 +4.3 +5.7500,000 to 999,999 21 13,914 +2.3 +2.3 -1.0 +2.9 +1.5 -6.4 +3.5 -3.3 +6.5 +1.4 +4.6 -4.1250,000 to 499,999 38 13,294 +3.9 +3.9 +1.9 +4.3 +9.0 +4.9 +4.0 +0.1 +2.9 +2.9 +11.1 +4.2100,000 to <strong>24</strong>9,999 162 <strong>24</strong>,086 +1.8 +1.7 +0.7 +1.9 -0.8 -3.2 +4.5 -1.1 +1.1 +1.6 +4.5 -6.150,000 to 99,999 332 22,7<strong>24</strong> +1.5 +1.5 +0.6 +1.6 +3.1 -1.8 +4.5 -0.9 +1.9 +1.1 +4.3 +3.725,000 to 49,999 613 21,354 +2.4 +2.3 -0.6 +2.7 -3.1 +3.1 +3.9 -2.7 +4.0 +1.9 +6.4 -0.210,000 to <strong>24</strong>,999 1,350 21,554 +0.9 +0.9 -0.6 +1.0 -0.4 +4.9 +2.7 -2.3 +2.9 * +7.2 +4.9Under 10,000 4,820 16,637 +0.8 +0.9 -2.7 +1.2 +3.3 -1.6 +7.2 -4.6 +3.4 +0.5 +3.9 +4.4Counties:Suburban 1 987 42,384 +2.4 +2.5 +0.2 +2.7 +5.3 +2.6 +8.3 -2.3 +2.9 +1.7 +8.3 +5.4Rural 2 1,996 23,043 +0.6 +0.7 -1.4 +0.9 -5.8 -0.1 +2.2 -1.8 * +1.2 +2.2 +3.0Areas:Suburban Area 3 4,940 82,284 +2.2 +2.2 -0.1 +2.4 +5.0 +3.5 +7.0 -2.8 +3.8 +1.3 +7.7 +3.7Cities outsideMetropolitan Areas 2,830 19,644 +0.7 +0.7 -2.0 +1.0 -5.9 +0.7 +0.8 -2.9 +1.5 +0.6 +3.9 +5.11Includes crimes reported to sheriffs’ departments, county police departments, and state police within Metropolitan Statistical Areas.2Includes crimes reported to sheriffs’ departments, county police departments, and state police outside Metropolitan Statistical Areas.3Includes crimes reported to city, county, and state law enforcement agencies within Metropolitan Statistical Areas, but outside the central cities.* Less than one-tenth <strong>of</strong> 1 percent.TABLE 2<strong>Crime</strong> <strong>Index</strong> Trendsby Geographic Region<strong>Crime</strong> Modi- Prop- For- Aggra- Motor<strong>Index</strong> fied Violent erty cible vated Larceny vehicleRegion total total crime crime Murder rape Robbery assault Burglary -theft theft ArsonTotal +2.0 +2.0 +0.3 +2.2 +3.1 +0.2 +3.9 -1.4 +2.6 +1.4 +5.9 +2.0Northeast -1.2 -1.1 -2.3 -1.0 +7.7 +1.9 -2.3 -2.9 -0.5 -1.5 +1.1 +5.2Midwest +0.9 +0.8 -1.0 +1.1 +4.1 -0.3 +0.5 -2.0 +2.0 +0.8 +1.5 -1.7South +1.9 +1.9 +1.7 +1.9 -2.1 +0.5 +7.1 -0.5 +4.0 +0.9 +4.4 +2.0West +4.5 +4.5 +1.0 +5.0 +8.0 -0.7 +7.1 -1.5 +2.5 +4.1 +12.2 +2.9TABLE 3<strong>Crime</strong> <strong>Index</strong> TrendsTwo-year Trends<strong>Crime</strong> Modi- Prop- For- Aggra- Motor<strong>Index</strong> fied Violent erty cible vated Larceny vehicleYears total total crime crime Murder rape Robbery assault Burglary -theft theft Arson1998/1997 -5.4 -5.5 -6.4 -5.3 -7.1 -3.2 -10.4 -4.8 -5.3 -4.8 -8.4 -6.61999/1998 -6.8 -6.8 -6.7 -6.8 -8.5 -4.3 -8.4 -6.2 -10.0 -5.7 -7.7 -3.62000/1999 -0.2 -0.2 -0.1 -0.3 * +0.9 -0.4 -0.1 -2.4 +0.2 +1.2 +0.4<strong>2001</strong>/2000 +2.0 +2.0 +0.3 +2.2 +3.1 +0.2 +3.9 -1.4 +2.6 +1.4 +5.9 +2.0* Less than one-tenth <strong>of</strong> 1 percent.ISSUED BY Robert S. Mueller, III, Director, Federal Bureau <strong>of</strong> Investigation, United States Department <strong>of</strong> Justice, Washington, D.C. 20535Advisory: Criminal Justice Information Systems Committee, International Association <strong>of</strong> Chiefs <strong>of</strong> PoliceCriminal Justice Information Services Committee, National Sheriffs’ AssociationCriminal Justice Information Services Advisory Policy Board
TABLE 4Offenses known to law enforcementCities and Towns 100,000 and over in populationModified<strong>Crime</strong> <strong>Crime</strong> For- Aggra- Motor<strong>Index</strong> <strong>Index</strong> Mur- cible Rob- vated Bur- Larceny- vehicletotal total der rape bery assault glary theft theft ArsonABILENE TX 2000 4,797 4,813 1 43 105 255 960 3,203 230 16<strong>2001</strong> 5,186 5,223 2 66 88 227 1,084 3,504 215 37ALBUQUERQUE NM 2000 39,447 39,633 33 239 1,547 3,317 7,120 22,842 4,349 186<strong>2001</strong> 39,541 39,720 34 219 1,610 3,396 6,585 23,535 4,162 179ALLENTOWN PA 2000 5,516 5,569 9 40 349 290 1,195 3,086 547 53<strong>2001</strong> 5,237 5,278 8 46 295 269 1,111 3,052 456 41AMARILLO TX 2000 13,728 13,786 11 97 253 1,073 2,130 9,343 821 58<strong>2001</strong> 13,627 13,683 19 98 277 1,008 2,533 8,747 945 56AMHERST TOWN 1 NY 2000 2,071 2,074 0 4 26 44 169 1,697 131 3<strong>2001</strong> 2,010 0 3 31 50 171 1,645 110ANAHEIM CA 2000 9,909 9,974 11 84 428 890 1,570 5,374 1,552 65<strong>2001</strong> 11,225 11,272 8 91 484 733 1,798 6,328 1,783 47ANCHORAGE AK 2000 12,866 12,967 10 195 346 973 1,533 8,799 1,010 101<strong>2001</strong> 13,214 13,319 10 210 384 1,144 1,606 8,648 1,212 105ANN ARBOR MI 2000 3,979 4,015 0 <strong>24</strong> 95 184 749 2,726 201 36<strong>2001</strong> 3,880 3,898 1 25 125 201 739 2,626 163 18ARLINGTON TX 2000 21,480 21,535 14 96 595 1,452 3,141 14,106 2,076 55<strong>2001</strong> <strong>24</strong>,551 <strong>24</strong>,609 15 145 687 1,282 3,552 16,345 2,525 58ARVADA 2 CO 2000 3,401 3,443 0 <strong>24</strong> 31 60 459 2,541 286 42<strong>2001</strong> 3,785 3,825 1 23 37 130 466 2,783 345 40ATHENS-CLARKE COUNTY 1 GA 2000 6,868 5 37 157 221 1,096 4,985 367<strong>2001</strong> 6,857 6,892 10 26 156 261 1,069 4,956 379 35ATLANTA GA 2000 55,468 55,664 134 278 4,322 6,849 9,256 27,278 7,351 196<strong>2001</strong> 52,195 52,323 144 367 4,341 5,956 8,731 25,721 6,935 128AURORA CO 2000 15,568 15,660 22 165 473 853 1,926 9,516 2,613 92<strong>2001</strong> 16,968 17,072 17 203 488 933 1,849 10,481 2,997 104AURORA 3 IL 2000 15 185 586 1,139 3,557 460 39<strong>2001</strong> 8 256 605 1,064 3,672 356 32AUSTIN TX 2000 38,979 39,121 32 379 1,005 1,682 6,436 26,753 2,692 142<strong>2001</strong> 43,210 43,354 26 262 1,171 1,670 7,439 29,276 3,366 144BAKERSFIELD CA 2000 10,279 10,414 23 25 283 385 2,304 6,104 1,155 135<strong>2001</strong> 10,255 10,502 22 34 3<strong>24</strong> 460 2,035 6,226 1,154 <strong>24</strong>7BALTIMORE MD 2000 65,886 66,397 261 366 6,613 8,763 10,688 31,337 7,858 511<strong>2001</strong> 63,488 63,914 256 296 5,747 8,500 10,899 29,615 8,175 426BATON ROUGE LA 2000 21,858 22,098 58 89 1,186 1,238 4,<strong>24</strong>4 13,010 2,033 <strong>24</strong>0<strong>2001</strong> 20,149 20,318 46 62 1,071 1,368 3,716 12,128 1,758 169BEAUMONT TX 2000 8,<strong>24</strong>3 8,310 12 137 400 5<strong>24</strong> 1,551 5,025 594 67<strong>2001</strong> 8,845 8,904 10 158 361 585 1,692 5,512 527 59BELLEVUE WA 2000 4,511 4,554 0 17 60 62 470 3,397 505 43<strong>2001</strong> 4,667 4,702 0 21 59 82 535 3,431 539 35BERKELEY CA 2000 7,688 7,731 4 41 332 377 1,1<strong>24</strong> 4,889 921 43<strong>2001</strong> 9,195 9,<strong>24</strong>6 2 23 402 326 1,379 5,991 1,072 51BIRMINGHAM AL 2000 20,749 20,997 79 228 977 1,663 4,078 11,975 1,749 <strong>24</strong>8<strong>2001</strong> 21,085 21,336 73 206 1,084 1,664 4,079 11,928 2,051 251BOISE ID 2000 8,392 8,459 1 75 63 5<strong>24</strong> 1,354 5,986 389 67<strong>2001</strong> 8,621 8,688 2 83 77 466 1,320 6,097 576 67BOSTON 1 MA 2000 35,870 39 325 2,451 4,507 4,051 17,228 7,269<strong>2001</strong> 37,385 65 361 2,523 4,412 4,222 17,608 8,194BRIDGEPORT CT 2000 8,900 9,157 19 85 589 1,291 1,626 3,122 2,168 257<strong>2001</strong> 8,162 8,323 16 69 608 1,217 1,266 2,876 2,110 161BROWNSVILLE TX 2000 11,420 11,429 6 29 181 696 1,227 8,893 388 9<strong>2001</strong> 11,910 11,945 7 27 180 595 1,066 9,574 461 35BUFFALO 1 NY 2000 20,<strong>24</strong>8 20,600 39 176 1,555 1,887 4,194 9,831 2,566 352<strong>2001</strong> 19,895 65 229 1,600 1,816 3,965 9,669 2,551BURBANK CA 2000 3,172 3,175 1 8 86 202 420 1,902 553 3<strong>2001</strong> 3,377 3,387 3 7 122 198 503 2,013 531 10CAMBRIDGE 1 MA 2000 4,390 1 11 186 322 552 2,820 498<strong>2001</strong> 4,416 1 15 181 273 688 2,740 518CAPE CORAL FL 2000 3,630 3,695 0 16 32 165 736 2,460 221 65<strong>2001</strong> 3,670 3,701 2 13 34 297 855 2,293 176 31CARROLLTON TX 2000 3,709 3,750 0 8 68 132 781 2,406 314 41<strong>2001</strong> 3,842 3,865 2 2 52 135 802 2,491 358 23CEDAR RAPIDS IA 2000 6,297 6,313 1 37 95 220 1,033 4,577 334 16<strong>2001</strong> 7,473 7,492 3 57 99 <strong>24</strong>8 1,318 5,381 367 19CHARLOTTE-MECKLENBURG NC 2000 49,464 49,779 75 308 2,651 4,482 9,598 27,789 4,561 315<strong>2001</strong> 49,757 50,074 66 293 2,996 4,420 10,285 27,291 4,406 317CHATTANOOGA 2 TN 2000 18,001 18,103 17 109 770 1,841 3,273 9,660 2,331 102<strong>2001</strong> 19,295 19,373 15 85 765 1,927 3,268 11,027 2,208 78CHICAGO 3 IL 2000 631 19,345 26,545 28,327 106,127 29,727 1,062<strong>2001</strong> 666 18,433 25,533 25,966 97,496 27,694 1,004CHULA VISTA CA 2000 7,048 7,072 3 48 261 534 1,051 3,588 1,563 <strong>24</strong><strong>2001</strong> 7,644 7,702 8 69 <strong>24</strong>2 610 1,009 3,999 1,707 58CINCINNATI OH 2000 22,212 22,620 22 284 1,404 1,073 4,960 12,440 2,029 408<strong>2001</strong> 27,303 27,840 54 314 2,091 1,531 6,218 13,848 3,<strong>24</strong>7 537CLARKSVILLE 2 TN 2000 4,985 5,013 3 64 110 4<strong>24</strong> 783 3,319 282 28<strong>2001</strong> 6 57 90 370 652 3,435 9CLEARWATER FL 2000 5,794 5,819 6 52 175 632 1,111 3,427 391 25<strong>2001</strong> 6,642 6,682 4 56 230 736 1,188 3,979 449 40CLEVELAND OH 2000 32,584 33,114 71 615 3,084 2,271 7,435 12,969 6,139 530<strong>2001</strong> 33,065 33,604 77 6<strong>24</strong> 3,298 2,425 7,937 12,925 5,779 539COLORADO SPRINGS CO 2000 17,926 18,070 15 211 427 989 3,074 11,970 1,<strong>24</strong>0 144<strong>2001</strong> 18,752 18,889 14 228 463 1,142 3,035 12,504 1,366 137COLUMBIA SC 2000 10,069 10,103 12 69 505 925 1,204 6,588 766 34<strong>2001</strong> 10,673 10,712 16 61 458 952 1,482 6,699 1,005 39COLUMBUS GA 2000 11,880 11,884 19 <strong>24</strong> 439 590 1,771 7,982 1,055 4<strong>2001</strong> 12,145 12,156 11 18 440 5<strong>24</strong> 1,803 8,473 876 112
Modified<strong>Crime</strong> <strong>Crime</strong> For- Aggra- Motor<strong>Index</strong> <strong>Index</strong> Mur- cible Rob- vated Bur- Larceny- vehicletotal total der rape bery assault glary theft theft ArsonCOLUMBUS OH 2000 63,094 63,700 67 578 3,098 2,255 13,600 36,316 7,180 606<strong>2001</strong> 68,547 69,023 81 602 3,364 2,349 15,740 38,835 7,576 476CONCORD CA 2000 4,949 4,964 4 33 119 316 695 3,034 748 15<strong>2001</strong> 5,643 5,653 0 16 158 3<strong>24</strong> 750 3,563 832 10CORAL SPRINGS FL 2000 3,985 3,991 3 22 76 205 633 2,695 351 6<strong>2001</strong> 3,604 3,612 2 13 73 157 648 2,393 318 8CORONA CA 2000 3,612 3,635 6 35 123 162 700 2,009 577 23<strong>2001</strong> 4,218 4,239 3 19 149 153 681 2,500 713 21CORPUS CHRISTI TX 2000 20,009 20,179 17 193 437 1,457 3,537 12,979 1,389 170<strong>2001</strong> 22,534 22,658 19 2<strong>24</strong> 582 1,640 3,999 14,555 1,515 1<strong>24</strong>COSTA MESA CA 2000 3,462 3,472 2 22 72 179 437 2,266 484 10<strong>2001</strong> 4,021 4,036 4 28 155 203 554 2,595 482 15DALLAS TX 2000 105,050 106,430 231 633 7,046 8,132 20,300 50,777 17,931 1,380<strong>2001</strong> 111,006 112,661 <strong>24</strong>0 660 8,330 8,546 20,635 53,611 18,984 1,655DALY CITY CA 2000 2,128 2,140 1 <strong>24</strong> 115 188 158 1,274 368 12<strong>2001</strong> 2,300 2,308 5 25 146 175 213 1,253 483 8DAVENPORT IA 2000 8,037 8,091 5 50 216 1,340 1,236 4,816 374 54<strong>2001</strong> 9,098 9,155 4 56 200 1,230 1,510 5,644 454 57DAYTON OH 2000 16,456 16,669 32 152 1,180 701 3,749 7,435 3,207 213<strong>2001</strong> 16,952 17,154 30 152 1,090 796 4,018 7,497 3,369 202DENVER CO 2000 26,302 26,658 32 296 1,039 1,518 4,983 12,842 5,592 356<strong>2001</strong> 30,272 30,617 45 317 1,250 1,462 5,642 14,621 6,935 345DES MOINES IA 2000 13,688 13,761 14 99 291 313 1,729 10,280 962 73<strong>2001</strong> 12,610 12,676 11 89 298 352 1,301 9,549 1,010 66DOWNEY CA 2000 3,079 3,112 4 11 177 148 499 1,430 810 33<strong>2001</strong> 3,717 3,739 5 22 208 200 490 1,793 999 22DURHAM NC 2000 16,397 16,455 28 87 929 802 3,735 9,536 1,280 58<strong>2001</strong> 15,132 15,179 28 77 980 769 3,457 8,723 1,098 47ELIZABETH NJ 2000 7,062 7,072 11 18 558 280 906 3,236 2,053 10<strong>2001</strong> 7,164 7,175 5 16 548 279 912 3,403 2,001 11EL MONTE CA 2000 3,668 3,687 6 32 331 701 492 1,395 711 19<strong>2001</strong> 3,778 3,818 10 <strong>24</strong> 281 434 589 1,546 894 40EL PASO TX 2000 34,672 34,932 20 188 731 3,457 2,228 25,605 2,443 260<strong>2001</strong> 30,814 30,940 20 203 775 3,388 2,553 22,039 1,836 126ERIE PA 2000 3,837 3,888 5 54 219 189 694 2,453 223 51<strong>2001</strong> 4,269 4,317 4 52 227 203 734 2,828 221 48ESCONDIDO CA 2000 5,099 5,125 5 35 144 485 750 2,878 802 26<strong>2001</strong> 5,194 5,217 2 31 167 376 851 2,826 941 23EUGENE OR 2000 9,902 10,066 2 46 185 387 1,381 7,129 772 164<strong>2001</strong> 9,415 9,528 2 55 203 327 1,<strong>24</strong>7 6,893 688 113EVANSVILLE IN 2000 6,215 6,267 9 50 120 444 1,072 4,126 394 52<strong>2001</strong> 6,667 6,734 8 52 164 483 1,164 4,327 469 67FAYETTEVILLE NC 2000 9,197 9,237 21 64 470 188 2,4<strong>24</strong> 5,320 710 40<strong>2001</strong> 9,861 9,915 18 62 464 235 2,485 5,780 817 54FLINT MI 2000 11,007 11,189 36 106 492 1,194 2,4<strong>24</strong> 4,627 2,128 182<strong>2001</strong> 10,962 11,100 41 95 508 1,364 2,695 4,291 1,968 138FONTANA CA 2000 4,067 4,100 13 52 263 571 873 1,282 1,013 33<strong>2001</strong> 3,969 4,008 10 41 234 625 746 1,297 1,016 39FORT COLLINS CO 2000 4,876 4,900 0 67 37 263 679 3,619 211 <strong>24</strong><strong>2001</strong> 4,696 4,732 1 86 35 <strong>24</strong>8 662 3,448 216 36FORT LAUDERDALE FL 2000 12,782 12,841 13 66 760 923 2,259 7,363 1,398 59<strong>2001</strong> 12,581 12,631 29 48 837 767 2,439 7,049 1,412 50FORT WAYNE IN 2000 12,115 12,213 20 90 420 290 1,819 8,220 1,256 98<strong>2001</strong> 13,291 13,402 23 92 609 348 2,013 9,016 1,190 111FORT WORTH TX 2000 38,143 38,408 61 325 1,314 2,116 7,251 22,991 4,085 265<strong>2001</strong> 40,466 40,771 67 332 1,389 2,076 7,971 <strong>24</strong>,675 3,956 305FREMONT CA 2000 5,309 5,354 3 27 108 <strong>24</strong>9 1,025 3,415 482 45<strong>2001</strong> 6,152 6,193 0 19 144 236 1,000 4,045 708 41FRESNO CA 2000 32,868 33,332 <strong>24</strong> 161 1,304 2,354 4,514 18,732 5,779 464<strong>2001</strong> 34,681 35,229 40 202 1,362 2,492 5,203 18,398 6,984 548FULLERTON CA 2000 4,098 4,120 3 20 126 163 653 2,655 478 22<strong>2001</strong> 4,555 4,580 3 25 157 184 719 2,914 553 25GARDEN GROVE CA 2000 5,140 5,178 4 45 255 422 728 2,895 791 38<strong>2001</strong> 5,176 5,214 5 32 302 460 681 2,785 911 38GARLAND TX 2000 8,673 8,720 4 35 204 228 1,842 5,323 1,037 47<strong>2001</strong> 9,568 9,625 9 45 274 264 2,141 5,802 1,033 57GARY 1 IN 2000 6,301 67 67 543 386 1,667 2,202 1,369<strong>2001</strong> 6,133 83 77 461 281 1,742 2,<strong>24</strong>9 1,<strong>24</strong>0GILBERT AZ 2000 3,766 3,783 0 21 36 66 1,273 2,147 223 17<strong>2001</strong> 4,651 4,687 0 21 46 62 1,464 2,663 395 36GLENDALE AZ 2000 14,521 14,592 12 98 341 857 2,607 8,396 2,210 71<strong>2001</strong> 14,410 14,482 17 66 426 705 2,509 7,531 3,156 72GLENDALE CA 2000 4,909 4,948 6 20 182 518 896 2,480 807 39<strong>2001</strong> 4,491 4,537 5 22 180 235 987 2,313 749 46GRAND PRAIRIE TX 2000 6,521 6,570 8 59 109 270 1,019 4,004 1,052 49<strong>2001</strong> 6,928 6,982 6 51 128 199 1,095 4,278 1,171 54GRAND RAPIDS MI 2000 12,945 13,056 17 57 594 1,446 2,612 7,359 860 111<strong>2001</strong> 12,026 12,092 12 53 552 1,431 2,582 6,719 677 66GREEN BAY WI 2000 3,478 3,495 1 36 64 211 658 2,321 187 17<strong>2001</strong> 3,711 3,722 2 35 36 198 675 2,561 204 11GREENSBORO NC 2000 14,973 15,046 21 89 895 887 2,964 9,008 1,109 73<strong>2001</strong> 15,962 16,041 20 89 896 864 3,258 9,871 964 79HAMPTON VA 2000 5,608 5,636 9 40 215 222 869 3,642 611 28<strong>2001</strong> 6,807 6,845 10 35 284 276 989 4,122 1,091 38HARTFORD CT 2000 11,220 11,359 17 53 862 558 1,630 6,001 2,099 139<strong>2001</strong> 10,789 10,931 25 64 889 615 1,569 5,798 1,829 142HAYWARD 2 CA 2000 5,667 5,711 9 55 215 495 664 3,018 1,211 44<strong>2001</strong> 5,525 5,586 10 43 275 213 851 2,784 1,349 613
Modified<strong>Crime</strong> <strong>Crime</strong> For- Aggra- Motor<strong>Index</strong> <strong>Index</strong> Mur- cible Rob- vated Bur- Larceny- vehicletotal total der rape bery assault glary theft theft ArsonHENDERSON NV 2000 5,587 5,617 8 105 193 159 1,367 2,949 806 30<strong>2001</strong> 5,728 5,759 9 99 195 220 1,434 2,863 908 31HIALEAH FL 2000 13,946 13,998 8 48 499 1,114 1,865 7,636 2,776 52<strong>2001</strong> 12,<strong>24</strong>8 12,312 9 40 461 1,059 1,596 6,513 2,570 64HOLLYWOOD FL 2000 9,616 9,652 3 52 4<strong>24</strong> 602 1,266 6,056 1,213 36<strong>2001</strong> 9,250 9,291 7 51 393 592 1,235 5,834 1,138 41HONOLULU HI 2000 46,659 46,983 20 <strong>24</strong>0 984 1,058 6,946 32,197 5,214 3<strong>24</strong><strong>2001</strong> 48,442 48,838 20 293 999 1,141 7,340 33,052 5,597 396HOUSTON TX 2000 131,711 133,353 230 813 8,256 12,192 23,254 67,102 19,864 1,642<strong>2001</strong> 141,987 143,745 267 945 9,921 12,286 25,108 69,371 <strong>24</strong>,089 1,758HUNTINGTON BEACH CA 2000 4,526 4,561 0 31 93 254 959 2,698 491 35<strong>2001</strong> 4,500 4,548 0 44 94 205 1,002 2,608 547 48HUNTSVILLE 4 AL 2000<strong>2001</strong> 11,413 11,454 15 109 345 570 1,802 7,802 770 41INDEPENDENCE MO 2000 7,983 8,043 2 34 129 453 1,041 5,653 671 60<strong>2001</strong> 8,889 8,942 6 27 144 491 1,157 6,220 844 53INDIANAPOLIS IN 2000 37,389 37,695 96 443 2,551 3,753 8,095 16,466 5,985 306<strong>2001</strong> 41,058 41,337 112 442 2,787 4,087 9,043 18,2<strong>24</strong> 6,363 279INGLEWOOD CA 2000 4,668 4,706 23 52 575 726 803 1,576 913 38<strong>2001</strong> 4,586 4,622 38 36 639 610 839 1,550 874 36IRVINE CA 2000 3,208 3,231 1 20 53 147 773 1,925 289 23<strong>2001</strong> 3,396 3,403 0 9 44 80 904 2,054 305 7IRVING TX 2000 9,025 9,073 10 51 225 498 1,<strong>24</strong>5 6,013 983 48<strong>2001</strong> 9,993 10,037 10 58 281 467 1,387 6,561 1,229 44JACKSON MS 2000 19,688 19,767 39 193 1,1<strong>24</strong> 560 4,715 9,794 3,263 79<strong>2001</strong> 18,586 18,682 50 218 1,044 654 4,683 8,972 2,965 96JACKSONVILLE FL 2000 51,072 51,398 79 443 2,022 5,662 9,955 28,378 4,533 326<strong>2001</strong> 51,250 51,576 75 287 2,195 4,831 9,903 28,827 5,132 326JERSEY CITY NJ 2000 12,437 12,503 17 74 1,237 1,528 2,465 4,682 2,434 66<strong>2001</strong> 12,526 12,574 <strong>24</strong> 89 1,301 1,438 2,350 4,911 2,413 48JOLIET 3, 4 IL 2000<strong>2001</strong> 5 209 477 887 3,128 387 65KANSAS CITY MO 2000 47,125 47,594 113 310 2,265 4,493 7,562 25,167 7,215 469<strong>2001</strong> 49,959 50,452 103 319 2,367 4,292 7,454 27,126 8,298 493KNOXVILLE TN 2000 10,771 10,891 23 81 578 1,178 1,583 5,932 1,396 120<strong>2001</strong> 11,058 11,199 15 138 637 1,313 1,715 5,940 1,300 141LAFAYETTE LA 2000 8,259 8,277 3 82 182 589 1,292 5,536 575 18<strong>2001</strong> 8,167 8,208 5 74 195 771 1,332 5,318 472 41LAKEWOOD CO 2000 7,479 7,543 6 73 134 220 1,099 5,172 775 64<strong>2001</strong> 8,487 8,545 7 88 166 239 1,041 5,861 1,085 58LANCASTER CA 2000 4,323 4,386 5 63 230 878 1,049 1,674 4<strong>24</strong> 63<strong>2001</strong> 4,747 4,802 7 56 263 837 1,159 1,909 516 55LANSING MI 2000 6,883 6,958 14 120 171 914 1,110 4,133 421 75<strong>2001</strong> 7,212 7,280 8 178 227 940 994 4,382 483 68LAREDO TX 2000 13,384 13,461 10 65 181 716 1,749 9,875 788 77<strong>2001</strong> 13,056 13,143 8 39 200 874 1,791 9,125 1,019 87LAS VEGAS METROPOLITAN POLICE DEPT. NV 2000 47,408 47,653 90 443 3,366 2,450 9,535 22,094 9,430 <strong>24</strong>5<strong>2001</strong> 50,571 50,839 134 447 3,667 3,302 10,083 22,394 10,544 268LEXINGTON 2 KY 2000 13,657 13,722 11 115 599 1,163 2,164 8,837 768 65<strong>2001</strong> 13,032 13,090 <strong>24</strong> 120 721 718 2,516 8,155 778 58LINCOLN NE 2000 14,161 14,184 3 95 147 956 1,974 10,475 511 23<strong>2001</strong> 15,041 15,067 6 88 154 1,054 1,970 11,194 575 26LITTLE ROCK AR 2000 17,551 17,658 31 132 536 1,188 3,252 11,116 1,296 107<strong>2001</strong> 16,866 17,034 34 92 617 1,130 3,630 9,841 1,522 168LIVONIA 1 MI 2000 3,042 0 22 63 105 446 2,122 284<strong>2001</strong> 3,113 3,136 1 21 71 112 429 2,202 277 23LONG BEACH CA 2000 17,667 17,929 49 114 1,519 1,534 3,160 7,714 3,577 262<strong>2001</strong> 18,467 18,734 49 125 1,417 1,822 3,232 7,876 3,946 267LOS ANGELES CA 2000 180,538 182,883 550 1,459 15,527 32,705 <strong>24</strong>,422 76,235 29,640 2,345<strong>2001</strong> 189,276 191,6<strong>24</strong> 586 1,409 17,166 33,080 25,695 79,521 31,819 2,348LOUISVILLE KY 2000 15,061 15,334 39 68 1,079 853 3,202 7,512 2,308 273<strong>2001</strong> 15,673 15,922 25 78 989 823 3,390 7,934 2,434 <strong>24</strong>9LOWELL 1 MA 2000 4,070 6 45 131 626 686 1,765 811<strong>2001</strong> 4,510 4 37 122 687 650 2,052 958LUBBOCK TX 2000 14,493 14,562 12 141 <strong>24</strong>8 2,107 2,648 8,734 603 69<strong>2001</strong> 14,063 14,129 10 100 317 2,042 2,847 8,068 679 66MACON GA 2000 10,926 10,979 14 62 302 397 2,259 6,601 1,291 53<strong>2001</strong> 10,591 10,651 19 60 275 351 2,291 6,272 1,323 60MADISON WI 2000 7,985 8,090 3 71 286 321 1,267 5,365 672 105<strong>2001</strong> 8,218 8,293 5 63 295 344 1,354 5,450 707 75MANCHESTER NH 2000 3,935 3,988 2 41 145 54 603 2,683 407 53<strong>2001</strong> 3,520 3,573 0 53 118 86 597 2,356 310 53MCALLEN TX 2000 8,740 8,773 2 3 116 268 1,365 6,136 850 33<strong>2001</strong> 8,989 9,021 3 11 1<strong>24</strong> 336 1,567 6,235 713 32MEMPHIS 2 TN 2000<strong>2001</strong> 65,435 65,697 156 482 4,337 5,883 15,867 29,180 9,530 262MESA AZ 2000 25,525 25,587 15 120 433 1,825 3,720 15,982 3,430 62<strong>2001</strong> 27,508 27,544 17 106 452 1,941 4,313 16,121 4,558 36MESQUITE TX 2000 6,059 6,153 2 2 109 314 594 4,325 713 94<strong>2001</strong> 6,542 6,644 4 3 147 312 646 4,554 876 102MIAMI FL 2000 39,756 40,000 66 118 3,077 4,616 7,303 18,854 5,722 <strong>24</strong>4<strong>2001</strong> 35,291 35,555 66 118 2,719 4,307 6,218 16,635 5,228 264MIAMI BEACH FL 2000 12,393 12,406 6 61 543 713 1,669 8,077 1,3<strong>24</strong> 13<strong>2001</strong> 11,217 11,234 6 66 484 685 1,607 7,000 1,369 17MIDLAND TX 2000 3,301 3,316 5 69 54 267 683 2,074 149 15<strong>2001</strong> 3,183 3,194 2 91 50 264 690 1,912 174 11MILWAUKEE WI 2000 44,092 44,616 122 303 3,021 2,265 6,363 23,949 8,069 5<strong>24</strong><strong>2001</strong> 45,749 46,202 128 295 2,913 2,128 6,680 25,712 7,893 4534
Modified<strong>Crime</strong> <strong>Crime</strong> For- Aggra- Motor<strong>Index</strong> <strong>Index</strong> Mur- cible Rob- vated Bur- Larceny- vehicletotal total der rape bery assault glary theft theft ArsonMINNEAPOLIS MN 2000 27,489 27,750 50 422 1,948 1,984 4,514 14,788 3,783 261<strong>2001</strong> 26,820 27,079 43 399 1,943 1,716 4,092 14,548 4,079 259MISSION VIEJO CA 2000 1,433 1,439 0 7 31 96 272 957 70 6<strong>2001</strong> 1,426 1,432 3 9 20 92 211 994 97 6MOBILE AL 2000 17,614 17,674 20 54 896 526 3,609 10,985 1,5<strong>24</strong> 60<strong>2001</strong> 19,875 19,967 42 95 840 552 4,653 12,284 1,409 92MODESTO CA 2000 10,663 10,892 3 59 297 608 1,760 6,706 1,230 229<strong>2001</strong> 11,887 12,007 17 105 383 607 1,827 7,542 1,406 120MONTGOMERY 1 AL 2000 16,261 16,373 31 113 605 814 3,467 9,795 1,436 112<strong>2001</strong> 15,791 26 102 652 676 3,252 9,928 1,155MORENO VALLEY CA 2000 6,302 6,321 1 42 261 828 1,708 2,637 825 19<strong>2001</strong> 6,588 6,609 3 33 312 853 1,635 2,869 883 21NAPERVILLE 3 IL 2000 0 14 85 275 1,823 83 15<strong>2001</strong> 0 25 67 254 2,057 74 <strong>24</strong>NASHVILLE TN 2000 48,716 48,912 72 406 2,250 6,250 7,646 26,766 5,326 196<strong>2001</strong> 48,379 48,601 60 385 2,458 5,938 7,667 26,617 5,254 222NEWARK NJ 2000 19,663 19,880 58 95 1,923 2,016 2,765 7,364 5,442 217<strong>2001</strong> 18,748 19,163 90 91 1,837 1,819 2,552 6,3<strong>24</strong> 6,035 415NEW HAVEN CT 2000 9,784 9,828 18 63 660 974 1,488 5,267 1,314 44<strong>2001</strong> 9,844 9,865 19 56 768 1,072 1,348 5,190 1,391 21NEW ORLEANS 1 LA 2000 34,001 34,208 204 227 2,421 2,478 5,230 15,575 7,866 207<strong>2001</strong> 36,056 212 209 2,778 2,677 5,262 16,187 8,731NEWPORT NEWS VA 2000 9,995 10,101 20 96 450 781 1,461 5,980 1,207 106<strong>2001</strong> 9,772 9,882 30 96 448 750 1,507 5,779 1,162 110NEW YORK 1, 5, 6 NY 2000 288,311 673 1,630 32,558 40,831 37,112 139,661 35,846<strong>2001</strong> 266,594 3,479 1,530 28,202 37,893 31,563 133,938 29,989NORFOLK VA 2000 15,985 16,016 44 128 769 727 2,302 10,261 1,754 31<strong>2001</strong> 14,950 14,974 31 126 810 633 1,725 10,113 1,512 <strong>24</strong>NORTH LAS VEGAS NV 2000 6,864 6,919 10 39 402 746 1,200 3,188 1,279 55<strong>2001</strong> 6,817 6,857 20 50 433 850 1,336 2,8<strong>24</strong> 1,304 40NORWALK CA 2000 3,090 3,115 3 25 201 422 484 1,197 758 25<strong>2001</strong> 3,656 3,677 7 19 219 556 544 1,436 875 21OAKLAND CA 2000 25,060 25,350 80 320 1,929 2,709 3,506 11,652 4,864 290<strong>2001</strong> 27,627 27,955 84 295 2,125 2,826 3,696 13,081 5,520 328OCEANSIDE CA 2000 5,853 5,878 3 85 186 577 1,140 3,293 569 25<strong>2001</strong> 5,887 5,931 4 86 258 722 1,071 3,074 672 44OKLAHOMA CITY OK 2000 47,845 48,061 38 388 990 2,535 7,280 33,012 3,602 216<strong>2001</strong> 45,875 46,097 45 405 1,090 2,643 8,405 29,771 3,516 222OMAHA NE 2000 26,819 27,049 37 189 875 2,063 3,373 16,902 3,380 230<strong>2001</strong> 29,507 29,762 25 157 868 1,658 3,107 19,382 4,310 255ONTARIO CA 2000 7,653 7,752 15 68 318 725 1,1<strong>24</strong> 3,907 1,496 99<strong>2001</strong> 8,546 8,641 10 74 388 717 1,082 4,432 1,843 95ORANGE CA 2000 3,349 3,414 2 17 83 232 512 2,077 426 65<strong>2001</strong> 3,692 3,729 0 18 125 209 467 2,435 438 37ORLANDO FL 2000 22,369 22,414 21 141 1,044 2,720 3,423 12,607 2,413 45<strong>2001</strong> 22,363 22,4<strong>24</strong> 15 135 1,086 2,449 3,529 12,842 2,307 61OXNARD CA 2000 5,661 5,702 9 60 375 420 9<strong>24</strong> 3,417 456 41<strong>2001</strong> 5,250 5,298 6 38 393 375 917 3,062 459 48PALMDALE CA 2000 4,392 4,430 6 39 179 757 928 1,982 501 38<strong>2001</strong> 4,312 4,355 8 48 178 673 896 1,932 577 43PASADENA CA 2000 5,637 5,696 4 28 311 389 1,026 3,388 491 59<strong>2001</strong> 5,<strong>24</strong>0 5,286 4 34 268 370 899 3,157 508 46PASADENA TX 2000 6,342 6,431 1 29 116 397 1,275 3,849 675 89<strong>2001</strong> 6,919 6,997 3 52 153 555 1,270 4,057 829 78PATERSON NJ 2000 6,443 6,454 17 <strong>24</strong> 580 583 1,307 2,601 1,331 11<strong>2001</strong> 8,004 8,014 16 15 673 598 1,964 3,059 1,679 10PEMBROKE PINES FL 2000 3,853 3,862 2 25 94 281 614 2,281 556 9<strong>2001</strong> 5,079 5,088 3 14 130 203 620 3,470 639 9PEORIA AZ 2000 4,950 4,975 4 27 45 189 1,180 2,780 725 25<strong>2001</strong> 5,332 5,347 3 22 73 <strong>24</strong>2 1,102 3,018 872 15PEORIA 3 IL 2000 9 359 552 2,051 6,403 880 92<strong>2001</strong> 14 345 536 1,840 5,649 932 105PHILADELPHIA 1 PA 2000 98,000 100,581 319 1,021 10,425 11,047 12,089 46,952 16,147 2,581<strong>2001</strong> 93,878 309 1,014 9,604 10,477 11,629 45,318 15,527PHOENIX AZ 2000 97,498 97,753 152 422 3,763 5,417 15,860 52,418 19,466 255<strong>2001</strong> 104,976 105,397 210 400 4,629 5,294 16,673 55,190 22,580 421PITTSBURGH PA 2000 19,456 19,606 37 128 1,585 1,517 3,153 10,533 2,503 150<strong>2001</strong> 19,708 19,881 55 134 1,384 1,391 3,<strong>24</strong>6 10,766 2,732 173PLANO TX 2000 7,870 7,912 5 21 115 482 1,475 5,391 381 42<strong>2001</strong> 8,987 9,032 4 23 113 448 1,417 6,440 542 45POMONA CA 2000 5,862 5,907 23 33 343 976 892 2,464 1,131 45<strong>2001</strong> 6,131 6,158 19 54 418 1,046 951 2,489 1,154 27PORTLAND OR 2000 40,943 41,454 19 369 1,446 3,864 5,560 <strong>24</strong>,970 4,715 511<strong>2001</strong> 43,182 43,567 20 305 1,267 2,963 5,592 28,358 4,677 385PORTSMOUTH VA 2000 6,537 6,563 21 30 402 533 1,366 3,428 757 26<strong>2001</strong> 6,642 6,657 12 30 473 583 1,515 3,363 666 15PROVIDENCE RI 2000 12,840 13,205 30 82 552 506 2,289 6,617 2,764 365<strong>2001</strong> 14,185 14,529 23 111 595 714 2,284 7,387 3,071 344PROVO UT 2000 4,041 4,071 0 46 26 59 680 3,046 184 30<strong>2001</strong> 3,687 3,708 0 42 17 100 510 2,866 152 21PUEBLO CO 2000 5,194 5,208 6 83 116 777 806 3,148 258 14<strong>2001</strong> 6,466 6,526 5 49 146 608 1,131 4,170 357 60RALEIGH NC 2000 19,4<strong>24</strong> 19,495 26 89 769 1,165 4,033 11,904 1,438 71<strong>2001</strong> 18,585 18,686 10 91 804 1,282 3,983 11,087 1,328 101RANCHO CUCAMONGA CA 2000 3,509 3,534 6 14 115 122 813 1,982 457 25<strong>2001</strong> 3,805 3,841 1 17 123 156 811 2,089 608 36RENO 1,2 NV 2000 9,965 10,043 9 104 381 402 1,736 6,563 770 78<strong>2001</strong> 10,989 6 98 407 704 1,435 7,399 9405
Modified<strong>Crime</strong> <strong>Crime</strong> For- Aggra- Motor<strong>Index</strong> <strong>Index</strong> Mur- cible Rob- vated Bur- Larceny- vehicletotal total der rape bery assault glary theft theft ArsonRICHMOND 2 CA 2000 29 37 400 734 1,<strong>24</strong>8 3,496 93<strong>2001</strong> 7,190 7,285 18 47 410 540 1,230 3,448 1,497 95RICHMOND VA 2000 17,322 17,492 73 125 1,163 1,162 2,884 9,140 2,775 170<strong>2001</strong> 18,146 18,311 70 114 1,419 1,125 2,939 9,422 3,057 165RIVERSIDE CA 2000 12,228 12,480 17 86 611 1,292 2,122 6,250 1,850 252<strong>2001</strong> 14,513 14,733 20 95 622 1,422 2,220 7,896 2,238 220ROCHESTER 1 NY 2000 17,250 17,531 39 107 936 550 2,777 10,409 2,432 281<strong>2001</strong> 16,156 40 84 921 618 2,459 9,719 2,315ROCKFORD 3 IL 2000 11 505 695 2,458 7,879 869 43<strong>2001</strong> 11 446 672 2,502 8,143 1,017 34SACRAMENTO CA 2000 27,338 27,705 39 147 1,412 1,519 4,661 14,690 4,870 367<strong>2001</strong> 30,690 31,130 39 169 1,440 1,660 5,068 15,977 6,337 440SALEM OR 2000 9,983 10,004 5 74 177 81 1,259 7,629 758 21<strong>2001</strong> 11,120 11,147 4 81 160 88 1,395 8,515 877 27SALINAS CA 2000 6,457 6,520 18 62 448 734 808 3,760 627 63<strong>2001</strong> 6,979 7,032 15 56 399 799 843 4,102 765 53SALT LAKE CITY UT 2000 16,831 16,928 10 137 576 578 2,169 11,828 1,533 97<strong>2001</strong> 16,438 16,503 18 121 481 546 2,209 11,401 1,662 65SAN ANTONIO TX 2000 86,332 86,986 85 456 1,699 5,668 11,604 60,952 5,868 654<strong>2001</strong> 96,498 97,074 100 492 2,146 6,808 14,018 66,694 6,<strong>24</strong>0 576SAN BERNARDINO CA 2000 11,870 12,004 32 99 663 1,310 2,201 5,599 1,966 134<strong>2001</strong> 12,803 12,942 30 89 829 1,449 2,299 5,868 2,239 139SAN DIEGO CA 2000 46,359 46,563 54 349 1,777 4,980 6,717 23,015 9,467 204<strong>2001</strong> 50,445 50,646 51 342 1,729 5,284 7,219 25,050 10,770 201SANDY UT 2000 3,170 3,193 5 23 25 93 519 2,389 116 23<strong>2001</strong> 3,361 3,375 2 22 37 82 536 2,516 166 14SAN JOSE CA 2000 22,808 23,196 19 337 677 3,895 2,670 12,595 2,615 388<strong>2001</strong> 25,053 25,550 23 329 712 4,390 2,939 13,567 3,093 497SANTA ANA CA 2000 10,452 10,708 17 86 889 837 1,<strong>24</strong>7 5,3<strong>24</strong> 2,052 256<strong>2001</strong> 12,066 12,269 <strong>24</strong> 55 942 823 1,396 6,263 2,563 203SANTA CLARA CA 2000 3,121 3,175 0 6 33 253 514 2,035 280 54<strong>2001</strong> 3,350 3,395 0 20 45 217 420 2,412 236 45SANTA CLARITA CA 2000 2,681 2,741 0 25 83 227 595 1,501 250 60<strong>2001</strong> 3,161 3,214 3 23 79 210 662 1,831 353 53SANTA ROSA CA 2000 5,289 5,340 2 71 129 344 823 3,505 415 51<strong>2001</strong> 5,854 5,899 3 72 123 309 773 4,050 5<strong>24</strong> 45SAVANNAH GA 2000 11,093 11,132 31 84 796 504 1,793 5,934 1,951 39<strong>2001</strong> 12,458 12,511 26 70 840 602 2,080 7,400 1,440 53SCOTTSDALE AZ 2000 9,303 9,333 8 53 115 395 2,332 5,230 1,170 30<strong>2001</strong> 9,905 9,963 10 58 196 355 2,660 5,251 1,375 58SEATTLE WA 2000 45,300 45,472 36 181 1,653 2,463 6,157 26,4<strong>24</strong> 8,386 172<strong>2001</strong> 46,091 46,307 25 164 1,594 2,367 6,684 26,502 8,755 216SHREVEPORT LA 2000 17,059 17,170 54 98 570 1,153 3,183 10,996 1,005 111<strong>2001</strong> 15,616 15,746 31 111 534 1,253 3,368 9,200 1,119 130SIMI VALLEY CA 2000 1,683 1,704 1 13 45 75 389 1,036 1<strong>24</strong> 21<strong>2001</strong> 1,746 1,759 6 11 37 99 361 1,040 192 13SIOUX FALLS SD 2000 4,287 4,319 2 81 55 263 603 3,049 234 32<strong>2001</strong> 4,130 4,168 2 76 38 208 681 2,943 182 38SOUTH BEND IN 2000 8,496 8,557 12 68 388 329 1,930 5,049 720 61<strong>2001</strong> 9,122 9,179 21 78 487 302 1,932 5,603 699 57SPOKANE WA 2000 16,317 16,387 8 69 370 787 2,969 10,819 1,295 70<strong>2001</strong> 17,073 17,123 7 79 440 883 3,101 10,792 1,771 50SPRINGFIELD 3 IL 2000 6 293 823 1,843 5,145 284 53<strong>2001</strong> 14 216 728 1,722 5,194 402 32SPRINGFIELD MA 2000 12,589 12,751 8 136 455 2,192 2,151 5,932 1,715 162<strong>2001</strong> 12,799 12,955 11 99 503 2,665 2,697 5,087 1,737 156SPRINGFIELD MO 2000 13,351 13,461 4 65 285 488 2,279 9,367 863 110<strong>2001</strong> 14,141 14,234 10 60 262 657 2,182 10,066 904 93STAMFORD CT 2000 3,065 3,076 1 9 122 155 297 2,072 409 11<strong>2001</strong> 3,086 3,092 1 13 141 116 357 2,095 363 6STERLING HEIGHTS MI 2000 3,613 3,637 0 17 25 214 311 2,796 250 <strong>24</strong><strong>2001</strong> 3,552 3,562 0 20 37 203 387 2,631 274 10ST. LOUIS MO 2000 50,653 51,449 1<strong>24</strong> 112 3,2<strong>24</strong> 4,476 8,020 26,862 7,835 796<strong>2001</strong> 52,635 53,346 148 120 3,140 4,256 8,128 28,000 8,843 711STOCKTON CA 2000 16,849 16,991 30 114 1,049 1,779 2,500 9,259 2,118 142<strong>2001</strong> 19,325 19,440 30 137 1,007 2,085 2,780 10,328 2,958 115ST. PAUL MN 2000 18,719 18,934 20 223 758 1,392 3,097 11,233 1,996 215<strong>2001</strong> 19,046 19,282 9 221 680 1,326 3,009 11,457 2,344 236ST. PETERSBURG FL 2000 20,404 20,562 14 173 990 2,852 3,538 10,738 2,099 158<strong>2001</strong> 20,534 20,677 21 149 1,147 3,059 3,678 10,418 2,062 143SUNNYVALE CA 2000 2,638 2,663 1 17 43 130 308 1,952 187 25<strong>2001</strong> 2,698 2,715 0 18 59 103 289 1,995 234 17SYRACUSE NY 2000 9,130 9,227 18 47 452 1,048 1,846 4,941 778 97<strong>2001</strong> 9,301 9,405 15 38 567 9<strong>24</strong> 1,795 5,099 863 104TACOMA WA 2000 18,605 18,733 15 136 745 1,501 2,835 10,360 3,013 128<strong>2001</strong> 18,370 18,493 15 143 743 1,211 2,920 10,033 3,305 123TALLAHASSEE FL 2000 12,570 12,590 8 98 423 1,295 2,428 7,569 749 20<strong>2001</strong> 12,151 12,178 7 127 428 1,<strong>24</strong>7 2,265 7,227 850 27TAMPA FL 2000 33,666 33,884 38 235 2,183 3,925 6,177 15,336 5,772 218<strong>2001</strong> 34,848 35,047 34 212 2,359 4,011 6,096 15,586 6,550 199TEMPE AZ 2000 15,208 15,<strong>24</strong>6 13 80 297 588 2,2<strong>24</strong> 9,711 2,295 38<strong>2001</strong> 16,534 16,571 5 72 327 533 2,273 10,497 2,827 37THOUSAND OAKS CA 2000 1,940 1,964 3 23 37 120 326 1,286 145 <strong>24</strong><strong>2001</strong> 1,887 1,907 1 10 33 129 308 1,276 130 20TOLEDO 2 OH 2000 <strong>24</strong>,027 <strong>24</strong>,412 12 163 1,030 1,175 5,105 13,805 2,737 385<strong>2001</strong> 27,043 27,416 17 185 1,314 1,527 6,298 13,979 3,723 373TOPEKA 1, 2 KS 2000 13,056 18 61 472 727 2,727 8,067 984<strong>2001</strong> 11,526 11,544 18 84 358 611 2,046 7,632 777 186
U.S. Department <strong>of</strong> JusticeFederal Bureau <strong>of</strong> Investigation1000 Custer Hollow RoadClarksburg, WV 26306-0002PRST STDPOSTAGE & FEES PAIDFederal Bureau <strong>of</strong> InvestigationPermit No. G-168Official BusinessPenalty for Private Use $300FOR RELEASE<strong>June</strong> <strong>24</strong>, <strong>2002</strong>PLEASE NOTEFigures used in this report are submitted voluntarily by law enforcement agencies throughout the country.Individuals using these tabulations are cautioned against drawing conclusions by making direct comparisonsbetween cities due to the many factors which affect the amount and type <strong>of</strong> crime from placeto place. Some <strong>of</strong> these factors are listed in the annual <strong>Crime</strong> in the United States. More valid use canbe made <strong>of</strong> these figures by determining deviations from national averages and through comparisonswith averages for cities in similar population groups (Table 1). It is important to remember that crimeis a social problem and, therefore, a concern <strong>of</strong> the entire community. <strong>The</strong> efforts <strong>of</strong> law enforcementare limited to factors within its control. Data users can obtain assistance by calling 304-625-4995.Data users are cautioned against comparisons <strong>of</strong> crime trends presented in this report and thoseestimated by the National <strong>Crime</strong> Victimization Survey (NCVS), administered by the Bureau <strong>of</strong> JusticeStatistics. Because <strong>of</strong> differences in methodology and crime coverage, the two programs examinethe Nation’s crime problem from somewhat different perspectives, and their results are not strictlycomparable. <strong>The</strong> definitional and procedural differences can account for many <strong>of</strong> the apparentdiscrepancies in results from the two programs. <strong>The</strong> Department <strong>of</strong> Justice fact sheet, “<strong>The</strong> Nation’sTwo <strong>Crime</strong> Measures,” contains a detailed description <strong>of</strong> the NCVS and Uniform <strong>Crime</strong> Reports.