2010 first half year results volume momentum sustained - Unilever
2010 first half year results volume momentum sustained - Unilever
2010 first half year results volume momentum sustained - Unilever

You also want an ePaper? Increase the reach of your titles
YUMPU automatically turns print PDFs into web optimized ePapers that Google loves.
<strong>2010</strong> FIRST HALF YEAR RESULTS<br />
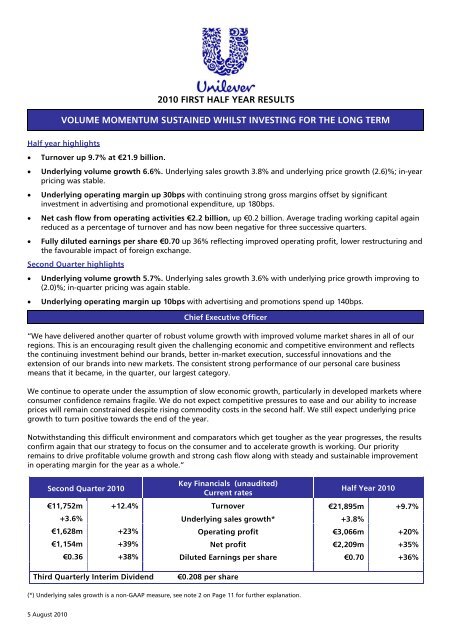
VOLUME MOMENTUM SUSTAINED WHILST INVESTING FOR THE LONG TERM<br />
Half <strong>year</strong> highlights<br />
• Turnover up 9.7% at €21.9 billion.<br />
• Underlying <strong>volume</strong> growth 6.6%. Underlying sales growth 3.8% and underlying price growth (2.6)%; in-<strong>year</strong><br />
pricing was stable.<br />
• Underlying operating margin up 30bps with continuing strong gross margins offset by significant<br />
investment in advertising and promotional expenditure, up 180bps.<br />
• Net cash flow from operating activities €2.2 billion, up €0.2 billion. Average trading working capital again<br />
reduced as a percentage of turnover and has now been negative for three successive quarters.<br />
• Fully diluted earnings per share €0.70 up 36% reflecting improved operating profit, lower restructuring and<br />
the favourable impact of foreign exchange.<br />
Second Quarter highlights<br />
• Underlying <strong>volume</strong> growth 5.7%. Underlying sales growth 3.6% with underlying price growth improving to<br />
(2.0)%; in-quarter pricing was again stable.<br />
• Underlying operating margin up 10bps with advertising and promotions spend up 140bps.<br />
Chief Executive Officer<br />
“We have delivered another quarter of robust <strong>volume</strong> growth with improved <strong>volume</strong> market shares in all of our<br />
regions. This is an encouraging result given the challenging economic and competitive environment and reflects<br />
the continuing investment behind our brands, better in-market execution, successful innovations and the<br />
extension of our brands into new markets. The consistent strong performance of our personal care business<br />
means that it became, in the quarter, our largest category.<br />
We continue to operate under the assumption of slow economic growth, particularly in developed markets where<br />
consumer confidence remains fragile. We do not expect competitive pressures to ease and our ability to increase<br />
prices will remain constrained despite rising commodity costs in the second <strong>half</strong>. We still expect underlying price<br />
growth to turn positive towards the end of the <strong>year</strong>.<br />
Notwithstanding this difficult environment and comparators which get tougher as the <strong>year</strong> progresses, the <strong>results</strong><br />
confirm again that our strategy to focus on the consumer and to accelerate growth is working. Our priority<br />
remains to drive profitable <strong>volume</strong> growth and strong cash flow along with steady and sustainable improvement<br />
in operating margin for the <strong>year</strong> as a whole.”<br />
Second Quarter <strong>2010</strong><br />
Key Financials (unaudited)<br />
Current rates<br />
Half Year <strong>2010</strong><br />
€11,752m +12.4% Turnover €21,895m +9.7%<br />
+3.6% Underlying sales growth* +3.8%<br />
€1,628m +23% Operating<br />
lf Y<br />
profit €3,066m +20%<br />
€1,154m +39% Net<br />
lf<br />
profit<br />
Y<br />
€2,209m +35%<br />
€0.36 +38% Diluted Earnings<br />
lf Y<br />
per share €0.70 +36%<br />
Third Quarterly Interim Dividend €0.208 per share<br />
(*) Underlying sales growth is a non-GAAP measure, see note 2 on Page 11 for further explanation.<br />
5 August <strong>2010</strong>
(unaudited) Turnover USG Volume Price<br />
OPERATIONAL REVIEW: REGIONS<br />
Second Quarter <strong>2010</strong> Half Year <strong>2010</strong><br />
Change in<br />
Underlying<br />
Op Margin<br />
2<br />
Turnover USG Volume Price<br />
Change in<br />
Underlying<br />
Op Margin<br />
€m % % % bps €m % % % bps<br />
<strong>Unilever</strong><br />
Total<br />
11,752 3.6 5.7 (2.0) 10 21,895 3.8 6.6 (2.6) 30<br />
Asia Africa<br />
CEE<br />
4,673 8.2 11.5 (2.9) (10) 8,668 7.9 11.6 (3.3) 10<br />
Americas 3,859 3.9 5.0 (1.1) (40) 7,199 3.8 5.6 (1.7) (10)<br />
Western<br />
Europe<br />
3,220 (2.2) (0.3) (1.9) 120 6,028 (1.1) 1.7 (2.7) 130<br />
Market growth in developed economies remains depressed whilst emerging market growth remains strong. The<br />
high intensity of competition has continued but we have remained competitive and delivered strong <strong>volume</strong><br />
growth, with <strong>volume</strong> share gains across all regions. Whilst underlying price growth remains negative, in-quarter<br />
pricing was again stable, despite increased competitive pricing and promotional activity, especially in Laundry and<br />
Hair. Gross margins continued to improve allowing us to increase advertising & promotions investment whilst<br />
delivering improved underlying operating margin.<br />
Asia Africa CEE – Half <strong>year</strong> USG +7.9%, Volume +11.6%, Underlying Operating Margin +10 bps<br />
The region continued its strong <strong>momentum</strong> in underlying <strong>volume</strong> and sales growth in the second quarter, ahead<br />
of the market. This was the third successive quarter of double digit <strong>volume</strong> growth with all the main countries and<br />
key categories positive despite intense competitive activity.<br />
Half <strong>year</strong> underlying sales growth in Asia and Africa Middle East was strong, driven by double digit underlying<br />
<strong>volume</strong> growth which more than compensated for price action taken to ensure that our products remain fully<br />
competitive; <strong>volume</strong> shares progressed well. CEE performance was more mixed but again <strong>volume</strong> shares improved.<br />
Underlying operating margin was slightly positive in the <strong>half</strong> <strong>year</strong> with improved gross margins offset by a<br />
significant step-up in advertising and support behind our brands. The rollout of the regional IT platform continued<br />
with successful go-lives in China, Hong Kong, Taiwan and Australasia.<br />
The Americas – Half <strong>year</strong> USG +3.8%, Volume +5.6%, Underlying Operating Margin (10) bps<br />
Despite the continued sluggish markets in North America, our business grew underlying <strong>volume</strong> at more than 2%<br />
in the <strong>half</strong> <strong>year</strong> on the back of successful new product launches and improved in-market execution. Dressings<br />
gained share through strong innovation and merchandising support and Skin Cleansing grew strongly.<br />
Latin American markets are generally much stronger and our underlying <strong>volume</strong> growth for the <strong>half</strong> <strong>year</strong> was just<br />
under 10% on the back of strong performances from Deodorants, Hair, Ice Cream and soy-based drinks under the<br />
AdeS brand.<br />
Underlying operating margin, down 10bps in the <strong>half</strong> <strong>year</strong>, again reflected the significant increase in brand<br />
support levels.<br />
Western Europe – Half <strong>year</strong> USG (1.1)%, Volume 1.7%, Underlying Operating Margin +130 bps<br />
Markets were difficult, particularly in southern European countries such as Greece, Spain and, to a lesser extent,<br />
Italy. We continue to pursue our strategy of investing behind our brands and bringing strong innovations to<br />
market. This approach is delivering good <strong>results</strong>, with both <strong>volume</strong> and value shares up.<br />
Excluding Greece, where market <strong>volume</strong>s were down substantially, underlying <strong>volume</strong> growth in Western Europe<br />
in the second quarter was positive. However, our Greek business responded quickly to the crisis with €1<br />
promotions crafted to reflect the new economic reality. In Paris we opened the second Customer Insight and<br />
Innovation Centre in the region following the opening of the <strong>first</strong> such centre in the UK.<br />
Gross margin and indirects improved in both the <strong>half</strong> <strong>year</strong> and the second quarter, driven by strong savings<br />
programmes. Underlying operating margin increased alongside increased advertising and promotions investment.
OPERATIONAL REVIEW: CATEGORIES<br />
Second Quarter <strong>2010</strong> Half Year <strong>2010</strong><br />
(unaudited) Turnover USG Turnover USG<br />
€m % €m %<br />
<strong>Unilever</strong> Total 11,752 3.6 21,895 3.8<br />
Savoury, Dressings & Spreads 3,514 0.5 6,910 0.3<br />
Ice Cream & Beverages 2,696 3.5 4,494 5.1<br />
Personal Care 3,569 7.8 6,700 7.9<br />
Home Care & other 1,973 2.2 3,791 2.4<br />
We maintained our <strong>volume</strong> growth <strong>momentum</strong> with strong performances from Deodorants, Skin Cleansing and<br />
Homecare. We continue to focus on bigger innovations, rolled out faster and to more countries. Dove Men + Care<br />
is now in 29 markets and Knorr jelly bouillon has been extended from China to 18 markets, the latest being Brazil<br />
and Mexico. Magnum Gold?! has been launched in 29 markets and Cornetto Enigma is in 12 European markets.<br />
We are also extending our iconic brands into new markets more quickly than ever before.<br />
Savoury, Dressings and Spreads – Half <strong>year</strong> USG +0.3%<br />
Spreads <strong>volume</strong> share increased again but markets remain weak. Significant events included the ‘no hydrogenated<br />
oils’ relaunches of I Can’t Believe its not Butter and Country Crock in the US and the re-launch of the pro.activ<br />
brand in Europe. The new Rama margarine specifically formulated for spreading continues to make good progress<br />
in Central and South Africa based on the attractive proposition of nutrition at an affordable price. In Europe we<br />
still have more to do to convince butter users of the benefits of our products. Dressings benefited from the<br />
campaign to tackle the negative health perceptions of mayonnaise and to inspire new uses through recipe ideas.<br />
Savoury growth picked up on the continuing success and rollout of Knorr jelly bouillon and the introduction of<br />
Knorr seasoning for beans in Brazil and Mexico. The success of the Knorr cook-in bags gave us category leadership<br />
in Australasia. The PF Chang premium restaurant-quality frozen Asian meals have started well in the US despite<br />
supply difficulties. Knorr soups in France performed strongly after we introduced new varieties.<br />
Ice Cream and Beverages – Half <strong>year</strong> USG +5.1%<br />
Ice Cream delivered a strong performance irrespective of the poor weather in Europe and China. Magnum Gold?!,<br />
Cornetto Enigma and Fruttare are all exceeding expectations. The new Klondike variants continue to drive growth<br />
in the US whilst the new Ben & Jerry’s and Breyer’s Smooth and Dreamy ranges have been well received. Strong<br />
growth in South East Asia and Latin America came from distribution gains, strong point-of-purchase activity and<br />
great innovation.<br />
Tea <strong>volume</strong> growth slowed but overall performance remains good. The innovations across the price points, from<br />
Brooke Bond Sehatmand in India at a low price to the Lipton premium fruit and herbal infusions doing well in<br />
markets like Australia and Russia, are helping drive balanced growth. The Lipton Green Tea launches in USA and<br />
France are delivering good growth. The launches of the Lipton brand in Spain and the UK continue to do well.<br />
Personal Care – Half <strong>year</strong> USG +7.9%<br />
Personal Care again delivered strong growth, powered by Deodorants. Notable successes include Degree in the<br />
US, Dove in Brazil and the relaunch of Rexona in Japan. Hair growth accelerated and we saw <strong>volume</strong> share gains<br />
despite the increased competitive environment. Dove Hair Damage Repair gained good initial acceptance and<br />
there were also strong performances by Sunsilk Co-Creations in Asia and Suave in the US. TiGi has just launched<br />
Sleek Mystique which completes the new range from Catwalk.<br />
Skin Cleansing is growing strongly on the back of the success of Dove Nutrium moisture and the good <strong>results</strong> from<br />
the launches of Citra bar soap in Indonesia and Lifebuoy in Argentina, Brazil, Bolivia, Peru and Australia. Hand and<br />
body creams continue to grow despite Vaseline Sheer Infusions being off to a slow start. Oral is doing well with<br />
notable successes for the anti-age variant in Europe and the launch of Pepsodent in the Philippines.<br />
Home Care and other – Half <strong>year</strong> USG +2.4%<br />
Despite high levels of competitive intensity we maintained <strong>volume</strong> growth <strong>momentum</strong>. Notable was the<br />
continuing success of liquid detergents with recent introductions in Turkey and Vietnam, the successful Wheel<br />
relaunch in India and the launch of the Surf brand position in Indonesia and Thailand.<br />
Household Cleaning has continued to deliver strong <strong>results</strong> with Cif Active-Shield technology doing well in<br />
Western Europe, now launched into Poland and Argentina. The Cif launch in Vietnam has had an encouraging<br />
start and we have just launched in Indonesia. Domestos, recently launched in Italy, is performing strongly.<br />
3
Finance costs and tax<br />
ADDITIONAL COMMENTARY ON THE FINANCIAL STATEMENTS – FIRST HALF YEAR<br />
The cost of financing net borrowings in the <strong>half</strong> <strong>year</strong> was €214 million, €30 million less than the same period last<br />
<strong>year</strong> mainly reflecting lower average net debt in the <strong>first</strong> <strong>half</strong>. The interest rate on net borrowing was 6.3%<br />
reflecting the low interest rates on cash deposits. The charge for pensions financing was a credit of €8m compared<br />
with a net charge of €90m in the prior <strong>year</strong>.<br />
The effective tax rate was 26.3% compared with 29.4% for 2009 primarily reflecting favourable prior <strong>year</strong> tax<br />
settlements and lower one-off items.<br />
Joint ventures, associates and other income from non-current investments<br />
Net profit from joint ventures and associates, together with other income from non-current investments<br />
contributed €116 million compared to €72 million last <strong>year</strong>. The main factors behind the increase were the partial<br />
redemption of a portion of the preferred shares that had been held as consideration for the sale of <strong>Unilever</strong>’s US<br />
laundry business in 2008 and a fair value adjustment on the warrants in Johnson Diversey.<br />
Earnings per share<br />
Fully diluted earnings per share at €0.36 for the quarter were 38% higher than the same period in 2009. The<br />
principal drivers for the increase were improved underlying operating profit, lower restructuring charges, lower<br />
pensions costs, favourable foreign exchange and profit on disposals.<br />
Fully diluted earnings per share for the <strong>half</strong> <strong>year</strong> were €0.70, up 36% on the previous <strong>year</strong>.<br />
Restructuring<br />
Restructuring in the <strong>first</strong> <strong>half</strong> <strong>year</strong> was around 120 bps of Turnover, at €253 million. This reflects action being<br />
taken to make the business fit to compete in the current environment. Full <strong>year</strong> restructuring is expected at similar<br />
levels.<br />
Cash Flow and Net Debt<br />
Strong management focus led to further reductions in average trading working capital as a percentage of<br />
turnover, which was negative for the third successive quarter. The working capital outflow reflected the normal<br />
seasonal pattern with the levels at end of June higher than at the start of the <strong>year</strong>.<br />
Capital expenditure increased by €247 million to €753 million in support of future growth in emerging markets<br />
such as Russia and Indonesia.<br />
Free cash flow (see note 2, page 11 for further explanation) at €1.3 billion was broadly stable versus the prior <strong>year</strong>.<br />
This reflected improved net cash flow from operating activities at €2.2 billion, up €218 million versus the prior<br />
<strong>year</strong>. The improved operating profit was offset by the absolute increase in working capital and the higher level of<br />
capital expenditure.<br />
Net debt at €7.6 billion was up from €6.4 billion as at 31 st December 2009, primarily reflecting the impact of the<br />
changes in foreign exchange rates.<br />
Pensions<br />
The net deficit in pension schemes was €4.0bn at the end of June up from €2.6bn at the end of 2009. This is<br />
mainly due to the impact of lower discount rate assumptions on the liabilities.<br />
Acquisitions and disposals (full details can be found in note 12, page 16)<br />
After the quarter end we announced the disposal of our frozen foods business in Italy for €805m to Birds Eye Iglo.<br />
We expect to complete the acquisition of Sara Lee’s personal care business in Q4 <strong>2010</strong>.<br />
4
<strong>Unilever</strong> NV Preference Shares<br />
The period for the creditors of <strong>Unilever</strong> NV to object to the cancellation of the 4% preference shares has now<br />
closed and cancellation will take place shortly with a record date of August 12 th and payment on August 23 rd . It is<br />
our intention to launch a tender offer in respect of the 6% and 7% preference shares in due course.<br />
Principal Risk Factors<br />
On pages 30 to 34 of our 2009 Report and Accounts we set out our assessment of the principal risk issues that<br />
would face the business through <strong>2010</strong> under the headings: economic; markets; brand; customer;<br />
financial/treasury; consumer safety and environmental sustainability; operations; people and talent; legal and<br />
regulatory; restructuring and change management; and other risks. In our view, the nature and potential impact<br />
of such risks remain essentially unchanged as regards our performance over the second <strong>half</strong> of <strong>2010</strong>.<br />
Other Information<br />
This document represents <strong>Unilever</strong>’s <strong>half</strong>-<strong>year</strong>ly report for the purposes of the Disclosure and Transparency Rules<br />
(DTR) issued by the UK Financial Services Authority (DTR 4.2) and the Dutch Act on Financial Supervision, section<br />
5:25d (8)/(9) (Half-<strong>year</strong>ly financial reports). In this context: (i) the condensed set of financial statements can be<br />
found on pages 7 to 16; (ii) pages 2 to 6 comprise the interim management report; and (iii) the Directors’<br />
responsibility statement can be found on page 17. No material related parties transactions have taken place in the<br />
<strong>first</strong> six months of the <strong>year</strong>.<br />
COMPETITION INVESTIGATIONS<br />
As previously reported, in June 2008 the European Commission initiated an investigation into potential<br />
competition law infringements in the European Union in relation to consumer detergents. The investigation is<br />
ongoing although no statement of objections against <strong>Unilever</strong> has been issued to date.<br />
In December 2009, as previously reported, <strong>Unilever</strong> received separate statements of objection from the French<br />
competition authority and from the Italian competition authority in connection with investigations into certain<br />
product markets in France and Italy respectively. In April <strong>2010</strong>, <strong>Unilever</strong> received a statement of objections from<br />
the Dutch competition authority in relation to its investigation into certain product markets in The Netherlands.<br />
An earlier decision by the Greek authority fining <strong>Unilever</strong> in relation to alleged restrictions on parallel trade within<br />
certain of its contracts with retailers in Greece is under appeal.<br />
In addition and as previously disclosed, <strong>Unilever</strong> is involved in a number of other ongoing investigations by<br />
national competition authorities. These include investigations in Belgium, France and Germany. These<br />
investigations are at various stages and concern a variety of product markets.<br />
Substantial fines can be levied as a result of competition and antitrust investigations especially at the European<br />
Union level. Fines imposed by the European Commission in other sectors for violations of the competition rules<br />
have amounted to hundreds of millions of euros. It is too early reliably to estimate the total amount of fines to<br />
which <strong>Unilever</strong> will be subject as a result of all of these investigations. However, provisions have been made, to the<br />
extent appropriate, in relation to the national investigations.<br />
It is <strong>Unilever</strong>’s policy to co-operate fully with the competition authorities in the context of all ongoing<br />
investigations. In addition, <strong>Unilever</strong> reinforces and enhances its internal competition law compliance procedures<br />
on an ongoing basis.<br />
5
CAUTIONARY STATEMENT<br />
This announcement may contain forward-looking statements, including ‘forward-looking statements’ within the meaning of<br />
the United States Private Securities Litigation Reform Act of 1995. Words such as ‘expects’, ‘anticipates’, ‘intends’, ‘believes’ or<br />
the negative of these terms and other similar expressions of future performance or <strong>results</strong>, and their negatives, are intended to<br />
identify such forward-looking statements. These forward-looking statements are based upon current expectations and<br />
assumptions regarding anticipated developments and other factors affecting the Group. They are not historical facts, nor are<br />
they guarantees of future performance.<br />
Because these forward-looking statements involve risks and uncertainties, there are important factors that could cause actual<br />
<strong>results</strong> to differ materially from those expressed or implied by these forward-looking statements, including, among others,<br />
competitive pricing and activities, economic slowdown, industry consolidation, access to credit markets, recruitment levels,<br />
reputational risks, commodity prices, continued availability of raw materials, prioritisation of projects, consumption levels,<br />
costs, the ability to maintain and manage key customer relationships and supply chain sources, consumer demands, currency<br />
values, interest rates, the ability to integrate acquisitions and complete planned divestitures, the ability to complete planned<br />
restructuring activities, physical risks, environmental risks, the ability to manage regulatory, tax and legal matters and resolve<br />
pending matters within current estimates, legislative, fiscal and regulatory developments, political, economic and social<br />
conditions in the geographic markets where the Group operates and new or changed priorities of the Boards. Further details of<br />
potential risks and uncertainties affecting the Group are described in the Group’s filings with the London Stock Exchange,<br />
Euronext Amsterdam and the US Securities and Exchange Commission, including the 20-F Report and the Annual Report and<br />
Accounts 2009. These forward-looking statements speak only as of the date of this document. Except as required by any<br />
applicable law or regulation, the Group expressly disclaims any obligation or undertaking to release publicly any updates or<br />
revisions to any forward-looking statements contained herein to reflect any change in the Group’s expectations with regard<br />
thereto or any change in events, conditions or circumstances on which any such statement is based.<br />
Media: Media Relations Team<br />
UK +44 20 7822 6805 stephen.pain@unilever.com<br />
or +44 20 7822 6010 trevor.gorin@unilever.com<br />
NL +31 10 217 4844 flip.dotsch@unilever.com<br />
ENQUIRIES<br />
There will be a web cast of the <strong>results</strong> presentation available at:<br />
www.unilever.com/ourcompany/investorcentre/<strong>results</strong>/quarterly<strong>results</strong>/default.asp<br />
COND<br />
6<br />
Investors: Investor Relations Team<br />
+44 20 7822 6830 investor.relations@unilever.com
INANCIAL STATEMENTS<br />
(unaudited)<br />
<strong>2010</strong><br />
Second Quarter<br />
Increase/<br />
(Decrease)<br />
2009 Current Constant<br />
rates rates<br />
INCOME STATEMENT<br />
€ million<br />
Continuing operations:<br />
7<br />
Half Year<br />
Increase/<br />
<strong>2010</strong> 2009<br />
(Decrease)<br />
Current Constant<br />
rates rates<br />
11,752 10,458 12.4% 3.4% Turnover 21,895 19,963 9.7% 3.9%<br />
1,628 1,320 23% 15% Operating profit 3,066 2,554 20% 15%<br />
(96)<br />
1,724<br />
(203)<br />
1,523<br />
13%<br />
Restructuring, business disposals and<br />
other (RDIs) (see note 3) (204) (361)<br />
5% Underlying operating profit 3,270 2,915 12% 7%<br />
(101) (151) Net finance costs (206) (334)<br />
25 19 Finance income 41 44<br />
(130) (125) Finance costs (255) (288)<br />
4 (45) Pensions and similar obligations 8 (90)<br />
41 36 Share in net profit/(loss) of joint ventures 68 63<br />
(2) (2) Share in net profit/(loss) of associates (5) (3)<br />
20 (1) Other income from non-current investments 53 12<br />
1,586 1,202 32% 24% Profit before taxation 2,976 2,292 30% 24%<br />
(432) (369) Taxation (767) (656)<br />
1,154 833 39% 30% Net profit 2,209 1,636 35% 29%<br />
Attributable to:<br />
92 75 Non-controlling interests 174 147<br />
1,062 758 40% 30% Shareholders’ equity 2,035 1,489 37% 30%<br />
Combined earnings per share<br />
0.37 0.27 38% 29% Total operations (Euros) 0.72 0.53 36% 29%<br />
0.36 0.27 38% 29% Total operations – diluted (Euros) 0.70 0.52 36% 29%
(unaudited)<br />
STATEMENT OF COMPREHENSIVE INCOME<br />
€ million Half Year<br />
8<br />
<strong>2010</strong> 2009<br />
Net profit 2,209 1,636<br />
Other comprehensive income<br />
Fair value gains/(losses) on financial instruments net of tax (68) 85<br />
Actuarial gains/(losses) on pension schemes net of tax (935) (270)<br />
Currency retranslation gains/(losses) net of tax 444 142<br />
Total comprehensive income 1,650 1,593<br />
Attributable to:<br />
Non-controlling interests 253 152<br />
Shareholders’ equity 1,397 1,441<br />
(unaudited)<br />
STATEMENT OF CHANGES IN EQUITY<br />
€ million Half Year<br />
<strong>2010</strong> 2009<br />
Equity at 1 January 12,536 10,372<br />
Total comprehensive income for the period 1,650 1,593<br />
Dividends on ordinary capital (1,134) (1,361)<br />
Movement in treasury stock (2) 18<br />
Share-based payment credit 74 65<br />
Dividends paid to non-controlling interests (88) (70)<br />
Currency retranslation gains/(losses) net of tax 12 (6)<br />
Other movements in equity 32 (33)<br />
Equity at the end of the period 13,080 10,578
(unaudited)<br />
CASH FLOW STATEMENT<br />
€ million Half Year<br />
9<br />
<strong>2010</strong> 2009<br />
Cash flow from operating activities 2,809 2,450<br />
Income tax paid (572) (431)<br />
Net cash flow from operating activities 2,237 2,019<br />
Interest received 33 38<br />
Net capital expenditure (753) (506)<br />
Acquisitions and disposals 70 (365)<br />
Other investing activities 740 (5)<br />
Net cash flow from/(used in) investing activities 90 (838)<br />
Dividends paid on ordinary share capital (1,148) (1,302)<br />
Interest and preference dividends paid (257) (258)<br />
Change in financial liabilities (289) 130<br />
Other movements on treasury stock 8 17<br />
Other financing activities (87) (43)<br />
Net cash flow from/(used in) financing activities (1,773) (1,456)<br />
Net increase/(decrease) in cash and cash equivalents 554 (275)<br />
Cash and cash equivalents at the beginning of the period 2,397 2,360<br />
Effect of foreign exchange rate changes (201) (176)<br />
Cash and cash equivalents at the end of the period 2,750 1,909
(unaudited)<br />
BALANCE SHEET<br />
€ million As at<br />
30 June<br />
<strong>2010</strong><br />
10<br />
As at<br />
31 December<br />
2009<br />
As at<br />
30 June<br />
2009<br />
Goodwill 13,371 12,464 12,338<br />
Intangible assets 5,031 4,583 4,598<br />
Property, plant and equipment 7,504 6,644 6,261<br />
Pension asset for funded schemes in surplus 536 759 413<br />
Deferred tax assets 1,045 738 1,083<br />
Other non-current assets 1,106 1,017 1,591<br />
Total non-current assets 28,593 26,205 26,284<br />
Inventories 4,398 3,578 3,759<br />
Trade and other current receivables 4,922 3,429 4,813<br />
Current tax assets 125 173 167<br />
Cash and cash equivalents 3,105 2,642 2,082<br />
Other financial assets 415 972 334<br />
Non-current assets held for sale 398 17 13<br />
Total current assets 13,363 10,811 11,168<br />
Financial liabilities (2,895) (2,279) (2,470)<br />
Trade payables and other current liabilities (10,336) (8,413) (8,428)<br />
Current tax liabilities (534) (487) (408)<br />
Provisions (312) (420) (698)<br />
Liabilities associated with assets held for sale (21) - -<br />
Total current liabilities (14,098) (11,599) (12,004)<br />
Net current assets/(liabilities) (735) (788) (836)<br />
Total assets less current liabilities 27,858 25,417 25,448<br />
Financial liabilities due after one <strong>year</strong> 8,188 7,692 8,826<br />
Non-current tax liabilities 153 107 231<br />
Pensions and post-retirement healthcare liabilities:<br />
Funded schemes in deficit 2,428 1,519 2,052<br />
Unfunded schemes 2,061 1,822 2,011<br />
Provisions 848 729 695<br />
Deferred tax liabilities 807 764 796<br />
Other non-current liabilities 293 248 259<br />
Total non-current liabilities 14,778 12,881 14,870<br />
Shareholders’ equity 12,428 12,065 10,085<br />
Non-controlling interests 652 471 493<br />
Total equity 13,080 12,536 10,578<br />
Total capital employed 27,858 25,417 25,448
(unaudited)<br />
1 ACCOUNTING INFORMATION AND POLICIES<br />
NOTES TO THE FINANCIAL STATEMENTS<br />
The condensed interim financial statements are based on International Financial Reporting Standards (IFRS) as adopted by the<br />
EU and IFRS as issued by the International Accounting Standards Board. The accounting policies and methods of computation<br />
are consistent with the <strong>year</strong> ended 31 December 2009 and are in compliance with IAS34 ‘Interim Financial reporting’.<br />
The condensed interim financial statements are shown at current exchange rates, while percentage <strong>year</strong>-on-<strong>year</strong> changes are<br />
shown at both current and constant exchange rates to facilitate comparison.<br />
The income statement on page 7, the statements of comprehensive income and changes in equity on page 8, the cash flow<br />
statement on page 9, and the analysis of free cash flow on page 14 are translated at rates current in each period.<br />
The balance sheet on page 10 and the analysis of net debt on page 15 are translated at period-end rates of exchange.<br />
The financial statements attached do not constitute the full financial statements within the meaning of Section 434 of the UK<br />
Companies Act 2006. Full accounts for <strong>Unilever</strong> for the <strong>year</strong> ended 31 December 2009 have been delivered to the Registrar of<br />
Companies. The auditors’ report on these accounts was unqualified and did not contain a statement under Section 498 (2) or<br />
Section 498 (3) of the UK Companies Act 2006.<br />
2 NON-GAAP MEASURES<br />
In our financial reporting we use certain measures that are not recognised under IFRS or other generally accepted accounting<br />
principles (GAAP). We do this because we believe that these measures are useful to investors and other users of our financial<br />
statements in helping them to understand underlying business performance. Wherever we use such measures, we make clear<br />
that these are not intended as a substitute for recognised GAAP measures. Wherever appropriate and practical, we provide<br />
reconciliations to relevant GAAP measures. <strong>Unilever</strong> uses ‘constant rate’ and ‘underlying’ measures primarily for internal<br />
performance analysis and targeting purposes.<br />
The principal non-GAAP measure which we apply in our quarterly reporting is underlying sales growth, which we reconcile to<br />
changes in the GAAP measure turnover in notes 4 and 5. Underlying sales growth (abbreviated to ‘USG’ or ‘growth’) reports<br />
turnover growth at constant exchange rates, excluding the effects of acquisitions and disposals. Turnover includes the impact<br />
of exchange rates, acquisitions and disposals.<br />
We also comment on underlying trends in operating margin before the impact of restructuring, disposals and other one-off<br />
items, which we collectively term RDIs, on the grounds that the incidence of these items is uneven between quarterly reporting<br />
periods. Further detail on RDIs can be found in note 3. We also discuss free cash flow, which we reconcile in note 8 to the<br />
amounts in the cash flow statement, and net debt, which we reconcile in note 9 to the amounts reported in our balance sheet<br />
and cash flow statement.<br />
In explaining cash flow performance we refer to the trend of average trading working capital. This metric is used internally,<br />
focusing on average rather than closing positions to ensure consistent performance, whilst excluding the elements of working<br />
capital that operational management cannot influence.<br />
Further information about these measures and their reconciliation to GAAP measures is given on our website at<br />
www.unilever.com/investorrelations<br />
3 SIGNIFICANT ITEMS WITHIN THE INCOME STATEMENT<br />
In our income statement reporting we recognise restructuring costs, profits and losses on business disposals and certain other<br />
one-off items, which we collectively term RDIs. We disclose on the face of our income statement the total value of such items<br />
that arise within operating profit. In our operating review by region and in note 4 we highlight the impact of these items on<br />
our operating margin.<br />
Second Quarter € million Half Year<br />
<strong>2010</strong> 2009 <strong>2010</strong> 2009<br />
RDIs within operating profit:<br />
(134) (203) Restructuring (253) (361)<br />
38 - Business disposals 49 -<br />
- - Impairments and other one-off items - -<br />
(96) (203) Total RDIs within operating profit (204) (361)<br />
11
(unaudited)<br />
4 SEGMENT INFORMATION<br />
Continuing operations – Second Quarter<br />
€ million<br />
NOTES TO THE FINANCIAL STATEMENTS<br />
12<br />
Asia Africa<br />
CEE<br />
Americas<br />
Western<br />
Europe<br />
Turnover<br />
2009 3,856 3,335 3,267 10,458<br />
<strong>2010</strong> 4,673 3,859 3,220 11,752<br />
Change 21.2 % 15.7 % (1.4) % 12.4 %<br />
Impact of:<br />
Exchange rates 12.0 % 11.4 % 1.2 % 8.7 %<br />
Acquisitions 0.3 % 0.2 % 0.1 % 0.2 %<br />
Disposals (0.2)% (0.3)% (0.5)% (0.3)%<br />
Underlying sales growth 8.2 % 3.9 % (2.2) % 3.6 %<br />
Price (2.9)% (1.1)% (1.9)% (2.0)%<br />
Volume 11.5 % 5.0 % (0.3)% 5.7 %<br />
Operating profit<br />
2009 502 441 377 1,320<br />
<strong>2010</strong> 599 509 520 1,628<br />
Underlying operating profit<br />
2009 523 495 505 1,523<br />
<strong>2010</strong> 631 555 538 1,724<br />
Operating margin<br />
2009 13.0% 13.2% 11.5% 12.6%<br />
<strong>2010</strong> 12.8% 13.2% 16.2% 13.9%<br />
Underlying operating margin<br />
2009 13.6% 14.8% 15.5% 14.6%<br />
<strong>2010</strong> 13.5% 14.4% 16.7% 14.7%<br />
Continuing operations – Half Year<br />
€ million<br />
Asia Africa<br />
CEE<br />
Americas<br />
Western<br />
Europe<br />
Turnover<br />
2009 7,431 6,491 6,041 19,963<br />
<strong>2010</strong> 8,668 7,199 6,028 21,895<br />
Change 16.7 % 10.9 % (0.2) % 9.7 %<br />
Impact of:<br />
Exchange rates 8.0 % 6.7 % 1.0 % 5.6 %<br />
Acquisitions 0.3 % 0.6 % 0.3 % 0.4 %<br />
Disposals (0.2)% (0.4)% (0.5)% (0.3)%<br />
Underlying sales growth 7.9 % 3.8 % (1.1) % 3.8 %<br />
Price (3.3)% (1.7)% (2.7)% (2.6)%<br />
Volume 11.6 % 5.6 % 1.7 % 6.6 %<br />
Operating profit<br />
2009 966 883 705 2,554<br />
<strong>2010</strong> 1,149 1,013 904 3,066<br />
Underlying operating profit<br />
2009 1,017 977 921 2,915<br />
<strong>2010</strong> 1,196 1,080 994 3,270<br />
Operating margin<br />
2009 13.0% 13.6% 11.7% 12.8%<br />
<strong>2010</strong> 13.3% 14.1% 15.0% 14.0%<br />
Underlying operating margin<br />
2009 13.7% 15.1% 15.2% 14.6%<br />
<strong>2010</strong> 13.8% 15.0% 16.5% 14.9%<br />
Total<br />
Total
(unaudited)<br />
5 ADDITIONAL INFORMATION BY CATEGORY<br />
Continuing operations – Second Quarter<br />
€ million<br />
NOTES TO THE FINANCIAL STATEMENTS<br />
Savoury<br />
Dressings<br />
and Spreads<br />
13<br />
Ice Cream<br />
and<br />
Beverages<br />
Personal<br />
Care<br />
Home Care<br />
and<br />
other<br />
Turnover<br />
2009 3,232 2,468 2,996 1,762 10,458<br />
<strong>2010</strong> 3,514 2,696 3,569 1,973 11,752<br />
Change 8.7% 9.3% 19.1% 12.0% 12.4%<br />
Impact of:<br />
Exchange rates 7.1 % 7.4 % 10.5 % 10.0 % 8.7 %<br />
Acquisitions 0.5 % 0.1 % 0.0 % 0.1 % 0.2 %<br />
Disposals 0.5 % (1.7)% 0.0 % (0.4)% (0.3)%<br />
Underlying sales growth 0.5 % 3.5 % 7.8 % 2.2 % 3.6 %<br />
Operating profit<br />
2009 417 339 387 177 1,320<br />
<strong>2010</strong> 598 383 523 124 1,628<br />
Operating margin<br />
2009 12.9% 13.7% 12.9% 10.0% 12.6%<br />
<strong>2010</strong> 17.0% 14.2% 14.7% 6.3% 13.9%<br />
Continuing operations – Half Year<br />
€ million<br />
Savoury<br />
Dressings<br />
and Spreads<br />
Ice Cream<br />
and<br />
Beverages<br />
Personal<br />
Care<br />
Home Care<br />
and<br />
other<br />
Turnover<br />
2009 6,544 4,132 5,803 3,484 19,963<br />
<strong>2010</strong> 6,910 4,494 6,700 3,791 21,895<br />
Change 5.6 % 8.8 % 15.5 % 8.8 % 9.7 %<br />
Impact of:<br />
Exchange rates 4.4 % 5.3 % 6.3 % 6.9 % 5.6 %<br />
Acquisitions 0.5 % 0.0 % 0.7 % 0.0 % 0.4 %<br />
Disposals 0.4 % (1.7)% 0.0 % (0.5)% (0.3)%<br />
Underlying sales growth 0.3 % 5.1 % 7.9 % 2.4 % 3.8 %<br />
Operating profit<br />
2009 857 493 901 303 2,554<br />
<strong>2010</strong> 1,142 526 1,082 316 3,066<br />
Operating margin<br />
2009 13.1% 11.9% 15.5% 8.7% 12.8%<br />
<strong>2010</strong> 16.5% 11.7% 16.1% 8.3% 14.0%<br />
Total<br />
Total
(unaudited)<br />
6 TAXATION<br />
NOTES TO THE FINANCIAL STATEMENTS<br />
The effective tax rate for the <strong>half</strong> <strong>year</strong> was 26.3% compared with 29.4% for 2009. The tax rate is calculated by dividing the tax<br />
charge by pre-tax profit excluding the contribution of joint ventures and associates.<br />
Tax effects of components of other comprehensive income were as follows:<br />
€ million Half Year <strong>2010</strong> Half Year 2009<br />
Before<br />
tax<br />
14<br />
Tax<br />
(charge)/<br />
credit<br />
After<br />
tax<br />
Before<br />
tax<br />
Tax<br />
(charge)/<br />
credit<br />
Fair value gains/(losses) on financial instruments net of tax (77) 9 (68) 133 (48) 85<br />
Actuarial gains/(losses) on pension schemes net of tax (1,290) 355 (935) (373) 103 (270)<br />
Currency retranslation gains/(losses) net of tax 444 - 444 142 – 142<br />
Other comprehensive income (923) 364 (559) (98) 55 (43)<br />
7 RECONCILIATION OF NET PROFIT TO CASH FLOW FROM OPERATING ACTIVITIES<br />
€ million Half Year<br />
<strong>2010</strong> 2009<br />
Net profit 2,209 1,636<br />
Taxation 767 656<br />
Share of net profit of joint ventures/associates and other income<br />
from non-current investments (116) (72)<br />
Net finance costs 206 334<br />
Operating profit 3,066 2,554<br />
Depreciation, amortisation and impairment 498 497<br />
Changes in working capital (489) (260)<br />
Pensions and similar provisions less payments (204) (333)<br />
Restructuring and other provisions less payments (70) (123)<br />
Elimination of (profits)/losses on disposals (56) (2)<br />
Non-cash charge for share-based compensation 74 65<br />
Other adjustments (10) 52<br />
Cash flow from operating activities 2,809 2,450<br />
8 FREE CASH FLOW<br />
€ million Half Year<br />
<strong>2010</strong> 2009<br />
Cash flow from operating activities 2,809 2,450<br />
Income tax paid (572) (431)<br />
Net capital expenditure (753) (506)<br />
Net interest and preference dividends paid (224) (220)<br />
Free cash flow 1,260 1,293<br />
After<br />
tax
(unaudited)<br />
9 NET DEBT<br />
NOTES TO THE FINANCIAL STATEMENTS<br />
€ million As at 30<br />
June<br />
<strong>2010</strong><br />
15<br />
As at 31<br />
December<br />
2009<br />
As at 30<br />
June<br />
2009<br />
Total financial liabilities (11,083) (9,971) (11,296)<br />
Financial liabilities due within one <strong>year</strong> (2,895) (2,279) (2,470)<br />
Financial liabilities due after one <strong>year</strong> (8,188) (7,692) (8,826)<br />
Cash and cash equivalents as per balance sheet 3,105 2,642 2,082<br />
Cash and cash equivalents as per cash flow statement 2,750 2,397 1,909<br />
Add bank overdrafts deducted therein 355 245 173<br />
Other financial assets 415 972 334<br />
Net debt (7,563) (6,357) (8,880)<br />
10 COMBINED EARNINGS PER SHARE<br />
The combined earnings per share calculations are based on the average number of share units representing the combined<br />
ordinary shares of NV and PLC in issue during the period, less the average number of shares held as treasury stock.<br />
In calculating diluted earnings per share, a number of adjustments are made to the number of shares, principally the following:<br />
(i) conversion into PLC ordinary shares in the <strong>year</strong> 2038 of shares in a group company under the arrangements for the variation<br />
of the Leverhulme Trust and (ii) the exercise of share options by employees.<br />
Earnings per share for total operations for the six months were calculated as follows:<br />
<strong>2010</strong> 2009<br />
Combined EPS – Basic<br />
Average number of combined share units (Millions of units) 2,810.6 2,792.4<br />
Net profit attributable to shareholders’ equity 2,035 1,489<br />
Combined EPS 0.72 0.53<br />
Combined EPS – Diluted<br />
Adjusted average number of combined share units (Millions of units) 2,905.0 2,881.5<br />
Combined EPS – diluted 0.70 0.52<br />
The numbers of shares included in the calculation of earnings per share is an average for the period. During the period the<br />
following movements in shares have taken place:<br />
Millions<br />
Number of shares at 31 December 2009 (net of treasury stock) 2,804.2<br />
Net movements in shares under incentive schemes 10.5<br />
Number of shares at 30 June <strong>2010</strong> 2,814.7
(unaudited)<br />
11 DIVIDENDS<br />
NOTES TO THE FINANCIAL STATEMENTS<br />
As agreed at the 2009 Annual General Meetings, <strong>Unilever</strong> moved to the payment of quarterly dividends with effect from<br />
1 January <strong>2010</strong>.<br />
The Boards have declared a quarterly interim dividend for Q2 <strong>2010</strong> at the following rates which are equivalent in value at the<br />
rate of exchange applied under the terms of the Equalisation Agreement between the two companies:<br />
Per <strong>Unilever</strong> N.V. ordinary share: € 0.208<br />
Per <strong>Unilever</strong> PLC ordinary share: £ 0.1726<br />
Per <strong>Unilever</strong> N.V. New York share: US$ 0.2750<br />
Per <strong>Unilever</strong> PLC American Depositary Receipt: US$ 0.2750<br />
The quarterly interim dividends have been determined in euros and converted into equivalent sterling and US dollar amounts<br />
using exchange rates issued by the European Central Bank on 3 August <strong>2010</strong>.<br />
The quarterly interim dividends will be payable as from 15 September <strong>2010</strong>, to shareholders registered at close of business on<br />
13 August <strong>2010</strong>. The shares will go ex-dividend on 11 August <strong>2010</strong>.<br />
US dollar checks for the quarterly interim dividend will be mailed on 14 September <strong>2010</strong>, to holders of record at the close of<br />
business on 13 August <strong>2010</strong>. In the case of the NV New York shares, Netherlands withholding tax will be deducted.<br />
The quarterly dividend calendar for the remainder of <strong>2010</strong> will be as follows:<br />
Calendar Year <strong>2010</strong><br />
Announcement Date Ex-Dividend Date Record Date Payment Date<br />
Quarterly dividend – for Q2 <strong>2010</strong> 5 August <strong>2010</strong> 11 August <strong>2010</strong> 13 August <strong>2010</strong> 15 September <strong>2010</strong><br />
Quarterly dividend – for Q3 <strong>2010</strong> 4 November <strong>2010</strong> 10 November <strong>2010</strong> 12 November <strong>2010</strong> 15 December <strong>2010</strong><br />
12 ACQUISITIONS AND DISPOSALS<br />
On 18 January <strong>2010</strong> we announced a definitive agreement with Hormel Foods Corporation to sell our Shedd's Country Crock<br />
branded side dish business in the US. The transaction was completed in February <strong>2010</strong>. Under the terms of the agreement,<br />
Hormel will market and sell Shedd’s Country Crock chilled side-dish products, such as homestyle mashed potatoes, under a<br />
licence agreement.<br />
On 26 April <strong>2010</strong> we announced the agreement with Strauss Holdings Ltd to increase the <strong>Unilever</strong> shareholding in Glidat<br />
Strauss Israel from 51% to 90% for an undisclosed sum. This transaction is subject to anti-trust and regulatory approval, which<br />
is in progress.<br />
On 1 June <strong>2010</strong> we completed the disposal of the Brunch brand in Germany to Bongrain.<br />
On 19 July <strong>2010</strong> we announced the disposal of our frozen foods business in Italy for €805m to Birds Eye Iglo. The transaction is<br />
subject to relevant EU anti-trust regulatory approvals. The assets and liabilities related to this business are reported as held for<br />
sale.<br />
We now expect to complete the acquisition of the Personal Care business of Sara Lee in Q4 <strong>2010</strong>.<br />
13 EVENTS AFTER THE BALANCE SHEET DATE<br />
There were no material post balance sheet events other than those mentioned elsewhere in this report.<br />
16
The directors declare that, to the best of their knowledge:<br />
RESPONSIBILITIES OF DIRECTORS<br />
• this condensed set of interim financial statements, which have been prepared in accordance with IAS 34 ‘Interim<br />
Financial Reporting’, gives a true and fair view of the assets, liabilities, financial position and profit or loss of <strong>Unilever</strong>;<br />
and<br />
• the interim management report gives a fair review of the information required pursuant to UK DTR regulations of<br />
4.2.7 and 4.2.8 and section 5:25d (8)/(9) of the Dutch Act on Financial Supervision (Wet op het financieel toezicht).<br />
<strong>Unilever</strong>’s Directors are listed in the Annual Report and Accounts for 2009, with the exception of the following changes:<br />
• The Rt Hon The Lord Brittan of Spennithorne QC, DL, Professor Wim Dik and Narayana Murthy retired as Non-<br />
Executive Directors on 12 May <strong>2010</strong> following the Group’s AGMs; and<br />
• Jean-Marc Huët became an Executive Director and The Rt Hon Sir Malcolm Rifkind MP became a Non-Executive<br />
Director on 12 May <strong>2010</strong> following their respective appointments at the Group’s AGMs.<br />
Details of all current Directors are available on our website at www.unilever.com<br />
By order of the Board<br />
Paul Polman Jean-Marc Huët<br />
Chief Executive Officer Chief Financial Officer<br />
5 August <strong>2010</strong><br />
17