MSCP - EMC
MSCP - EMC
MSCP - EMC
- No tags were found...

Create successful ePaper yourself
Turn your PDF publications into a flip-book with our unique Google optimized e-Paper software.
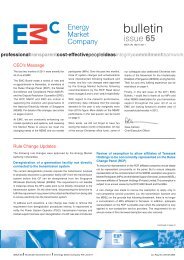
Chart 3a to 3d: Volatility of Regulation Prices since Market Start in 200327502500 02250200017501500125010007505002500Jan Feb Mar Apr May Jun Jul Aug Sep Oct Nov DecRegulation Spot Price for 2003275025002250200017501500125010007505002500Jan Feb M ar Apr M ay Jun Jul Aug Sep Oct Nov DecRegulation Spot Price for 2004275025002250200017501500125010007505002500Jan Feb M ar Apr M ay Jun Jul Aug Sep Oct Nov DecRegulation Spot Price for 2005275025002250200017501500125010007505002500Jan Feb M ar Apr M ay Jun Jul Aug Sep Oct Nov Dec JanRegulation Spot Price for 2006 & Jan 200721. In summary, although average prices and volatility have generally increased inthe regulation market since market start in 2003, the price pattern during thereview period deviated from the trends which were observed prior to that period.OBSERVATIONS AS TO SUPPLY CONDITIONS22. Given that the high regulation prices only emerged in October 2006, the <strong>MSCP</strong>has for the purpose of this investigation used supply data starting from April 2006for supply comparison and analysis. The three supply conditions comprising plantoutages, regulation offer quantities and regulation offer price are consideredbelow.a. Plant Outages23. As shown in Table 2, with the exception of January 2007, there was in general nosignificantly higher level of total planned outages for regulation providers (i.e.combined cycle gas turbines (‘CCGTs’) and steam turbines) during the reviewperiod. The average level of planned outages for such facilities was 609.2MWbetween April 2006 and September 2006 compared to 518.1MW during thereview period.Page 6 of 14