The forage yield potential of Lavina hooded barley
The forage yield potential of Lavina hooded barley
The forage yield potential of Lavina hooded barley
- No tags were found...

You also want an ePaper? Increase the reach of your titles
YUMPU automatically turns print PDFs into web optimized ePapers that Google loves.
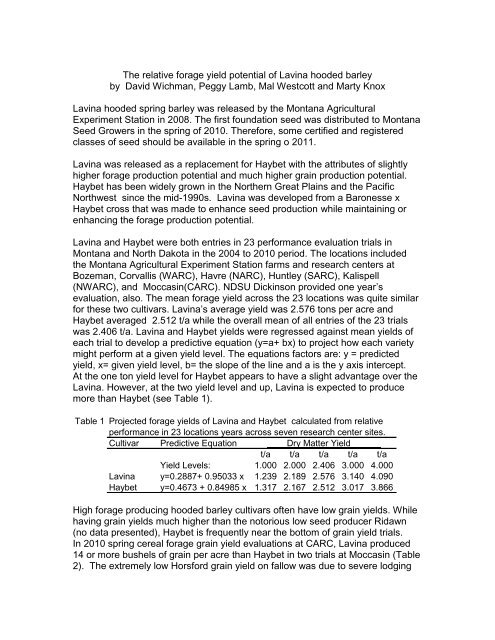
<strong>The</strong> relative <strong>forage</strong> <strong>yield</strong> <strong>potential</strong> <strong>of</strong> <strong>Lavina</strong> <strong>hooded</strong> <strong>barley</strong>by David Wichman, Peggy Lamb, Mal Westcott and Marty Knox<strong>Lavina</strong> <strong>hooded</strong> spring <strong>barley</strong> was released by the Montana AgriculturalExperiment Station in 2008. <strong>The</strong> first foundation seed was distributed to MontanaSeed Growers in the spring <strong>of</strong> 2010. <strong>The</strong>refore, some certified and registeredclasses <strong>of</strong> seed should be available in the spring o 2011.<strong>Lavina</strong> was released as a replacement for Haybet with the attributes <strong>of</strong> slightlyhigher <strong>forage</strong> production <strong>potential</strong> and much higher grain production <strong>potential</strong>.Haybet has been widely grown in the Northern Great Plains and the PacificNorthwest since the mid-1990s. <strong>Lavina</strong> was developed from a Baronesse xHaybet cross that was made to enhance seed production while maintaining orenhancing the <strong>forage</strong> production <strong>potential</strong>.<strong>Lavina</strong> and Haybet were both entries in 23 performance evaluation trials inMontana and North Dakota in the 2004 to 2010 period. <strong>The</strong> locations includedthe Montana Agricultural Experiment Station farms and research centers atBozeman, Corvallis (WARC), Havre (NARC), Huntley (SARC), Kalispell(NWARC), and Moccasin(CARC). NDSU Dickinson provided one year’sevaluation, also. <strong>The</strong> mean <strong>forage</strong> <strong>yield</strong> across the 23 locations was quite similarfor these two cultivars. <strong>Lavina</strong>’s average <strong>yield</strong> was 2.576 tons per acre andHaybet averaged 2.512 t/a while the overall mean <strong>of</strong> all entries <strong>of</strong> the 23 trialswas 2.406 t/a. <strong>Lavina</strong> and Haybet <strong>yield</strong>s were regressed against mean <strong>yield</strong>s <strong>of</strong>each trial to develop a predictive equation (y=a+ bx) to project how each varietymight perform at a given <strong>yield</strong> level. <strong>The</strong> equations factors are: y = predicted<strong>yield</strong>, x= given <strong>yield</strong> level, b= the slope <strong>of</strong> the line and a is the y axis intercept.At the one ton <strong>yield</strong> level for Haybet appears to have a slight advantage over the<strong>Lavina</strong>. However, at the two <strong>yield</strong> level and up, <strong>Lavina</strong> is expected to producemore than Haybet (see Table 1).Table 1 Projected <strong>forage</strong> <strong>yield</strong>s <strong>of</strong> <strong>Lavina</strong> and Haybet calculated from relativeperformance in 23 locations years across seven research center sites.Cultivar Predictive EquationDry Matter Yieldt/a t/a t/a t/a t/aYield Levels: 1.000 2.000 2.406 3.000 4.000<strong>Lavina</strong> y=0.2887+ 0.95033 x 1.239 2.189 2.576 3.140 4.090Haybet y=0.4673 + 0.84985 x 1.317 2.167 2.512 3.017 3.866High <strong>forage</strong> producing <strong>hooded</strong> <strong>barley</strong> cultivars <strong>of</strong>ten have low grain <strong>yield</strong>s. Whilehaving grain <strong>yield</strong>s much higher than the notorious low seed producer Ridawn(no data presented), Haybet is frequently near the bottom <strong>of</strong> grain <strong>yield</strong> trials.In 2010 spring cereal <strong>forage</strong> grain <strong>yield</strong> evaluations at CARC, <strong>Lavina</strong> produced14 or more bushels <strong>of</strong> grain per acre than Haybet in two trials at Moccasin (Table2). <strong>The</strong> extremely low Horsford grain <strong>yield</strong> on fallow was due to severe lodging
caused by the nursery receiving the same nitrogen rate as adjacent spring wheattrials, 60lbs N/ acre. In addition to having lower grain producing <strong>potential</strong>, Haybetis susceptible to severe shatter when conditions are conducive to shatter.<strong>The</strong> 2010 spring cereal <strong>forage</strong> <strong>yield</strong>s at Moccasin, Havre and Corvallis show noone spring cereal <strong>forage</strong> variety is consistently the high <strong>yield</strong>er across an array <strong>of</strong>crop environments (Tables 3-6). Along with variability in <strong>yield</strong> rankings acrosslocations there is variability in quality factor rankings, also. Nitrate levels werewell within the safe to feed for the two Moccasin locations. Nitrate levels at theHavre site were all in the restricted or do not feed ranges. <strong>The</strong> Corvallis site hadnitrate levels ranging safe to feed up through restricted feeding levels.<strong>The</strong> spring cereal <strong>forage</strong> research is funded by the Montana AgriculturalExperiment Station and with variety testing fees. Several research scientists fromthe participating research centers and Extension Forage specialist Dennis Cashcontribute to conducting cereal <strong>forage</strong> trials at the various locations. 2010Cooperating scientist were Mal Westcott and Marty Knox at the WARC Corvallisand Peggy Lamb at the NARC, Havre.Table: 22010 CARC-Fallow and recrop spring cereal <strong>forage</strong> grain <strong>yield</strong>s.Exp 230710 Central Agricultural Resarch Center. Moccasin, Montana.CARC Fallow CARC Continuous CropTest Grain Grain Test GrainCultivar Yield Yield Weight Protein Yield Weight Proteinlbs/a bu\a lbs\bu % bu/a lbs/bu %HB62-2 2783 58.0 49.4 10.8 45.0 46.8 10.8Haxby 3107 64.7 53.1 10.7 47.0 52.3 10.7Haybet 2022 42.1 48.8 11.7 35.0 46.0 11.7Hays 2859 59.6 49.3 11.0 46.0 49.3 11.0Hockett 2764 57.6 53.6 11.1 50.0 53.9 11.1Horsford 1122 23.4 45.8 12.1 39.5 44.9 12.1<strong>Lavina</strong> 2865 59.7 48.3 11.7 49.7 48.1 11.7Stockford 2382 49.6 49.5 10.3 42.3 47.3 10.3Pronghorn 2274 45.4 \1 48.6 12.104T90141-141 2163 43.3 48.7 12.5Mean 2434 49.5 11.4 44.3 48.6 11.2CV 1 10.0 1.3 11.4 6.3LSD (0.05) 417.1 1.466 8.81 5.38Counts per mean 3 2 1 3 3 1Seed Date: 12 Apr 10 into 2008 <strong>barley</strong> stubble and 2009 camelina stubble.Harvest: 20-Aug-10 and 17Aug 10 1/ Triticale bushel is 50lbs.
Table 3 2010 CARC No-till recrop spring cereal <strong>forage</strong> agronomic and quality performance.Exp. 237010 Central Agricultural Research Center. Moccasin, MontanaHead PlantForage Dry MatterSpecies Date Height Content Yield Protein ADF NDF C. Fiber NO3-NJulian cm # t/a % % % % ppmHB62-2 <strong>barley</strong> 182 26 35 2.248 6.9 28.5 51.8 29.2 75Haxby <strong>barley</strong> 181 28 34 2.388 8.9 27.3 49.9 27.9 143Hockett <strong>barley</strong> 182 31 33 2.380 8.5 29.6 51.7 29.1 120Hays <strong>barley</strong> 185 30 33 1.998 7.7 28.0 51.9 29.2 89Haybet <strong>barley</strong> 182 32 34 2.277 7.3 28.7 51.9 28.8 79Horsford <strong>barley</strong> 180 34 32 2.309 7.7 29.2 52.3 29.3 69<strong>Lavina</strong> <strong>barley</strong> 182 31 32 2.502 8.6 29.9 53.9 30.2 72Stockford <strong>barley</strong> 183 31 31 2.303 7.9 27.5 50.4 27.5 65Pronghorn triticale 182 34 27 1.940 8.9 30.1 52.9 29.8 72Mean 182.1 30.8 32.2 2.261 8.038 28.75 51.84 29.00 86.9CV1 7.6 4.0 11.8 11.9 6.2 4.8 6.7 30.8LSD (0.05) 4.1 2.220 ns ns ns ns ns nsCounts per mean 1 3 3 3 2 2 2 2 2Typical toxic threshhold to restrict intake NO 3 -N=350ppmTable: 4 2010 CARC-Fallow spring cereal <strong>forage</strong> variety agronomic performance.Exp 230710 Central Agricultural Resarch Center. Moccasin, Montana.Head Plant Height Forage Dry MatterCultivar Species Date 8-Jul Content <strong>yield</strong> Protein ADF NDF C. Fiber NO 3 -NJulian cm % t/a % % % % ppmHB62-2 <strong>barley</strong> 181 30 35 3.007 7.6 30.3 54.6 28.2 68Haxby <strong>barley</strong> 181 33 32 2.499 7.6 29.1 51.4 26.2 84Haybet <strong>barley</strong> 182 33 37 3.385 8.3 28.5 52.5 26.7 88Hays <strong>barley</strong> 183 29 39 3.525 7.5 27.9 52.4 26.5 85Hockett <strong>barley</strong> 181 33 36 3.073 8.1 27.6 50.2 25.7 89Horsford <strong>barley</strong> 180 34 33 2.642 7.7 27.0 48.6 25.8 127<strong>Lavina</strong> <strong>barley</strong> 182 33 29 2.849 8.5 30.6 54.8 28.2 82Stockford <strong>barley</strong> 182 33 30 2.769 7.7 28.4 51.2 26.7 8204T90141-141 triticale 187 38 29 2.675 9.8 32.7 55.3 29.8 94Pronghorn triticale 183 37 25 2.526 11.4 32.8 55.8 30.6 201Mean 182.2 33.4 32.5 2.895 8.429 29.48 52.67 27.43 99.7CV 1 0.3 4.3 5.4 9.2 8.8 3.2 3.0 3.6 51.1LSD (0.05) 0.87 2.5 3.00 0.46 1.69 2.14 3.55 2.22 nsCounts per mean 3 3 3 3 2 2 2 2 2Typical toxic threshhold to restrict intake NO 3 -N=350ppm
Table 5 2010 NARC dryland (rainfed) fallow spring cereal <strong>forage</strong> <strong>yield</strong> and quality evaluations.Exp 23NARC Northern Agricultural Research Center. Havre, MontanaPlant Forage Dry MatterCultivar/ID Species Head DateHeight Content Yield Protein ADF NDF C. Fiber NO 3 -NJulian in % ton/ac % % % % ppmHB62-2 <strong>barley</strong> 183 30.2 27 2.971 9.2 49.9 53.4 29.1 1050Haxby <strong>barley</strong> 180 32.1 27 2.495 12.6 30.2 51.5 29.1 573Haybet <strong>barley</strong> 180 38.6 26 3.677 13.6 29.1 51.1 28.9 556Hays <strong>barley</strong> 183 32.3 26 3.202 11.1 29.9 51.3 27.7 364Hockett <strong>barley</strong> 184 29.5 29 3.495 10.3 29.8 50.8 29.4 633Horsford <strong>barley</strong> 177 38.2 21 2.112 12.7 32.6 55.7 30.4 1320<strong>Lavina</strong> <strong>barley</strong> 183 31.5 27 3.398 9.0 32.6 53.2 31.5 566Stockford <strong>barley</strong> 180 36.7 25 3.382 9.1 31.1 52.3 29.4 36904T90141-141 triticale 184 50.3 26 2.698 10.5 36.3 58.4 33.7 495Pronghorn triticale 180 43.9 24 2.829 14.5 32.9 54.5 31.5 1048Average 181.5 36.3 25.8 3.026 11.25 33.43 53.22 30.05 697.1LSD (p=0.05) 0.54 3.11 2.393 0.64 3.81 19.86 4.80 2.48 nsCV% 0.17 4.98 5.409 12.31 14.98 26.26 3.99 3.65 0.47Counts per mean 3 3 3 3 2 2 2 2Typical toxic threshhold to restrict intake NO 3 -N=350ppmTable 6 2010 WARC-Corvallis irrigated spring cereal <strong>forage</strong> agronomics and quality evaluations.Exp 23WARC Western Agricultural Research Center. Corvallis, MontanaHead Plant Forage Dry MatterCultivar Entry Date Height Content Yield Protein ADF NDF C.Fiber NO 3 -NJulian inches # t/a % % % % ppmHB62-2 <strong>barley</strong> 188 32 0.27 3.447 9.9 30.9 52.3 27.7 267Haxby <strong>barley</strong> 188 34 0.31 3.421 12.7 28.4 50.0 25.7 315Haybet <strong>barley</strong> 188 38 0.29 3.163 10.3 29.8 49.5 26.2 567Hays <strong>barley</strong> 188 32 0.29 4.165 12.6 31.6 53.7 30.2 675Hockett <strong>barley</strong> 190 37 0.34 4.529 10.5 27.7 48.5 24.3 373Horsford <strong>barley</strong> 179 37 0.23 2.665 12.1 31.2 53.2 28.8 736Stockford <strong>barley</strong> 188 35 0.27 3.585 13.0 30.5 51.3 27.6 509<strong>Lavina</strong> <strong>barley</strong> 188 35 0.26 3.792 11.8 32.9 54.4 28.5 61904T90141-143 triticale 190 52 0.34 3.919 10.0 37.1 59.4 32.5 288Pronghorn triticale 187 48 0.29 3.238 10.5 36.3 56.3 31.2 461Mean 187.2 38.0 0.29 3.592 11.34 31.62 52.87 28.26 480.8CV1 6.7 11.7 17.1 15.1 2.7 3.3 4.4 41.3LSD (0.05) 4.377 0.06 ns ns 1.95 3.922 2.813 nsCounts per mean 3 3 3 2 2 2 2 2Irrigation: total <strong>of</strong> 10 inches in 2 inch sets across the season.Typical toxic threshhold to restrict intake NO 3 -N=350ppm