Improved Print and QC Methods for Oligonucleotide Arrays
Improved Print and QC Methods for Oligonucleotide Arrays
Improved Print and QC Methods for Oligonucleotide Arrays

You also want an ePaper? Increase the reach of your titles
YUMPU automatically turns print PDFs into web optimized ePapers that Google loves.
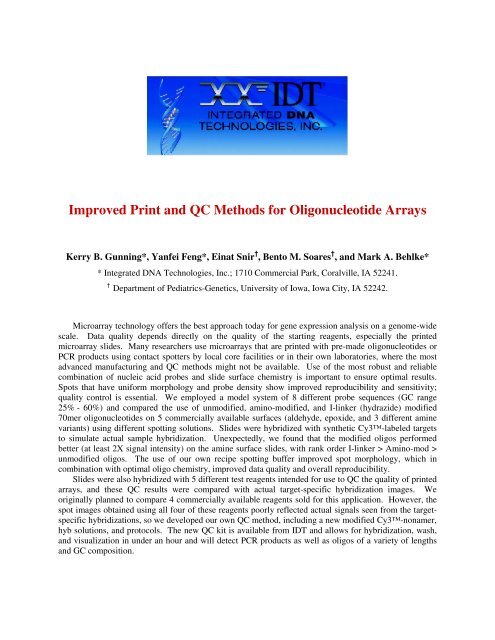
<strong>Improved</strong> <strong>Print</strong> <strong>and</strong> <strong>QC</strong> <strong>Methods</strong> <strong>for</strong> <strong>Oligonucleotide</strong> <strong>Arrays</strong>Kerry B. Gunning*, Yanfei Feng*, Einat Snir † , Bento M. Soares † , <strong>and</strong> Mark A. Behlke** Integrated DNA Technologies, Inc.; 1710 Commercial Park, Coralville, IA 52241.†Department of Pediatrics-Genetics, University of Iowa, Iowa City, IA 52242.Microarray technology offers the best approach today <strong>for</strong> gene expression analysis on a genome-widescale. Data quality depends directly on the quality of the starting reagents, especially the printedmicroarray slides. Many researchers use microarrays that are printed with pre-made oligonucleotides orPCR products using contact spotters by local core facilities or in their own laboratories, where the mostadvanced manufacturing <strong>and</strong> <strong>QC</strong> methods might not be available. Use of the most robust <strong>and</strong> reliablecombination of nucleic acid probes <strong>and</strong> slide surface chemistry is important to ensure optimal results.Spots that have uni<strong>for</strong>m morphology <strong>and</strong> probe density show improved reproducibility <strong>and</strong> sensitivity;quality control is essential. We employed a model system of 8 different probe sequences (GC range25% - 60%) <strong>and</strong> compared the use of unmodified, amino-modified, <strong>and</strong> I-linker (hydrazide) modified70mer oligonucleotides on 5 commercially available surfaces (aldehyde, epoxide, <strong>and</strong> 3 different aminevariants) using different spotting solutions. Slides were hybridized with synthetic Cy3-labeled targetsto simulate actual sample hybridization. Unexpectedly, we found that the modified oligos per<strong>for</strong>medbetter (at least 2X signal intensity) on the amine surface slides, with rank order I-linker > Amino-mod >unmodified oligos. The use of our own recipe spotting buffer improved spot morphology, which incombination with optimal oligo chemistry, improved data quality <strong>and</strong> overall reproducibility.Slides were also hybridized with 5 different test reagents intended <strong>for</strong> use to <strong>QC</strong> the quality of printedarrays, <strong>and</strong> these <strong>QC</strong> results were compared with actual target-specific hybridization images. Weoriginally planned to compare 4 commercially available reagents sold <strong>for</strong> this application. However, thespot images obtained using all four of these reagents poorly reflected actual signals seen from the targetspecifichybridizations, so we developed our own <strong>QC</strong> method, including a new modified Cy3-nonamer,hyb solutions, <strong>and</strong> protocols. The new <strong>QC</strong> kit is available from IDT <strong>and</strong> allows <strong>for</strong> hybridization, wash,<strong>and</strong> visualization in under an hour <strong>and</strong> will detect PCR products as well as oligos of a variety of lengths<strong>and</strong> GC composition.
INTRODUCTIONThe development <strong>and</strong> use of microarrays <strong>for</strong> expression profiling has enabled researchers toinvestigate gene expression across entire genomes in a single experiment. Several competing microarrayplat<strong>for</strong>ms are currently available. These plat<strong>for</strong>ms differ in both type <strong>and</strong> length of immobilized probesas well as in manufacturing technologies, from light-mediated in situ synthesis of oligonucleotides tospotting pre-made oligos or cDNA/PCR products via contact <strong>and</strong> non-contact methods. Common to allplat<strong>for</strong>ms is the fact that the accuracy <strong>and</strong> reliability of the conclusions derived from microarrayexperiments are dependent on the initial quality of the arrays. For arrays manufactured using spottingtechnologies, much attention has been given to the development of slide surfaces, attachment chemistries,<strong>and</strong> spotting solutions. The overall goal is to produce arrays with high sensitivity <strong>and</strong> low variability byoptimizing immobilized probe-density, probe availability <strong>for</strong> hybridization, <strong>and</strong> spot-signal homogeneity.Consequently, assessing array quality <strong>and</strong> comparing the per<strong>for</strong>mance of the competing manufacturingoptions have become crucial to ensure the use of the most robust <strong>and</strong> reliable reagents. Many reagents<strong>and</strong> methods are available <strong>for</strong> array spot <strong>QC</strong> analysis, from ssDNA binding stains (such as POPO-3 orSYBR®-Green II) to fluorescently labeled r<strong>and</strong>om-sequence oligomers. The ssDNA binding stains canassess spot presence <strong>and</strong> morphology but do not assess the functional ability of the immobilized probes tohybridize. The current consensus is that better assessment of microarray quality can be achieved throughhybridization of a fluorescent-labeled oligo.To determine the most reliable <strong>and</strong> robust combination of slide-surface chemistry <strong>and</strong> nucleic acidprobe design, we spotted a test set of eight oligo-probes with different GC-contents using different printbuffer compositions on commercially available epoxy, aldehyde, <strong>and</strong> amine surfaces. Each probe wassynthesized with a hydroxyl (unmodified), amino-modifier, or hydrazide-modifier group on the 5’-end.Hybridization with complementary oligomers showed highest signal intensity <strong>for</strong> the combination ofhydrazide-modified oligonucleotide printed on an amine-derivatized surface. We optimized the printbuffer composition to exploit this attachment strategy <strong>and</strong> tested the method on three different amineslides.Our overall best results were achieved by printing hydrazide-modified oligos on Corning GAPSIIslides in a buffer of our own <strong>for</strong>mulation (OSB, or <strong>Oligonucleotide</strong> Spotting Buffer). In addition, wesynthesized a new modified Cy3-labeled r<strong>and</strong>om 9-mer oligo <strong>for</strong> array <strong>QC</strong> <strong>and</strong> developed an optimizedhybridization method that results in improved detection of spotted oligo probes over a broad range ofGC-content.METHODSOligo <strong>Arrays</strong>Eight 70mer probe-oligo sequences with various 5’-modifications <strong>and</strong> two with different postsynthesispurifications (see Table 1) were printed in replicates using the GMS-417 Arrayer (Affymetrix).The oligo probes were spotted at either 25µM or 30µM in various spotting solutions (see Table 2) on fivecommercially available surfaces (see Table 3). The printed arrays were placed in a humidity chamber <strong>for</strong>3-4 hours <strong>and</strong> stored in a dark, dry (
Table 1:70mer Oligo-Probe Model Set Employed40merSpecific-TargetName 5'-mod. Purification Sequence %GC 5'-dye1-u unmod. desalt AACCAATGATTCATAACAATGTATGTGAAAGTGTAAAATAGAATGTTACTTTGGAATGACTATAAACATT 25.7 Cy31-a amine desalt1-h hydrazide desalt1-A amine HPLC1-H hydrazide HPLC2-u unmod. desalt TTCTTAAATATGTATATGACATTTAAATGTAACTTATTATTTTTTTTGAGACCGAGTCTTGCTCTGTTAC 25.7 Cy32-a amine desalt2-h hydrazide desalt3-u unmod. desalt AGCACTGAACTTTTGAGATATGACGGTGTACTTACTGCCTTGTAGCAAAATAAAGATGTGCCCTTATTTT 37.1 Cy33-a amine desalt3-h hydrazide desalt4-u unmod. desalt ACACCTCTCTTTGTGCTGAATTTCTGGGCCATTCTTTTCCTGTCTTATTTCTAAATTTCCTTCTTCCAAG 38.6 Cy34-a amine desalt4-h hydrazide desalt5-u unmod. desalt CACAAAGCAGTGAATTTATTGGAGCATGACCACGGAGGATAGTATGAGCCCTAAAAATCCAGACTCTTTC 42.9 Cy 5 & Cy35-a amine desalt5-h hydrazide desalt5-A amine HPLC5-H hydrazide HPLC6-u unmod. desalt AGGCAGGTGAGAAGGTGAGAGGTAGGCAAAGGAGATACAAGAGGTCAAAGGTAGCAGTTAAGTACACAAA 45.7 Cy36-a amine desalt6-h hydrazide desalt7-u unmod. desalt ACCGCAAAAAGCACCGGGAGGAGTGAGATGTGGATGTTGCTTTTGCACCTACGGGGGCATCTGAGTCCAG 55.7 Cy37-a amine desalt7-h hydrazide desalt8-u unmod. desalt TCGAGATGTTCCGAGAGCTGAATGAGGCCTTGGAACTCAAGGATGCCCAGGCTGGGAAGGAGCCAGGGGG 60.0 Cy38-a amine desalt8-h hydrazide desaltunmod., unmodified; amine, AmMC6; hydrazide, ILink1.240mer specific-target region is in bold blueTable 2: <strong>Print</strong> Buffers. Table 3: Commercial Slide Surfaces.NameCompositionNameVendorn0.05N NaOH / 0.01% SDSSuperEpoxyTeleChemnb0.05N NaOH / 1.5M BetaineSuperAldehydeTeleChemm0.1M MES pH4.5 / 0.01% SDSSuperAmineTeleChemmbssb0.1M MES pH4.5 / 1.5M Betaine3X SSC pH7 / 0.01% SDS3X SSC pH7 / 1.5M BetaineGAPSIIUltraGAPSCorningCorningD50% DMSOOSBIDT's Oligo Spotting BufferHigh-Density PCR Product <strong>Arrays</strong>PCR products representing 7,296 genes from a human placental expression library were printed intriplicate at 50-83 ng/µl in 50% DMSO on Corning UltraGAPS slides with a Cartesian ProSysprinter using TeleChem Stealth pins. The printed arrays were UV cross-linked (150 mJ, StrategeneStratalinker) <strong>and</strong> stored in a desiccator until use. The slides were pre-hybridized <strong>for</strong> 1 hr <strong>and</strong> hybridized<strong>for</strong> 16 hrs with a target derived from chorion carcinoma cell line (JAR) RNA, labeled with Cy3, <strong>and</strong>human placenta library runoff RNA, used as a reference <strong>and</strong> labeled with Cy5. Labeling reactions <strong>and</strong>hybridizations were done using the 3DNA expression array detection kit (Genisphere), followingmanufacturer’s instructions, using a Lucidea SlidePro Hyb Station (Amersham). The slides werescanned at 5µm resolution on a GenePix scanner (Axon).For nonamer-<strong>QC</strong> reagents, slides were pre-washed in 0.5% SDS <strong>for</strong> 5 mins with agitation, twice inwater <strong>for</strong> 1 min each, <strong>and</strong> air-dried. Cover slip hybridizations were per<strong>for</strong>med <strong>for</strong> 1 hr at room temp in ahumidity chamber using IDT’s Cy3-nonamer <strong>and</strong> TeleChem’s SeeIt. Washes were per<strong>for</strong>medfollowing manufacturer’s instructions (see Table 4). <strong>Arrays</strong> were scanned using a ScanArray® 5000(Perkin Elmer) at 5µm resolution.
Image Analysis <strong>and</strong> QuantificationAnalysis of the oligo-array scans was per<strong>for</strong>med using OptiQuant (Perkin Elmer). The analysisgrid was set so that each cell was of equal size <strong>and</strong> larger than the probe spots. Background was definedby setting an extra analysis-cell column of equal size <strong>and</strong> replicate number to the probe analysis-cellcolumns <strong>and</strong> adjacent to the array in an area contained within the cover slip hybridization area that wasneither printed on nor touched by the printer pins. For each array, the average analysis-cell backgroundwas subtracted from each probe analysis-cell <strong>and</strong> the result was normalized to the area of the probe spot,which was based on the average diameter of the replicates <strong>for</strong> each probe. The replicate values were thencombined to calculate an average DLU/mm2 <strong>and</strong> st<strong>and</strong>ard deviation <strong>for</strong> each probe. The relative percentsignals were then graphed <strong>for</strong> comparisons.Table 4:Comparison of Commercially Available Nonamers <strong>for</strong> Array <strong>QC</strong>.Scanner (Ex/Em)Name Vendor Dye Wave Lenghts Hyb Conditions Wash ConditionsHybChecker Sigma Atto 655 633/670 [?µM] 1X SSC/0.03% SDS <strong>for</strong> 2 minssupplied buffer0.2X SSC <strong>for</strong> 2 mins0.05X SSC <strong>for</strong> 2 minsSpotCheck Genetix Cy3 543/570 [10µM] 2X SSC/0.2% SDS <strong>for</strong> 2 minssupplied buffer2X SSC <strong>for</strong> 2 mins0.5X SSC <strong>for</strong> 20 secsAlexa-546 * Molecular Alexa-546 543/570 [7.5µM] 2X SSC/0.2% SDS <strong>for</strong> 2 minsPanomer Probes 4X SSC 2X SSC <strong>for</strong> 2 mins1mg/ml poly(dA)0.5X SSC <strong>for</strong> 20 secs50mM HEPES pH70.2% SDSSeeIt† TeleChem Cy3 543/570 [10µM] 2X SSC/0.1% sarkosyl <strong>for</strong> 1.5 minsSuperHyb2X SSC <strong>for</strong> 1 mins0.5X SSC <strong>for</strong> 10 secsCy3-Nonamer IDT Cy3 543/570 [2µM] 10X SSC/0.2% sarkosyl <strong>for</strong> 4-5 minssupplied buffer10X SSC <strong>for</strong> 2 mins2X SSC <strong>for</strong> 20 secs* recommended hyb buffer not available from supplier† recommended hyb buffer available; sold separatelyRESULTS AND DISCUSSIONOptimization of Attachment Chemistry & <strong>Print</strong> BufferMicroarrays were printed using 70mer oligonucleotide probes with unmodified, amino-mod, <strong>and</strong>hydrazide-mod 5’-ends on various slide surfaces <strong>and</strong> were hybridized to complementary Cy5-labeledoligo targets. Large variations in signal intensities were observed. Between the different slide surfacechemistries examined, relative signal intensity varied as follows (Figure 1):Amine Surface > Aldehyde Surface >> Epoxy SurfaceNote that the same print conditions, oligo concentrations, hybridization conditions, <strong>and</strong> scanner lasersettings were employed. The epoxy surface had the lowest overall probe-binding capacity of the threesurfaces. <strong>Print</strong> buffer composition also significantly affected final spot morphology <strong>and</strong> image intensity.In general, the addition of betaine to the print buffer improved the sensitivity <strong>and</strong> uni<strong>for</strong>mity of thehybridized array spots on both aldehyde <strong>and</strong> amine surfaces (the sole exception being the sodiumhydroxide buffer where the addition of betaine appears to decrease probe attachment). In the absence ofcovalent-coupling with UV or heat treatment, use of betaine increased relative probe attachment (in rankorder):Hydrazide Modified > Amine Modified > Unmodified oligosThe beneficial effect of betaine was greater on the amine surface than on the aldehyde surface.Unexpectedly, the hydrazide-modification showed best attachment to the amine surface, even though we
expected this modification to offer the greatest advantage using an aldehyde surface where this chemistryis known to undergo a specific covalent attachment reaction.In another series of experiments, the use of hydrazide attachment chemistry was seen to offer evengreater improvement in signal intensity with use of shorter 30mer <strong>and</strong> 50mer oligo probes on amine slides(data not shown).SuperAldehydeSuperAmineSuperEpoxyFigure 1: Initial Comparison of <strong>Print</strong> Buffers <strong>and</strong> AttachmentChemistries. 70mer oligo probes were printed @30µM with a 4-hour humiditytreatment <strong>and</strong> no heat coupling. <strong>Arrays</strong> were hybridized with a Cy5-40merspecific-target @500nM in 1X HybIt® (TeleChem). Image is 20µm resolution scanusing ScanArray® 5000 (Perkin Elmer) at 60/60 laser (power/gain) settings.(Pseudo-color scale: black
We suspect that the hydrazide-modified probes are covalently coupling with the amine-slide surface<strong>and</strong> further that this reaction does not directly involve the primary amine group but rather is an interactionwith other elements of the surface coating. Attachment of hydrazide-oligos varies significantly betweenamine slides from different sources. A total of four different sources were tested (data not shown) <strong>and</strong> theCorning GAPSII <strong>and</strong> UltraGAPS surfaces were the most reactive. Increased probe-density <strong>and</strong> greaterultimate sensitivity can be achieved using IDT’s print buffer <strong>and</strong> hydrazide-modified probes with CorningGAPSII slides. This combination consistently yields more intense hybridization spot signals with greateruni<strong>for</strong>mity than any other combination tested.A) 3X SSC1.5M Betaine IDT 50% DMSOUltraGAPS no heat couplingB) 3X SSC1.5M Betaine IDT 50% DMSOGAPSII no heat couplingC) 3X SSC1.5M Betaine IDT 50% DMSOSuperAmine no heat coupling1-u1-a1-h1-A1-H7-u7-a7-h1-u1-a1-h1-A1-H7-u7-a7-h1-u1-a1-h1-A1-H7-u7-a7-h1-u1-a1-h1-A1-H7-u7-a7-h1-u1-a1-h1-A1-H7-u7-a7-h1-u1-a1-h1-A1-H7-u7-a7-h1-u1-a1-h1-A1-H7-u7-a7-h1-u1-a1-h1-A1-H7-u7-a7-h1-u1-a1-h1-A1-H7-u7-a7-hUltraGAPS w/heat couplingGAPSII w/heat couplingSuperAmine w/heat couplingEffect of Attachment Chemistry, <strong>Print</strong> Buffer, <strong>and</strong> HeatCoupling on Corning UltraGAPS SurfaceEffect of Attachment Chemistry, <strong>Print</strong> Buffer, <strong>and</strong> HeatCoupling on Corning GAPSII SurfaceEffect of Attachment Chemistry, <strong>Print</strong> Buffer, <strong>and</strong> HeatCoupling on TeleChem SuperAmine Surfaceno heatheatno heatheatno heatheat100%100%100%80%80%80%60%60%60%40%40%40%20%20%20%0%1u-sb1a-sb1h-sb1A-sb1H-sb7u-sb7a-sb7h-sb1u-IDT1a-IDT1h-IDT1A-IDT1H-IDT7u-IDT7a-IDT7h-IDT1u-D1a-D1h-D1A-D1H-D7u-D7a-D7h-DAttachment Chemistry & <strong>Print</strong> Buffer0%1u-sb1a-sb1h-sb1A-sb1H-sb7u-sb7a-sb7h-sb1u-IDT1a-IDT1h-IDT1A-IDT1H-IDT7u-IDT7a-IDT7h-IDT1u-D1a-DAttachment Chemistry & <strong>Print</strong> Buffer1h-D1A-D1H-D7u-D7a-D7h-D0%1u-sb1a-sb1h-sb1A-sb1H-sb7u-sb7a-sb7h-sb1u-IDT1a-IDT1h-IDT1A-IDT1H-IDT7u-IDT7a-IDT7h-IDT1u-D1a-DAttachment Chemistry & <strong>Print</strong> Buffer1h-D1A-D1H-D7u-D7a-D7h-DFigure 2: Specific Target Hybridizations Comparing <strong>Print</strong> Buffers <strong>and</strong> AttachmentChemistries on Different Amine Surfaces. 70mer oligo probes (1 is 25.7% GC <strong>and</strong> 7 is 55.7% GC) wereprinted @25µM using 3 different print buffers on UltraGAPS (A), GAPSII (B), <strong>and</strong> SuperAmine (C) slideswith a 3 hour humidity treatment, followed either with (bottom array) or without (top array) heat-coupling.<strong>Arrays</strong> were hybridized with Cy3-40mer specific-targets @200nM each in 1X HybIt® (TeleChem). Imagesare 5µm resolution scans using ScanArray® 5000 (Perkin Elmer) at 63/63 laser (power/gain) settings. (Pseudocolorscale: black
Comparison of Attachment Chemistry & <strong>Print</strong> Buffer on3 Commercial Amine Surfaces (w/out heat coupling)UltraGAPS GAPSII SuperAmineRelative % Signal(bkg sub ave Gross DLU/mm2)100%80%60%40%20%0%1u-sb1a-sb1h-sb1A-sb1H-sb7u-sb7a-sb7h-sb1u-IDT1a-IDT1h-IDT1A-IDT1H-IDT7u-IDT7a-IDT7h-IDT1u-D1a-D1h-D1A-D1H-D7u-D7a-D7h-DAttachment Chemistry & <strong>Print</strong> BufferFigure 3: Hydrazide Attachment Chemistry <strong>and</strong> IDT’s <strong>Print</strong> Buffer Provides <strong>Improved</strong>Per<strong>for</strong>mance on the Corning GAPSII Surface.<strong>Improved</strong> Array <strong>QC</strong> Reagent <strong>and</strong> <strong>Methods</strong>Fluorescent array <strong>QC</strong> reagents from four sources (Sigma, Genetix, Molecular Probes, <strong>and</strong>TeleChem) were tested <strong>for</strong> their ability to visualize oligonucleotide probes printed on CorningUltraGAPS slides. For the range of GC content oligos examined (25% - 60%), none of thesefour reagents reliably identified all the printed probes. We there<strong>for</strong>e developed our own reagentto <strong>QC</strong> arrays that would better meet the need <strong>for</strong> a reagent <strong>and</strong> method that could be used todetect the widest possible variety of probe sequences. A Cy3-labeled r<strong>and</strong>om 9meroligonucleotide was synthesized with base composition adjusted to enhance relativehybridization of AT-rich domains. Hybridization solutions <strong>and</strong> protocols were developed thatoptimized signal while keeping background low; where possible, similar optimization wasattempted <strong>for</strong> the other reagents. Per<strong>for</strong>mance of the new IDT Cy3-nonamer <strong>QC</strong> reagent wascompared with the other four commercially available array <strong>QC</strong> reagents <strong>for</strong> detection of printedoligos <strong>and</strong> is shown in Figure 4. Using optimized protocols, the IDT Cy3-nonamer <strong>and</strong> theTeleChem SeeIt reagent detected all eight of the oligo-probes printed, although the TeleChemreagent needed to be used at 5-fold higher concentration. <strong>Improved</strong> reagent design <strong>and</strong>hybridization protocols enable use of the IDT Cy3-nonamer at much lower levels (2µM vs.7.5-10µM) than other reagents, which helps maintain low background further improvingvisualization of spotted oligos with low GC content while reducing cost.The IDT Cy3-nonamer reagent was next tested along with the other four <strong>QC</strong> products onhigh-density arrays made with PCR products from a cDNA expression library (Figure 5).Interestingly, the new IDT Cy3-nonamer showed similar improved per<strong>for</strong>mance whenhybridized against the long PCR product probes as with shorter oligonucleotide probes.
To determine if array spot quality asvisualized using the IDT <strong>QC</strong> reagent hasutility in predicting the quality of arrayper<strong>for</strong>mance in real target hybridizations, wecompared the <strong>QC</strong> image obtained from aPCR product array with the image obtainedafter actual hybridization with labeledcellular RNAs (Figure 6). In mostinstances, the spot signal intensities from thetwo-color hybridization experiment mirrorthe spot signal intensities from the IDTCy3-nonamer <strong>QC</strong> hybridization. Notethat several spots are “missing” in bothimages. In several cases (see arrows), the<strong>QC</strong> reagent visualized probe spots that werenot seen in actual target RNA hybridization,presumably due to low representation ofthese specific RNA species in the target mix.Significantly, no cases were observed wherePCR product probe spots were detected inthe “real hybridization” <strong>and</strong> absent in the<strong>QC</strong> hybridization. There<strong>for</strong>e the “missingspots” were successfully identified as either“print dropouts” or “target absence” usingthis <strong>QC</strong> method. The ability to discriminatebetween these two events is a critical goal ofarray <strong>QC</strong> analysis since it allows <strong>for</strong>meaningful interpretation of negativehybridization data. Thus, the IDTCy3-nonamer offers greater power <strong>for</strong>array <strong>QC</strong>, with improved sensitivity <strong>and</strong>more accurate assessment of spotted probequality as well as functional availability <strong>for</strong>hybridization.1-u1-a1-h1-A1-H7-u7-a7-hSigmaHybChecker(Cy5 replacement)[?µM]Molecular ProbesAlexa-546 Panomer(Cy3 )[7.5µM]GenetixSpotCheck(Cy3 )[10µM]TeleChemSeeIt(Cy3 )[10µM]IDT Nonamer(Cy3 )[2µM]Figure 4: Comparison of Nonamer <strong>QC</strong> Products. 70mer oligoprobes (1 is 25.7% GC <strong>and</strong> 7 is 55.7% GC) were printed @25µM using IDT’sOSB print buffer on UltraGAPS slides with a 3 hour humidity treatment <strong>and</strong>no heat coupling. Images are 5µm resolution scans using a ScanArray® 5000(Perkin Elmer) at 80/80 laser (power/gain) settings with the Cy5-channel <strong>for</strong>the Sigma HybChecker <strong>and</strong> 73/73 laser (power/gain) settings with theCy3-channel <strong>for</strong> all others. Bold, black arrows indicate low GC-contentprobe-oligos immobilized on surface at low probe-density. (Pseudo-color scale:black
2µMIDT Nonamer60 mins10µMTeleChem SeeIt60 minsLabelFigure 5: IDT vs. Leading Competitor <strong>QC</strong> of High-Density Array. PCR products printed intriplicate on UltraGAPS surface to yield an 18x54mm array with 21,888 spots. Yellow squaresindicate representative replicate sub-arrays corresponding to the images on the right. <strong>QC</strong> hybridizationswere per<strong>for</strong>med <strong>for</strong> 1 hour at room temp following manufactures instructions. Images are 5µmresolution Cy3 scans using a ScanArray® 5000 (Perkin Elmer) at 73/73 laser (power/gain) settings.(Pseudo-color scale: black
IDT NonamerCy3 -JAR vs Cy5 -referenceFigure 6: IDT’s <strong>QC</strong> Product Results vs. Experimental Results on High-Density Array.Left image is from a 1 hour <strong>QC</strong> hybridization using the IDT Cy3-nonamer. Right image is thecorresponding replicate sub-array from an overnight experimental hybridization. White arrowsindicate examples where the absence of experimental hyb signal is due to absence of mRNA target <strong>and</strong>not absence of spotted PCR probe. <strong>QC</strong> hybridization image is 5µm resolution Cy3 scan using aScanArray® 5000 (Perkin Elmer) at 73/73 laser (power/gain) settings. (Pseudo-color scale:black