WELSPUN CORP LIMITED NOTICE
WELSPUN CORP LIMITED NOTICE
WELSPUN CORP LIMITED NOTICE

Create successful ePaper yourself
Turn your PDF publications into a flip-book with our unique Google optimized e-Paper software.
www.welspuncorp.com18th Annual Report 2012 - 13
Financial Highlights (consolidated)155,000105,00055,000Total Income (Rs. Mn)92,44273,82281,36057,582111,8118,0006,0004,0002,0002,135PAT (Rs. Mn)6,104 6,3302,3865,0002008-09 2009-10 2010-11 2011-122012-13-2008-09 2009-10 2010-11 2011-12(704)2012-13Exports/Overseas Revenue* (Rs. Mn)85,00069,089Basic EPS (Rs. / Share)65,00045,00025,0005,00052,603 52,86046,13941,5152008-09 2009-10 2010-11 2011-122012-1341.031.021.011.01.031.7 30.911.510.92008-09 2009-10 2010-11 2011-12(3.0)2012-1314,50012,50010,5008,5006,5004,5002,500500Reported EBITDA (Rs. Mn) @@13,372 @ 13,78411,247 ###10,289^2008-09 2009-10 2010-11 2011-12 2012-13Networth (Rs. Mn)60,00049,139***56,57850,00040,00029,01133,73530,00020,00015,59710,0001,0002008-09 2009-10 2010-11 2011-12 2012-13EBITDA Margin (%)Fixed Assets (Gross Block- Rs. Mn)20.0%15.0%10.0%11.3%18.1%16.9%12.2%9.2%100,00075,00050,00040,682 44,24858,339**103,720**86,957**5.0%25,0000.0%2008-09 2009-10 2010-11 2011-12 2012-13-2008-09 2009-10 2010-11 2011-12 2012-13^ FY 2012 13: Includes other income of Rs. 3,110 million , Total foreign exchange provision was Rs. 1,278 million@@ For FY11, FY12 and FY 13, Other Income, a part of Reported EBITDA includes Interest Income for the respective years### FY 2011 12: Includes Other Income of Rs. 2,676 million which includes interest income of Rs. 1,339 for FY12. Operational Performancewas impacted by foreign exchange provisions on Rs. 1,248 million, and provisions made towards amicable settlement with a customerof Rs. 649 million. Total foreign exchange provision was Rs. 1,517 million.## FY 2010 11 : Includes export rebate of Rs. 734 mn on receipt of favourable judgement from Honorable Supreme Court and provision ofRs. 2,007 mn on account of settlement with one of the customers thereby ending long pending litigation@ FY 10 : Forex Provisoning made in the previous year were recovered during the year# FY 09 : Figures are excluding the extraordinary item :Forex provision of Rs.1,256 mn, Provision on ECB of Rs.178 mn and Inventory writedown of Rs. 385 mn during FY 2008 09.*** Net worth includes CCDs of Rs. 7,884 million.** Includes tangible & intangible assets and CWIP* Includes Deemed Exports
Contents2Corporate Information6Chairman's Statement10Directors' Report20Corporate Governance Report32Management Discussion and Analysis58Corporate Social Responsibility62Financial Section139FAQsForward looking statementIn this Annual Report we have disclosed forward looking information to enable investors comprehend our prospects and take informed investmentdecisions. We have tried, wherever possible, to identify such statements by using words as 'anticipate', 'estimate', 'expects', 'projects', 'intends', 'plans','believes', and words of similar substance in connection with any discussion of the future performance. We cannot guarantee that these forward lookingstatements will be realized, although we believe we have been prudent in our assumptions. Should known or unknown risks or uncertainties materialize,orshould underlying assumptions prove inaccurate, actual results could vary materially from those anticipated, estimated or projected. Readers should bearthis in mind. We undertake no obligation to publicly update any forward looking statements, whether as a result of new information, future events orotherwise.
-------------------------------------------------------------------------------------------------------------------------------------------------------------------------------------------------------------------------------------------------------Corporate InformationCompany Identification Number : L27100GJ1995PLC025609Date of Incorporation: 26th April 1995Date of Being Listed on Stock Exchange: BSE: 27th March 1997NSE: 4th December 2003Type of Business : Manufacturing of Steel Pipes, Plates, Coils, Infrastructure, Oil and Gasand generation of PowerRegistered Capital : Rs. 2500 millionPaid Up Capital : Rs. 1314.74 million divided into 262,948,299 equityshares of Rs.5/- each fully paid-upPar Value / Share : Rs. 5/- eachSecurities Registrar & Transfer Agent: Link Intime India Private Ltd.C- 13, Pannalal Silk Mills Compound,LBS Marg, Bhandup (West),Mumbai - 400078----------------------------------------------------------------------------------------------------------------------------------------------------------------------------------------------------------------------------------------------------------------------------------------Board of DirectorsMr. Balkrishan Goenka( Chairman, Non-Executive)Mr. Braja Mishra( Managing Director)Mr. Rajesh R. Mandawewala(Director)Mr. Mukul Sarkar(Nominee Director of Exim Bank Ltd.)Mr. Mintoo Bhandari(Nominee Director of Insight Solutions Ltd.)Mr. Raj Kumar Jain(Director)Mr. K.H. Viswanathan(Director)Mr. Ram Gopal Sharma(Director)Mr. Nirmal Gangwal(Director)----------------------------------------------------------------------------------------------------------------------------------------------------------------------------------------------------------------------------------------------------------------------------------------Chief Financial OfficerMr. B. R. Jaju (up to 3/6/2013)Mr.S. Krishnan (w.e.f. 3/6/2013)----------------------------------------------------------------------------------------------------------------------------------------------Company SecretaryMr. Pradeep Joshi----------------------------------------------------------------------------------------------------------------------------------------------AuditorsMGB & Co., Chartered Accountants----------------------------------------------------------------------------------------------------------------------------------------------Registered Office“Welspun City”,Village Versamedi, Tal. Anjar, Dist Kutch,Gujarat - 370110Tel: +91-2836-661111Fax: +91-2836-279060----------------------------------------------------------------------------------------------------------------------------------------------Corporate OfficeWelspun House, 5th Floor,Kamala Mills Compound,Senapati Bapat Marg, Lower Parel,Mumbai - 400 013, INDIATel: +91-22-6613 6000/ 2490 8000Fax. +91-22-2490 8020/21E-mail: CompanySecretary_wcl@welspun.comWebsite: http://www.welspuncorp.com----------------------------------------------------------------------------------------------------------------------------------------------Stock exchanges where the Company’s securities are listedBombay Stock Exchange Ltd.Phiroze Jeejeebhoy Towers, Dalal Street, Mumbai - 400 051The National Stock Exchange of India Ltd.Exchange Plaza, Bandra Kurla Complex, Bandra (E),Mumbai - 400 001Singapore Exchange Securities Trading Limited (the“SGX-ST”)2 Shenton Way, #19-00 SGX Centre 1, Singapore - 068804Mr. Utsav Baijal(Nominee Director of Insight Solutions Ltd.)BankersAndhra BankBank of BarodaBank of IndiaCanara BankCentral Bank of IndiaCitibank N.A.Corporation BankDBS Bank LtdExport - Import Bank of IndiaICICI Bank LimitedIDBI Bank LtdOriental Bank of CommercePunjab National BankStandard Chartered BankState Bank of Bikaner & JaipurState Bank of IndiaState Bank of TravancoreThe Hongkong and Shanghai Banking Corporation LimitedUnion Bank of India-----------------------------------------------------------------------------------------------------------------------------Manufacturing Units of the Companyi. Village Jolva & Vadadla, Near Dahej, Taluka : Vagra, Dist.Bharuch, Gujarat - 392 130.ii. Village Versamedi, Tal - Anjar, Dist.- Kutch, Gujarat -370110iii. KIADB Industrial Area, Gejjalagere, Taluka Maddur, Dist.Mandya, Karnataka -571428Manufacturing Units of the Subsidiariesiv. 9301, Frazier Pike, Little Rock , Arkansas 72205, USAv. 2nd Ind City Dammam, Kingdom of Saudi Arabia, P. O.Box 12943, Postal Code 31483vi. Village Salav, P.O. Welspun Baug, District: Raigad 402202. Maharashtra, INDIA
Important Changes and DevelopmentsYEAR2013 - Achieved 1 million MT mark in Production, Sales and Order Booking.- New 175,000 MTPA, HFIW Mill at Little Rock commissioned and received the API certification.- WCL has filed a scheme of proposed demerger of its Pipes and Plates business and other businesses (Infra, DRIand Oil and Gas and Energy) into separate Companies to create renewed business focus and enhance shareholdervalue creation.2012 - Initiated new HFIW mill of 175,000 MTPA in Little Rock, Arkansas, US.- 50,000 MTPA capacity expansion of the already existing 100,000 MTPA HSAW capacity in Mandya, Karnataka.2011 - Welspun Corp Limited acquired 87.35% stake in Welspun Maxsteel Limited (WMSL) from its group company, WelspunSteel Limited as on 18th Aug 2011.- Insight Solutions Limited has acquired 12.5% of the equity of WMSL from Welspun Steel Limited, whileGrasim Industries Limited has acquired the remaining 0.15% equity in Welspun Maxsteel Limited.- WCL raised $290 million in the form of GDRs (US $115 million) issued to Insight Solutions Limited & CCDs (US $175million) issued to Granele Limited.- Saudi plant commenced production.- L-SAW plant at Anjar commissioned.- Welspun Middle East established its presence in Dubai to cater to the bouyant markets of Middle East and Africa.- Acquired 35% stake in Leighton Contractors (India) Private Limited (renamed as Leighton Welspun Contractors PrivateLimited)- Awarded "EEPC Top Exporter for the Year 2011" - Gold Trophy- Awarded "IACC Best Indian Manufacturing Company in the US 2011"2010 - Initiated capacity expansion in India of LSAW by 350,000 MTPA in Anjar, Gujarat, HSAW by 100,000 MTPA in Mandya nearBangalore.- Fund raising of US$ 250 million of which US$ 150 million was raised through FCCB (Foreign Convertible Currency Bonds)in Oct 2009 and $ 100 million through QIP (Qualified Institutional Placement) in Nov 2009.- Foray into the world of infrastructure by way of investment in Welspun Projects Limited (formerly known as MSKProjects India Ltd.)- Completed investment in Middle East company with 300,000 MTPA HSAW facility in Saudi Arabia.- Change in name of Welspun Gujarat Stahl Rohren Limited to “Welspun Corp Limited” w.e.f. 27/04/2010.2009 - Commissioning of the US Pipe Mill in Little Rock Arkansas, with the capacity of 350,000 MTPA of HSAW pipes.- Commissioning of the Coil Mill at Anjar, Gujarat.2008 -ndRecognized as 2 Largest (Large Diameter) Pipe producer in the World by The Financial Times, UK.-thPlate Mill got operational from 28 March 2008. Achieved Level II automation, Rolled X-70 API Grade of 4.5 meters wide.- Double Jointing & Coating facility commissioned at the Little Rock facility in Arkansas U.S.- Awarded “Emerging Company of the Year” for Corporate Excellence 2008 by Economic Times.- Commissioning of additional HSAW Mill with the capacity of 150,000 MTPA at Anjar, Gujarat.2007 - Trail run of Plate Mill producing X 70 grade with widest plate of 4.5 meters and 45 mm thickness.- 43 MW captive Power Plant Commercially Operational from Sept 2007.- Initiated HSAW pipe facility at the Little Rock, Arkansas US.- Largest Ever Order Received by any pipe company i.e. Order from TransCanada Pipelines Limited US.- Ranked amongst India's Top 100 Corporate, 2007 by S&P and CRISIL.- Recognized as the “Fastest Growing Company” by Business Today.- Amongst the top 20 companies to watch out for in 2008 by Business Today.- Recognized as the top 3 SAW Pipe companies in the World by “CLSA Asia Pacific Markets.”- Recognition as “Fastest Growing Steel Products Company” by Construction World NICMAR.
Financials at a GlanceParticulars2013 @Income Statement DataTotal Income111,811Operating Expenses (COGS, Mfg and Other Expenses)101,522Reported EBITDA10,289Normalised EBITDA8,452^Depreciation/ Amortisation4,761Gross Profit597EBIT5,528Finance Costs (Gross)4,931PAT (After Minority Interest)(704)Balance Sheet DataCurrent Assets77,190Current Liabilties51,138Net Current Assets26,052Fixed Assets**75,022Investments (Current and Non Current)18,671Deffered Tax Assets88Gross Debt55,772Cash and Bank Balance7,044Liquid Investments17,494Cash and Liquid Investments24,537Net Debt31,235Net worth56,578Minority Interest3,546Average Shareholders Fund52,697Deffered Tax Liability5,600Capital Employed121,496Capital Employed (Net of Cash and Liquid Investments)96,958Average Capital Employed (Net of Cash and Liquid Investments) 88,982Cash Flow DataNet Cash Flows by Operating Activities1,080Net Cash Flows by Investing Activities(1,672)Net Cash Flows by Financing Activities(2,648)10,901 ### 14,461 ## 13,186 #6,348 *(Rs. in Million)Year ended 31st March (Consolidated)2012 @ 2011 @ 2010 200992,442 81,360 73,822 57,58281,195 67,576 60,450 51,04811,247 13,784 13,372 6,5353,5152,4392,061 1,4333,732 9,104 11,301 4,7687,732 11,345 11,311 5,1023,9992,2402,071 1,7662,385 6,3306,104 2,13578,620 56,995 51,471 45,84857,394 34,774 33,510 39,55521,226 22,221 17,961 6,29363,625 48,645 38,283 37,19019,785 14,4051,596 1,1406653,407 38,060 25,476 26,53810,2557,508 17,028 9,47019,431 14,3661,595 1,13929,686 21,875 18,623 10,60923,721 16,1856,853 15,92948,816 ***33,735 29,011 15,5973,433 2,02441,276 31,373 22,304 15,6355,0364,3443,352 2,488110,692 78,163 57,839 44,62381,006 56,288 39,217 34,01368,647 47,752 36,615 33,07314,2876,6653,843 13,195(22,054) (22,574) (3,885) (7,438)9,6345,5852,767 1,010Financial RatiosEPS Basic (Rs/share)(3.03)10.8930.9531.6911.5EPS Diluted (Rs/share)(3.03)9.7128.6628.4011.4EBITDA Margin (%)9.20%12.17%16.94%18.11%11.35%PAT Margin (%)Net Debt to Shareholders Fund0.63%0.552.58%0.497.78%0.488.27%0.243.71%1.02Net Debt to EBITDA3.042.111.170.512.44Return on Avg. Net worth1.33%5.78%20.18%27.37%13.66%ROCE [EBIT/ (Avg. Capital Employed)]6.20%11.26%23.76%30.89%15.43%@ As per revised Schedule VI^ FY 2012 13: Includes other income of Rs. 3,110 million , Total foreign exchange provision was Rs. 1,273 million### FY 2011 12: Includes Other Income of Rs. 2,676 million which includes interest income for FY12. Operational Performance was impacted by foreign exchangeprovisions on Rs. 1,248 million, and provisions made towards amicable settlement with a customer of Rs. 649 million. Total foreign exchange provision was Rs. 1,517million.## FY 2010 11 : includes export rebate of Rs. 734 mn on receipt of favourable judgment from Honorable Supreme Court and provision of Rs. 2,007 mn on account ofsettlement with one of the customers thereby ending long pending litigation"# FY 2009 10 : Forex Provisioning made in the previous year were recovered during the year* FY 2008 09 : EBITDA would have been higher at Rs.8,167 million which was impacted by Forex provision at Rs.1,256 million,Provision on ECB of Rs.178 million andInventory write down of Rs. 385 million during the year and Net Income would have been higher at Rs.3,336 million.** includes Capital Work In Progress*** Net worth includes CCDs of Rs. 7,884 million.
Financials at a Glance(USD in Million)ParticularsYear ended 31 March (Consolidated)2013 @ 2012 @2011 @ 2010 2009Income Statement DataTotal IncomeOperating Expenses (COGS, Mfg and Other Expenses)Reported EBITDANormalised EBITDA2,0531,864189155^1,9281,693235227 ### 1,7871,484303318 ##1,5551,273282278 # 1,2541,112142138 *Depreciation/ AmortisationGross ProfitEBITFinance Costs (Gross)PAT (After Minority Interest)Balance Sheet Data879810291(13)73151161835054254249491394323823844129311041113847Current AssetsCurrent LiabiltiesNet Current AssetsFixed Assets**Investments (Current and Non Current)Deffered Tax AssetsGross DebtCash and Bank BalanceLiquid InvestmentsCash and Liquid InvestmentsNet DebtNet worthMinority InterestAverage Shareholders FundDeffered Tax LiabilityCapital EmployedCapital Employed (Net of Cash and Liquid Investments)Average Capital Employed (Net of Cash and Liquid Investments)Cash Flow DataNet Cash Flows by Operating ActivitiesNet Cash Flows by Investing ActivitiesNet Cash Flows by Financing Activities1,4229424801,38234421,0271303454845751,042659711032,2381,7861,64220(31)(49)1,5451,1284171,25138911,050202383585466960 ***67811992,1761,5921,349298(460)2011,2787804981,09132385316828343136375645704971,7531,2621,071146(496)1231,1467464008533656737931367153646497751,28887381581(82)58904780124733225231872220931430830849880671652287(162)22Financial RatiosEPS Basic (US $/share)EPS Diluted ( US $ /share)EBITDA Margin (%)PAT Margin (%)Net Debt to Shareholders FundNet Debt to EBITDAReturn on Avg. Net worthROCE [EBIT/ (Avg. Capital Employed)](0.06)(0.06)9.20%0.63%0.553.041.33%6.20%0.230.2012.17%2.58%0.492.115.78%11.26%0.680.6316.94%7.78%0.481.1720.18%23.76%0.670.6018.11%8.27%0.240.5127.37%30.89%0.250.2511.35%3.71%1.022.4413.66%15.43%@ As per revised Schedule VI^ FY 2012 13: Includes other income of Rs. 3,110 million , Total foreign exchange provision was Rs. 1,273 million### FY 2011 12: Includes Other Income of Rs. 2,676 million which includes interest income for FY12. Operational Performance was impacted by foreign exchangeprovisions on Rs. 1,248 million, and provisions made towards amicable settlement with a customer of Rs. 649 million. Total foreign exchange provision was Rs. 1,517million.## FY 2010 11 : includes export rebate of Rs. 734 mn on receipt of favourable judgment from Honorable Supreme Court and provision of Rs. 2,007 mn on account ofsettlement with one of the customers thereby ending long pending litigation"# FY 2009 10 : Forex Provisioning made in the previous year were recovered during the year* FY 2008 09 : EBITDA would have been higher at Rs.8,167 million which was impacted by Forex provision at Rs.1,256 million,Provision on ECB of Rs.178 million andInventory write down of Rs. 385 million during the year and Net Income would have been higher at Rs.3,336 million.** includes Capital Work In Progress*** Net worth includes CCDs of Rs. 7,884 million.Exchange rates used for Balance Sheet Items is Closing rate as on 31 March 54.285 50.875 44.60 44.90 50.72Exchange rates used for Profit & Loss Items is Average rate for the year 54.451 47.946 45.53 47.47 45.91
Chairman’s MessageMy dear fellow stakeholders,I always enjoy this section of our annual report as it allows me to share my vision regarding the company, and highlights the keychanges in the market space and initiatives taken by the company over the last one year. As mentioned in my previous addressesto you, at the beginning of 2012, we have re-entered into depressed capital cycle with fears looming of a double-dip recession.However, I am happy to share that despite the challenging environment, we at Welspun, have come out with a more-thansatisfactoryperformance and have achieved what was eluding us for a long time - the 1 million mark. This was the 1st year that,at Welspun, we have achieved pipe production, customer sales and order booking of 1 million tonnes each, no meanachievement under any circumstances. This performance is even more commendable given the fact that our US plant wasvirtually shut down for over three months due to a fire in the middle of the year. Not only have we strengthened our safety andsecurity measures in US and across all other locations, but we have also taken additional risk coverage through a proper riskmanagement exercise, thus minimizing impact of any further disaster.Order BookReflecting on our order book, as enumerated above, we have achieved 1 million tonnes of new orders at a time when most ofthe customers globally have held back their capital expenditure programs. Not only have we got orders from our long termrepeat customers, but we have also added new clients, the major being Statoil, Norway with whom we entered into a frameagreement for the next 5 years, making us one of the few global suppliers to have achieved such a partnership with globalmajors. This is further testimony to our quality and customer service that has made us one of the largest line pipe companies inthe world.CapacitiesWhile we have successfully completed and commissioned our LSAW mill in Anjar and Spiral pipe expansion in Mandya, this yearwill be best remembered for commissioning of our new HFIW plant in USA. The state-of-art plant with an investment of $80million and plant capacity of 175,000 tonnes per annum will be able to produce pipes ranging from 6"-20'' in multiple wallthickness and length, thus catering to the entire segment of small diameter pipes. The mill is fully operational and has been wellreceived by customers; client accreditations are already in place to serve the burgeoning shale gas market in USA. Clearly, USwill continue to contribute a significant part in our overall global production and sales. Similarly, our facility in Saudi Arabia isnow fully accredited by global oil & gas majors like Saudi Aramco, thus enabling Welspun to service the Middle East oil & gasmarket with local production. We will continue to look for other global manufacturing opportunities in line with our businessmodel - "Think Global Act Local."In the Plate and Coil business, which is facing headwinds, we have decided to execute only profitable orders. Production will beon need basis and we have streamlined operations to significantly reduce costs.Business Re-OrganizationThe board of Welspun Corp decided to re-organize our various business streams so that management focus and time could beoptimized. We have decided to vertically hive off our non pipe and plate business (which includes Infra, Energy and Steelbusinesses) into separate listed entity under 391 to 394 of The Companies Act 1956. The proposed demerger is subject tostakeholders' approval and other statutory clearances and is likely to be completed by January 2014. This demerger will allowWelspun Corp to focus on its core pipe business and grow it globally.We have also reorganized our pipes business into three business units based on geography - the Americas, MENA & Europe andAsia Pacific (including India). We have also formed a vertical for exploring opportunities in new markets. Each business unit isheaded by an independent CEO / Business head, thus providing focused approach to each geography and our esteemedcustomers in these regions.
Financial PerformanceAs you will see in the following sections of this annual report, we have delivered robust sales and earnings for our pipe businessmuch in line with our previous year performance. Our operational EBITDA and Cash PAT are more or less maintained however,we faced some head winds due to external reasons beyond our control which subdued our reported financials. Continuedefforts are in progress to strengthen our Balance Sheet and to improve cash flows. We believe that going forward, once thedemerger is effective we will see strong financial growth through our core pipe business.Corporate Social ResponsibilityBehind every privileged adoration, distinct recognition and illustrious past lies the herculean effort and honest perspiration ofthe whole Welspun family. Welspun believes in the power of knowledge, thus creating several education institutions forchildren and initiatives for women empowerment and gender equality. The combined human resources of Welspun have a verynegligible difference ratio in terms of gender. Our belief in the evolution of higher ecological ethos can be best defined by the3 E's of Welspun's CSR yarn, which comprises of Education, Empowerment & Health and Environment. Through Welspun, morethan 600 women who were under the poverty line are working professionals today with sustainable income and supportivelifestyles; more than 3000 children have found their way into schools and education centers dedicated to bring hope andchange in their lives.Finally, I express my humble gratitude to all the stakeholders including our lenders, our employees, our customers and suppliersand many more who have provided support and co-operation during this challenging environment. I can assure you that as acompany we have built in significant strength to take your company to the highest level of performance and deliver sustainableshareholder value.Many thanksB. K. Goenka
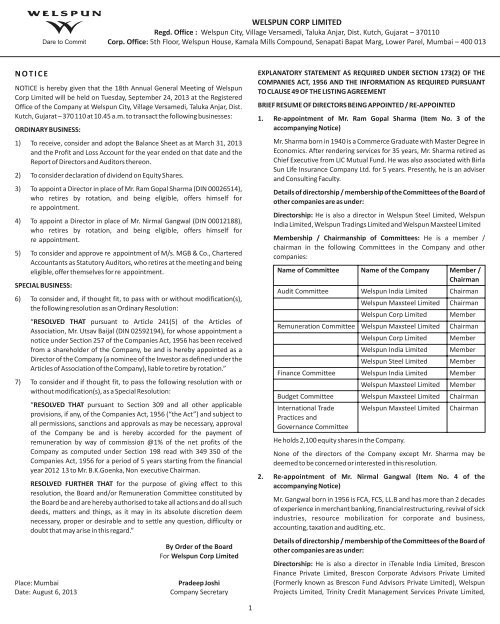
Directors’ ReportTo,The Members,Welspun Corp LimitedYour directors have pleasure in presenting the 18th Annual Report of your Company along with the Audited Financial Statement for thefinancial year ended March 31, 2013.FINANCIAL RESULTSParticularsRevenue from operations (Net)Profit before finance cost, depreciation & taxLess : Finance costGross Profit / (Loss)Less: Depreciation/AmortizationProfit before tax for the year (before exceptional item)Exceptional itemsProfit before tax for the year (after exceptional item)Less : Provision for taxationCurrent TaxationMAT Credit EntitlementDeferred TaxationProfit after tax for the year (after Minority Interest)Add : balance brought forward from previous yearProfit available for appropriationTransfer to General ReserveTransfer to/(from) Debenture Redemption ReserveProposed Dividend on equity shares & taxEquity dividend & tax of earlier yearsBalance carried forward to the next yearPERFORMANCEStandaloneFor the year ended31.03.2013 31.03.201266,321.65 57,697.116,696.73 5,077.552,988.98 2,470.963,707.75 2,606.592,289.91 1,843.521,417.84763.07538.20-879.64763.07126.09(126.09)348.78530.8613,510.3514,041.2153.09(321.92)153.810.2014,156.0371.64(71.64)113.69649.3813,415.4814,064.8665.00357.14132.37-13,510.35Production and processing highlights for the year under report on standalone basis are as under:- Pipes: 631,133 MT (473,617 MT).- Plates: 260,247 MT (399,135 MT). This shows lesser indigenous procurement of plates for manufacturing.- H.R. Coils: 209,546 MT (107,880 MT). This shows more indigenous procurement of coils for manufacturing.- Coating: 4,142 K sqm (2,096 K sqm). This shows more demand for coated pipes.- Power: 122,585 MWH (173,117 MWH).(Rs. in million)ConsolidatedFor the year ended31.03.2013 31.03.2012108,700.50 89,765.7610,289.04 11,246.404,930.77 3,999.245,358.27 7,247.164,761.21 3,515.23597.06 3,731.921,090.87-(493.81) 3,731.9247.19(133.99)477.11(703.23)18,296.9917,593.7656.27(321.92)153.810.2017,705.40(For the above aspects on consolidated basis, refer the Management Discussion and Analysis included in the Annual Report)1,256.06(44.91)291.622,385.4316,466.0718,851.5065.00357.14132.37-18,296.99Depreciation charge for the year under Report increased as compared to the previous year mainly due to capitalization of Offline PipelineProject at Mandya in Karnataka; full year depreciation effect in respect of LSAW Plant and on increased capital expenditure for enhancingproductivity / debottlenecking at Plate and Coil Mill at Anjar.Finance Costs increased mainly on account of interest on increased borrowings in the form of the External Commercial Borrowings andthe Non-Convertible Debentures borrowed/ issued during the year under report and charging of interest on foreign currency convertiblebonds which were capitalized earlier as per Accounting Standard 16 on borrowing cost.Exceptional Items of Rs. 538.20 million is the write off of loan given to Welspun Natural Resources Private Limited (a wholly owned10
subsidiary of the Company) for contributing the Company’s share in the expenditure for Thailand Block of the joint venture Companyviz. Adani Welspun Exploration Limited, which has been relinquished during the year after seismic studies and carrying out detaileddiligence.DIVIDENDThe Board recommends a dividend @ 10% for the year ended March 31, 2013 i.e. Re. 0.50/- per equity share of Rs.5/- each fully paid-up.In respect of the dividend declared for the previous financial years, Rs. 5.30 million remained unclaimed as on March 31, 2013.SCHEME OF ARRANGEMENT IN THE NATURE OF DEMERGERThe Board of Directors of the Company has approved, subject to approval under Sections 391 to 394 and Section 100 of the CompaniesAct, 1956 and other applicable provisions thereof, a scheme of arrangement for restructuring of business by transfer of all the assets andthe liabilities of the infrastructure business (including energy, water, road), the direct reduced iron (DRI) business, oil and gas, and EPCcontracting business (the “Other Businesses”) to Welspun Infra Enterprises Limited (the “Resulting Company”, a wholly owned subsidiaryof the Company), by the Company with the Appointed Date being April 1, 2012 and the share exchange ratio of 1 (one) equity share of Rs.10 each fully paid-up of Welspun Infra Enterprises Limited for every 20 (Twenty) equity shares of Rs. 5 each fully paid-up of the Company(the “Scheme”).The Scheme is subject to approval of the shareholders and the creditors of both the Companies and also the regulators and the Court.Your Board expects that the proposed demerger would enable the Companies to focus on and enhance their respective businesses bystreamlining the operations; to carry on and conduct their respective businesses more efficiently and synergetically; and to pursuedifferent business strategies and raise resources for meeting their respective growth requirements.FUNDS UTILIZATIONDuring the year under report, the Company has raised funds by issuing Secured Non- Convertible Debentures of Rs. 3,428 million, whichhave been utilized for the purposes as mentioned in the respective Information Memorandum issued for the issue. Un-utilized proceedshave been invested in liquid securities as at March 31, 2013.Out of US$150 million Foreign Currency Convertible Bonds (“FCCB”) issued by the Company during the financial year 2009-10, theCompany has bought back and cancelled FCCB of US$68.5 million during the year under review by raising external commercialborrowings and out of internal sources. The FCCBs outstanding as at the end of the year under review were US$81.50 million. Theproceeds have been utilized for the purpose for which the same was raised and pending utilization, the balance is lying in bank accountsoutside India.CHANGE IN THE CAPITAL OF THE COMPANYDuring the year under review, the equity share capital of the Company increased by : I) 128,375 equity shares due to allotment of sharesupon exercise of options under the Employee Stock Option Scheme of the Company; and ii) 35,038,889 equity shares upon compulsoryconversion of One Compulsorily Convertible Debenture.DIRECTORSSince the last report, the following changes took place in the Board of Directors –(i) Mr. Utsav Baijal (DIN – 02592194) was appointed as a nominee of Insight Solutions Ltd. (the “Investor”) w.e.f. November 10, 2012 interms of the Investment Agreement dated June 29, 2011.(ii) Mr. B. K. Goenka relinquished from the position of the Executive Chairman w.e.f. August 14, 2012. However, he continued as the Non-Executive Chairman.In accordance with the provisions of the Companies Act, 1956 and the Articles of Association of the Company, Mr. Ram Gopal Sharma andMr. Nirmal Gangwal retire by rotation at the forthcoming Annual General Meeting and being eligible, have been recommended for reappointment.The term of appointment of Mr. Utsav Baijal expires at the forthcoming Annual General Meeting; the Company has however receivednotice under Section 257 of the Companies Act, 1956 from a member proposing his candidature for the office of a director.11
Details about these Directors are given in the Notice of the ensuing Annual General Meeting being sent to the shareholders along with theAnnual Report.DIRECTORS’ RESPONSIBILITY STATEMENTPursuant to Section 217(2AA) of the Companies Act, 1956, your directors hereby confirm that:(i) in the preparation of the accounts for the financial year ended March 31, 2013, the applicable accounting standards have beenfollowed along with proper explanation relating to material departures;(ii) they have selected such accounting policies and applied them consistently and made judgments and estimates that are reasonableand prudent so as to give a true and fair view of the state of affairs of the Company at the end of the financial year and of the profit ofthe Company for the year under review;(iii) they have taken proper and sufficient care for the maintenance of adequate accounting records in accordance with the provisions ofthe Companies Act, 1956 for safeguarding the assets of the Company and for preventing and detecting fraud and other irregularities;(iv) they have prepared the accounts for the financial year ended March 31, 2013 on a going concern basis.AUDITORSYour Company’s Auditors M/s. MGB & Co., Chartered Accountants retire at the ensuing Annual General Meeting and being eligible, havegiven their consent to act as the Auditors of the Company for the forthcoming tenure. Members are requested to consider their reappointmentas the Auditors of the Company and to fix their remuneration by passing an ordinary resolution under Section 224 of theCompanies Act, 1956.AUDITORS’ REPORTThe Auditors’ observation read with Notes to Accounts are self-explanatory and therefore do not call for any comment.COST AUDIT REPORTThe Company had appointed M/s. Kiran J. Mehta & Co., Cost Accountants as the Cost Auditors of the Company. M/s. Kiran J. Mehta & Co.,a partnership firm of Cost Accountants, is functioning for last three decades. It started in the year 1977 as a proprietorship concern by Mr.Kiran J. Mehta. Mr. Mehta was awarded Certificate of Merit in, the intermediate as well as the final, examinations of ICWAI at the nationallevel. The firm has its head office at Ahmedabad and a Branch at Vadodara.The Company has appointed M/s Kiran J. Mehta and Co., (FRN- 000025) Cost Accountants for conducting Cost Audit for the Company forthe financial year 2012-13. The Cost Audit for the year is in progress and the report will be e-filed to Ministry of Corporate Affairs,Government of India, in due course. The Cost Audit Report for the year 2011-12 was e-filed on December 26, 2012. The extended duedate for e-filing of the Cost Audit report for the year 2011-12 was February 28, 2013.EMPLOYEE STOCK OPTION SCHEMEThe Company has granted stock options toeligible directors and employees of the Company and its subsidiary companies.The particulars required to be disclosed pursuant to Clause12 of SEBI (Employees StockOption Scheme) Guidelines, 1999 are given below:Difference in employee compensation cost based on intrinsic value and fair value:The Company has adopted intrinsic value method for valuation and accounting of the aforesaid stock options as per SEBI guidelines, andaccordingly has accounted credit of Rs. 6.60 million on account of lapse of Options during the year as employee compensation for theyear ended March 31, 2013.Had the Company valued and accounted the aforesaid stock options as per the Black Scholes Model, the net profit for the year wouldhave been higher by Rs. 5.05 million and the diluted earnings per share would have been Rs. 2.31 per share instead of Rs. 2.29 per share.12
Details of stock options as required to be disclosed pursuant to Clause 12 of SEBI (ESOS and ESPS) Guidelines, 1999 are given below:a Options granted During the year, no Option was granted. The Companyhas however agreed to grant, subject to approval of theCentral Government, 2,050,029 Options over a periodof 3 years to the Managing Director.b Options vested (excluding vested portion of lapsed Options) Nilc Options exercised 128,375d Total number of equity shares arising as a result ofexercise of Options128,375e Options lapsed246,875f Total number of Options in force32,875g Money realized by exercise of OptionsRs. 10.27 millionh The pricing formulaExercise price is to be at 25% discount to the latestavailable closing market price of the equity shares ofthe Company, prior to the date of grant.ijkVariation of terms and conditionsEmployee Whole Time Directorswise details Employee who received a grant in anyof options one year of option amounting to 5% orgranted to more of option granted during that yearEmployees, who were granted option,during one year, equal to or exceeding1% of the issued capital (excluding o/swarrants & conversions) :Diluted EPSRs.2.31 as compared to Rs. 2.96 of last yearN.A.o Nilo NiloNilTHE COMPANIES (DISCLOSURE OF PARTICULARS IN THE REPORT OF BOARD OF DIRECTORS) RULES, 1988In terms of the above Rules, your directors are pleased to give the particulars as prescribed therein in the Annexure, which forms a part ofthe Directors’ Report.PARTICULARS OF EMPLOYEESAs per the provisions of Section 217(2A) of the Companies Act, 1956 read with the Companies (Particulars of Employees) Rule, 1975 asamended, the names and other particulars of the employees are set out in the Annexure to the Directors’ Report. However, as per theprovisions of Section 219(1)(b)(iv) of the Companies Act, 1956, the Report and the Accounts are being sent to all the shareholders of theCompany excluding the aforesaid information. Any shareholder interested in obtaining such particulars may write to the CompanySecretary at the Registered Office of the Company.ENERGY, TECHNOLOGY AND FOREIGN EXCHANGEInformation in accordance with the provisions of Section 217(1)(e) of the Companies Act, 1956, regarding conservation of energy,technology absorption and foreign exchange earnings and outgo is given in the Annexure forming part of Directors’ Report.SUBSIDIARY COMPANIESThe Ministry of Corporate Affairs vide its General Circular No. 2 / 2011 dated February 8, 2011 (the “Circular”) granted general exemptionto the companies from attaching a copy of the Balance Sheet, the Profit and Loss Account and other documents of its subsidiarycompanies as required to be attached under Section 212 of the Companies Act, 1956 to the Balance Sheet of the holding companysubject to fulfillment of conditions stipulated in the Circular.Therefore, the said documents of the following subsidiary companies viz. (1) Welspun Pipes Limited, (2) Welspun Tradings Limited, (3)Welspun Natural Resources Private Limited, (4) Welspun Plastics Private Limited, (5) Welspun Pipes Inc, (6) Welspun Tubular LLC, (7)Welspun Global Trade LLC, (8) Welspun Mauritius Holdings Limited, (9) Welspun Middle East Pipe Coatings Company LLC, (10) WelspunMiddle East Pipe Company LLC, (11) Welspun Middle East DMCC, (12) Welspun Maxsteel Limited, (13) Welspun Infratech Limited, (14)Welspun Road Projects Private Limited, (15) Welspun Projects Limited, (16) Welspun Infra Projects Private Limited, (17) MSK Projects(Himmatnagar Bypass) Private Limited, (18) MSK Projects (Kim Mandavi Corridor) Private Limited, (19) Welspun Water Infrastructure13
Private Limited, (20) Welspun Energy Transportation Private Limited, (21) Welspun BoT Projects Private Limited (22) Anjar Road PrivateLimited, (23) Welspun Infra Enterprises Limited and (24) ARSS Bus Terminal Private Limited will not be attached to the Annual Report.However, the aforesaid documents relating to the subsidiary companies and the related detailed information will be made available uponrequest by any member or investor of the Company. Further, the Annual Accounts of the subsidiary companies will be kept open forinspection by a member or an investor at the Registered Office of the Company or the respective subsidiary company.As required under the Circular, a statement containing the requisite information for each subsidiary is attached with this Report.FIXED DEPOSITSThe Company has not accepted any public deposit within the meaning of the Companies (Acceptance of Deposit) Rules, 1975 and, assuch, no amount on account of principal or interest on public deposit was outstanding on the date of the Balance Sheet.LISTING WITH STOCK EXCHANGESThe Company’s equity shares are listed on the Bombay Stock Exchange Limited (BSE) and the National Stock Exchange of India Limited(NSE). The Secured Non-Convertible Debentures are listed on the Bombay Stock Exchange Limited. The Foreign Currency ConvertibleBonds and the Global Depository Receipts are listed at Singapore Securities Trading Limited (SGX-ST).Annual listing fees for the year 2013-14 have been paid to BSE, NSE and SGX-ST<strong>CORP</strong>ORATE GOVERNANCEA separate report on the Corporate Governance is annexed hereto as a part of this Report. A certificate obtained from the CompanySecretary in Practice regarding compliance of the conditions of the Corporate Governance as prescribed under Clause 49 of the ListingAgreement is attached to this Report. A separate report on Management Discussion and Analysis is enclosed as a part of the AnnualReport.CONSOLIDATED FINANCIAL STATEMENTSAs stipulated by the Clause 32 of the Listing Agreement with the Stock Exchanges and Circular No. 2/2011 dated February 8, 2011 issuedby the Ministry of Corporate Affairs under Section 212(8) of the Companies Act, 1956, the Consolidated Financial Statements have beenprepared by the Company in accordance with the applicable Accounting Standards issued by the ICAI. The Audited ConsolidatedFinancial Statements together with Auditors' Report thereon forms a part of the Report.ACKNOWLEDGEMENTYour directors express and place on record deep appreciation to Financial Institutions, Banks, Government Authorities, Customers,Suppliers and Shareholders of the Company. Your directors also wish to place on record their sincere appreciation of the dedicatedservices, hard work, solidarity and profuse support by all the employees of the Company and their families at all levels without which theCompany's achievement would not have been possible.For and on behalf of the BoardPlace: MumbaiDate: May 30, 2013B.K.GoenkaChairman14
FORM – A(See Rule 2)FORM FOR DISCLOSURE OF PARTICULARS WITH RESPECT TO CONSERVATION OF ENERGY2012-2013 2011-2012A. POWER AND FUEL CONSUMPTION1. ELECTRICITY(A) PurchasedUnit (In '000s) MWH47,115.17 25,205.57Total Amount (Rs. In Lacs)3,137.66 1,635.78Rate/Unit (Rs)6.66 6.49(B) Own Generation(I) Through D.G. Set (CPP)Generated Unit (In '000s) MWH16,340.59 17,472.97Units Generated Per Unit Of Fuel- -Cost/Unit (Rs)7.52 6.99(II) Through Steam Turbine / GeneratorGenerated Unit (In ’000) MWH83,586.90 154,972.06Total Amount (Rs. in Lacs)6,531.96 8,205.94Rate / Unit (Rs.)7.81 5.302 COAL (Generation of Steam)Unit (In ’000) kg 293,117.05 281,905.45Total Amount (Rs. in Lacs) 10,309.71 9,657.91Rate / Unit (Rs./kg.) 3.52 3.43OTHER – LIGNITE & LIME STONE (For Generation of Steam)Unit (In ’000) kg 7,789.80 36,221.50Total Amount (Rs. in Lacs ) 193.87 881.66Rate / Unit (Rs./kg.) 2.49 2.433 FURNACE OILQuantity (K. Ltrs.) - 36.20Total Amount (Rs. in Lacs) - 8.74Rate /Unit (Rs./ Ltr.) - 24.164 OTHERS / INTERNAL GENERATIONa. Natural GasQuantity (SCM) (in ‘000) 30,111.23 32,584.34Total Amount (Rs. in Lacs) 9,279.44 8,188.49Rate / Unit (Rs. /SCM) 30.82 25.13b. Liquid Petroleum GasQuantity (MT) (in ‘000) - 87.37Total Amount (Rs. in Lacs) - 35.39Rate / Unit (Rs. SCM/MT) - 40.51B. CONSUMPTION PER UNIT OF PRODUCTIONPRODUCTS STANDARD 2012-2013 2011-2012Name of Product - Welded PipesElectricity - (KWH) - 230.92 126.66Name of Product – M.S. Pipes (ERW)Electricity - (KWH) - 114.68 130.75Name of Product – PowerElectricity-(KWH) - 8.34 6.27Name of Product – M. S. PlatesElectricity-(KWH) - 186.95 152.55Furnace Oil (K. Ltrs.) - - 273.59Natural Gas –(SCM/MT) - 64.28 61.03Name of Product – H. R. CoilsElectricity-(KWH) - 150.79 115.51LPG (MT) - - 5.44FURNACE OIL (K.LTRS) - - -Natural Gas (SCM/MT) - 63.73 63.4815
FORM B(See Rule 2)FORM FOR DISCLOSURE OF PARTICULARS WITH RESPECT TO ABSORPTION, RESEARCH AND DEVELOPMENT (R&D)01 Specific areas in which R&D is carried out by : Anjar Plate Mill:the CompanyDuring the year, the Company carried out the following R&Dactivities :(i) Development of HARDOX 450 grade plates(ii) Trial rolling of X-70 grade coils carried out.(iii) Modification in Laminar cooling system.0203Benefits derived as a result of the above R&D.Future plan of action04 Expenditure on R&D(a) Capital(b) Recurring(c) Total(d) Total R&D expenditure as a percentageof total turnovers.Technology absorption, adaptation and innovation01 Efforts, in brief, made towards technology-absorption, adaptation and innovation.02 Benefits derived as a result of the above efforts, -etc. Product improvement, cost reduction,product development, import substitution, etc.03 In case of imported technology (importedduring the last 5 years reckoned from thebeginning of the financial year), followinginformation may be furnished:a) Technology importedb) Year of importc) Has technology been fully absorbed?d) If not fully absorbed, areas where this hasnot taken place, reasons therefore andfuture plans of action.-Foreign exchange earnings and outgoActivities relating to exports;Initiatives taken to increase exports;Development of new export markets forproducts and services and export plans;Anjar Plate Mill:The R&D activity resulted in reducing the raw material cost &product development.Anjar Plate Mill:The Company has an ongoing program for carrying out R&D whichhelps the Company to improve its production processes andinnovation of higher grade products. The following are future plan ofaction in R&D:(a) Modification will be done to roll plate & coils in 1250mm width.(b) Development of X 80 grade plate.To establish Level 3 automation system.Rs. 3.71 millionsRs. 3.71 millions0.005%Total foreign exchange used and earned* Used : Rs. 99.54 BnEarned : Rs. 263.28 BnConstant endeavor to expand our global presence by entering newmarkets to increase our market while maintaining our focus ondelivering quality products always. We have made substantialbreakthrough in the Far east markets by securing orders fromcompanies of repute in Thailand. Another milestone being entry in theEuropean markets (Framework Agreement with customer), especiallyat times when the market was going through a notable low phase.People with relevant expertise and experience in the above marketsappointed in the marketing role. Marketing Organization restructuredas per the ambitions of the global business. To increase the presenceand visibility, regional offices have been set up in Dubai and have arepresentative from the Company in Europe. This much focusedapproach has led to the fulfilling the business plan targets for regionslike Africa, South East Asia. The Company has leveraged its standingin the industry by receiving major approvals from oil & gas majors inMiddle East, Brazil and Europe.Every concentrated effort had been made during the year to developand enter new territories and the untapped markets. Results haveshown in the form of the new clientele added in the list of our loyalcustomers, various new accreditations and approvals received, asubstantial enquiry base and volume orders from new countries.* Including foreign exchange earned and used by the wholly owned subsidiary of the Company in India viz. Welspun Tradings Limited.16
Key Management TeamMr. B.K. GoenkaChairman(Non Executive)Mr. Braja MishraManaging DirectorMr. R.R. MandawewalaGroup ManagingDirectorMr. David J. DeliePresident,Welspun Pipes Inc.Mr. Akhil JindalDirector,Group Finance& StrategyMr. B. R. JajuChief FinancialOfficer(up to 3/6/2013)Mr. S. KrishnanChief FinancialOfficer(w.e.f. 3/6/2013)Mr. L. T. HotwaniDirector, (Taxation &Accounts CMD Office)Mr. Akbar UmatiyaVice President,Welspun Middle EastMr. Prasanta MukherjeeChief Technical Officer17
Corporate Governance ReportI. PHILOSOPHY ON <strong>CORP</strong>ORATE GOVERNANCEThe Board of Directors of the Company acts as a trustee and assumes fiduciary responsibility of protecting the interests of the membersand other stakeholders of the Company. The Board supports the broad principles of Corporate Governance. In order to attain the highestlevelgood Corporate Governance practice, Board lays strong emphasis on transparency, accountability and integrity.II.BOARD OF DIRECTORSThe Company’s Board comprises of mix of Executive and Non-Executive Directors with considerable experience and expertise across arange of field such as finance and accounts, general management and business strategy. Except the Chairman, the nominee appointed byEXIM Bank and one of the nominee appointed by the Investor, all other Directors are liable to retire by rotation as per the provisions of theCompanies Act, 1956.The composition and category of Directors and relevant details relating to the Directors are given below:Name of the Director(01) Mr. B.K.Goenka -Chairman(02) Mr. Braja Mishra -Managing Director(03) Mr. Rajesh R.Mandawewala(04) Mr. K.H.Viswanathan(05) Mr. Rajkumar Jain(06) Mr. Ram Gopal Sharma(07) Mr. Nirmal Gangwal(08) Mr. Mukul Sarkar - Nominee EXIM Bank(09) Mr. Mintoo Bhandari – Nominee of the Investor(10) Mr. Utsav Baijal-Nominee of the Investor#CategoryBoardMeetingsAttendedduring theYear 2012-13Attendanceat the lastAGMNo. of otherDirectorship(as last declaredto the Company)@ Chairmanship/membership of the Audit Committee and the Shareholders’ Grievance Committee alone considered# Appointed as the nominee of Insight Solutions Ltd. (an investor) w.e.f. November 10, 2012.Abbreviations: P = Promoter, I = Independent, NI = Non Independent, E = Executive Director, NE = Non-Executive Director, L = Lenders, C=Chairman, M=Member.Member /Chairman in No.of Board/Committeesincluding otherCompanies (as lastdeclared to theCompany)@Pub. Pvt OtherBodyCorporateP, N E 6 No 13 5 7 7M, 1CE 6 No 1 7 - -P, NE 7 No 13 4 13 5MNE, I 8 Yes 3 4 - 3M, 1CNE, I 8 Yes 5 2 - 4CNE, I 8 Yes 4 - - 1M, 2CNE, I 5 No 5 3 - 2MNE, I, L 4 No 3 - - -NE, I 8 No 3 2 - 4MNE, I 1 No 6 1 - 1M8 meetings of the Board of Directors were held during the financial year 2012-13 on the following dates: April 26, 2012, May 29, 2012,June 22, 2012, July 27, 2012, August 14, 2012, October 23, 2012, November 10, 2012 and February 14, 2013.It is confirmed that there is no relationship between the directors inter-se.III. AUDIT COMMITTEEThe Audit Committee wasconstitutedbytheBoardofDirectorsatitsmeetingheldonAugust23,1997andwasre-constitutedfromtimetotime.a. Terms of reference: The terms of reference stipulated by the Board of Directors to the Audit Committee are as contained underclause 49 of the Listing Agreement and Section 292-A of the Companies Act, 1956.b. CompositionThe Committee comprises 4 non-executive independent Directors having accounting and finance back-ground. The Chairman of theCommittee is an independent Director.20
The composition of the Committee and attendance of the members is given hereunder:Name of the Member Member/ Chairman Number of Meetings AttendedMr. Rajkumar JainChairman 14Mr. K. H. ViswanathanMember 14Mr. Ram Gopal SharmaMember 14Mr. Mintoo BhandariMember 6** Appointed Observer to attend the remaining 8 meetings of the Committee.The Company Secretary of the Company, Mr. Pradeep Joshi acts as the Secretary of the Committee.14 meetings of the Audit Committee of the Board of Directors were held during the financial year 2012-13 on following dates: May 29,2012, June 22, 2012, July 7, 2012, August 6, 2012, August 14, 2012, September 14, 2012, November 7, 2012, November 10, 2012,December 13, 2012, February 13, 2013, February 14, 2013, February 22, 2013, March 6, 2013 and March 25, 2013.IV. REMUNERATION COMMITTEEThe Company has duly constituted Remuneration Committee consisting of independent, non-executive Directors. During the year underreview, 3 meetings of the Committee were held on April 26, 2012, July 7, 2012 and November 30, 2012. Terms of Reference, composition,remuneration paid to Executive and Non-Executive Directors are as under:a. Terms of ReferenceTo recommend appointment of, and remuneration to, Managerial Personnel and review thereof from time to time.b. Composition of the CommitteeThe Committee comprises of 4 independent and non-executive Directors as on date of this Report viz. Mr. Rajkumar Jain, Mr. K. H.Viswanathan, Mr. Ram Gopal Sharma and Mr. Mintoo Bhandari.c. Remuneration PolicyParticulars of pecuniary relationship or transaction of the Non-Executive Directors vis-à-vis the Company and remuneration to theExecutive Directors including the details of remuneration and sitting fees paid/payable to the Directors for the financial year 2012-13are as under:Name of the Director1 Mr. Braja Mishra -Managing Director2 Mr. B. K. Goenka - Chairman(Non Executive)Salary & Perquisites Commission Contract/ServiceAllowanceTenureRs. 37.21millionPlusRs. 100million asone timejoiningbonusRs. 3.71millionRs. 0.80millionNoticePeriodSeveranceFeesStock OptionNil Yes 1 month Nil 20,50,029 tobe granted inthree equalinstallmentscommencingfrom the dateof receipt ofapproval ofthe CentralGovernmentSittingFeesNilNil1% commissionNo N.A. Nil Nil Nilon profits ascomputedu/s. 349&350 of the Act.Equals toRs. 11.87million*3 Mr. Rajesh R. Mandawewala(Relinquished from theposition of the ManagingDirector w.e.f. April 26, 2012.)Rs. 0.83millionAs perrules of theCompanyNil No N.A. Nil Nil Nil* Subject to approval of shareholders at the forthcoming Annual General Meeting21
No remuneration or perquisite was paid to, and no service contract was entered into with, but the sitting fees were paid to the followingDirectors/ nominating institutions for attending meetings of Board / Committees of the Board.Name of the DirectorSitting Fees (Rs.)1 Mr. K. H. Viswanathan 425,0002 Mr. Rajkumar Jain 389,0003 Mr. Ram Gopal Sharma 389 ,0004 Mr. Nirmal Gangwal 78,0005 Mr. Mukul Sarkar (Nominee of Exim Bank) 66,0006 Mr. Mintoo Bhandari 300,0007 Mr. Utsav Baijal 18,000The above sitting fees paid to the Non-Executive Directors is within the limits prescribed under the Companies Act, 1956 for payment ofsitting fees without approval of the Central Government and hence prior approval of the members as stipulated under Clause 49 (I) (B) isnot required.None of the Directors had any transaction with the Company. However, transactions have taken place with some of the companies inwhich a Director holds Directorship. These transactions took place at the prevailing market value as normal commercial transaction andthe same were disclosed to the Board.V. SHARE TRANSFER AND INVESTORS’ GRIEVANCE COMMITTEEa. CompositionThe Share Transfer and Investors’ Grievance Committee was constituted in accordance with the Clause 49 of the Listing Agreementto look into transfer of securities and redress investors’ complaints and to review the functioning of the investors grievance redressalsystem.The Chairman of the Committee is a Non-Executive Director. The composition of the Committee is given hereunder:Name of the MemberMr. K. H. ViswanathanMr. B. K. GoenkaMr. Rajesh R. MandawewalaMr. Mintoo BhandariMember/ ChairmanChairmanMemberMemberMemberCompliance Officer: Mr. Pradeep Joshi – Company SecretaryMeetings of the Committee are held once in every fortnight or as and when required.b. Number of Shareholders complaints / requests received during the yearDuring the year under review, total 76 shareholders complaints / requests were received. Break-up and number of complaints /requests received under different category is given hereunder:1. Non Receipt of Share Certificate : 32. Non Receipt of Dividend : 523. Non receipt of Annual Report : 144. Others : 7All the complaints/requests received during the year under report were resolved within the stipulated time to the satisfaction of theinvestors/shareholders and no complaints were pending as on March 31, 2013 for more than 30 days. All the shares/debentures receivedfor transfer/transmission were transferred / transmitted and no transfer was pending as at March 31, 2013.22
Remuneration Committee, (4)- Audit Qualifications, and (7) – Whistle Blower Policy of Annexure I D to Clause 49 of the ListingAgreement with the Stock Exchanges.e. Code of ConductThe Company has Code of Conduct for Board members and senior management personnel. A copy of the Code has been put onthe Company's website for information of all the members of the Board and management personnel.All Board members and senior management personnel have affirmed compliance of the same.A declaration signed by the Managing Director of the Company is given below:“I hereby confirm that there were no non-compliance with the Code of Conduct of the Company by any of the Board member orthe senior management personnel.”Sd/-Braja MishraManaging Directorf. Certification by Chief Finance OfficerA certificate obtained from Chief Finance Officer on the Financial Statements of the Company in terms of Clause 49 of the ListingAgreement was placed before the Board, who took note of it and took the same on record.g. Reconciliation of Share Capital AuditA qualified practicing Company Secretary carried out the Reconciliation of Share Capital Audit on quarterly basis to reconcilethe share capital with National Securities Depository Services Limited (“NSDL”) and Central Depository Services Limited(“CDSL”) and the total issued and listed capital. The audit confirms that the total issued / paid-up capital is in agreement with thetotal number of shares in physical form and in demat form held with NSDL and CDSL.h. Brief resume of Director being appointed / re-appointedA brief resume, nature of expertise in specific functional areas, names of companies in which the person already holdsDirectorship and membership of Committees of the Board and his shareholdings in the Company forms part of the Notice of theAnnual General Meeting, attached to this Annual Report.i. Accounting StandardsThe Accounting Standards laid down by the Institute of Chartered Accountants of India and applicable to the Company werefollowed by the Company in preparation of accounts of the Company.IX.MEANS OF COMMUNICATIONThe quarterly, half-yearly and yearly financial results of the Company are sent out to the Stock Exchangesimmediately after they are approved by the Board. The Company published its un-audited/audited financialresults in Western Times (Gujarati edition), Free Press (English edition) & Free Press Journal (English edition).These results are simultaneously posted on the website of the Company atpress release is also available on the website of the Company.www.welspuncorp.com. The officialX. GENERAL SHAREHOLDER INFORMATION1. Annual General Meeting shall be held on Tuesday, September 24, 2013 at 10:45 a.m. at the Registered Office of the Company at“Welspun City”, Village Versamedi, Taluka Anjar, Dist. Kutch, Gujarat - 370110.2. Financial Year of the Company is 1st April to 31st March.3. Date of Book Closure: Monday, September 23, 2013 to Tuesday September 24, 2013 (both days inclusive).4. Dividend payment date: September 27, 2013.5. Listing on Stock Exchanges: The Equity Shares of the Company are listed on National Stock Exchange of India Limited (NSE) andBombay Stock Exchange Limited, Mumbai (BSE), the Secured Redeemable Non-convertible Debentures are listed on BombayStock Exchange Limited and the Foreign Currency Convertible Bonds and Global Depository Receipts are listed on the SingaporeSecurities Trading Limited (SGX-ST)24
Annual listing fees for the year 2013-14 have been paid to BSE, NSE and SGX-ST.Stock Code /Symbol:Bombay Stock Exchange Limited : 532144National Stock Exchange of India Limited: WEL<strong>CORP</strong>; Series: EQISIN No. (For dematerialized shares): INE 191B010256. Stock Market price data, high and low price of equity shares on Bombay Stock Exchange Limited, Mumbai and theNational Stock Exchange of India Limited are as under:BSENSEMonth High (Rs.) Low (Rs.) High (Rs.) Low (Rs.)April–2012May-2012June-2012July-2012August-2012September-2012October-2012November-2012December-2012January-2013February-2013March-2013141.60127.80126.70121.90106.00105.40102.85108.35112.90110.6599.9061.40118.00109.80115.2099.0083.3591.5585.6096.30100.0590.3056.5543.75141.75127.60126.50122.40122.00105.45102.95108.30112.95110.70100.4561.40117.70109.55114.4098.7583.0091.7595.0096.0599.6590.3056.5543.657. Performance in comparison to broad-based indices i.e. BSE- Sensex and NSE- S&P Nifty is as under:MonthBSE Index Closing priceNSEClosing price(Sensex) of Shares (Rs.) (S&P Nifty) of Shares (Rs.)April–201217,318.81125.605,248.15126.00May-201216,218.53118.254,924.25117.55June-201217,429.98118.405,278.9118.50July-201217,236.18102.205,229.00102.10August-201217,429.5693.855,258.5094.20September-201218,762.74101.405,703.30101.35October-201218,505.3896.455,619.7096.70November-201219,339.9105.605,879.85105.75December-201219,426.71106.705,905.10106.40January-201319,894.98100.606,034.75100.50February-201318,861.5458.505,693.0558.35March-201318,835.7750.355,682.5550.358. Registrar and Transfer Agent: The Company has appointed Registrar and Transfer Agent to handle the share /debenturetransfer work and to resolve the complaints of shareholders/ debenture holders. Name, address and telephone number ofRegistrar and Transfer Agent is given hereunder:M/s. Link Intime India Private Limited(Formerly known as : Intime Spectrum Registry Limited)Unit : Welspun Corp LimitedC-13, Pannalal Silk Mills Compound,LBS Marg, Bhandup (West),Mumbai – 400 078.Email - rnt.helpdesk@linkintime.co.inTel. No.: +91-22-25946970Fax No. : +91-22–2594696925
9. Debentures and Debenture TrusteeThe Secured Non Convertible Debentures issued by the Company are listed on BSE with the following identification numbers:BSE Scrip CodeISIN Nos.946799 INE191B07071946864 INE191B07089948244 INE191B07097948245 INE191B07105948249 INE191B07113948250 INE191B07121948505 INE191B07139Debenture Trustee:IDBI Trusteeship Services Limited,Asian Building, Ground Floor, 17, R. Kamani Marg, Ballard Estate,Near Custom House, Mumbai - 400 001.10. Share / Debenture Transfer System: Our Registrar and Transfer Agent registers shares sent for transfer in physical form within15 days from the receipt of the documents, if the same are found in order. Shares under objection are returned within two weeks.11. Distribution of Shareholding:Shareholding Pattern as on March 31, 2013Number of SharesUpto – 500501-1,0001,001 -2,0002,001 -3,0003,001 -4,0004,001 -5,0005,001 -10,00010,001 and aboveTotalNo. ofshareholders69,0563,5921,61352625617928939575,902Percentage ofShareholders90.984.732.130.680.340.240.380.52100.00No. ofShares7,718,6972,818,3482,433,3861,330,137921,053841,9042,145,107244,739,667262,948,299Percentage ofShares held2.941.060.930.510.350.320.8293.0 7100.0012. Shareholding of the Directors of the Company as on March 31, 2013Name of the Director No. of shares %Mr. B. K. GoenkaMr. Rajesh R. MandawewalaMr. Ram Gopal Sharma14020021000.000.000.00None of the other Directors hold any shares or convertible securities in the Company.13. De-materialization of shares and liquidity: As on March 31, 2013, 96.96% shares have been dematerialized and havereasonable liquidity on Bombay Stock Exchange Limited and National Stock Exchange of India Limited.26
14. Outstanding Employee Stock Options, Convertible Bonds and Compulsorily Convertible Debentures, conversion date andlikely impact on equity share capital is as under:Outstanding as on 31.03.2013Impact on equity share capital32,875 Options not vested and not exercisedrepresenting equal number of equity shares to beexercisable up to 20.04.2013815 Foreign Currency Convertible Bonds ofUS$100,000 each convertible in to 13,045,433 equityshares during 27.11.2009 -17.10.2014Increase in equity capital by 32,875 equityshares of Rs.5/- each at a premium of Rs. 61.75per shareIncrease in equity capital by 13,045,433 equityshares of Rs.5/- each at a premium of Rs. 295per share15. Disclosure of Shares held in suspense account under Clause 5A of the Listing Agreement.There are 54,530 unclaimed Equity Shares lying in the suspense account. The voting rights of the unclaimed equity shares havebeen freezed.16. Plant locations of the Company and its subsidiariesi) Plate and Coil Mill and Pipe Plant - Village Versamedi, Tal-Anjar, Dist.-Kutch, Gujarat – 370110ii) Pipe and Coating Plant - Village Jolva and Vadadla, Near Dahej, Tal: Vagra, Dist: Bharuch, Gujarat – 392130iii) Pipe Plant - KIADB Industrial Area, Gejjalagere, Taluka Maddur, Dist. Mandya, Karnataka -571428iv) Pipe and Coating, Double Jointing Plant - 9301, Frazier Pike, Little Rock, Arkansas 72205 USA (Subsidiary’s plant)v) Pipe and Coating Plant - Industrial City-2, Dammam-31483, Kingdom of Saudi Arabia (Subsidiary’s plant).17. Address for correspondenceThe Company Secretary,Welspun Corp Limited5th Floor, Welspun House,Kamala Mills Compound,Senapati Bapat Marg, Lower Parel,Mumbai - 400 013.Tel: +91-22-66136000; +91-22-24908000, Fax: +91-22-24908020 /21e-mail: CompanySecretary_WCL@welspun.com27
CERTIFICATE OF PRACTICING COMPANY SECRETARY ON <strong>CORP</strong>ORATE GOVERNANCE REPORTTo the Members ofWelspun Corp LimitedWe have examined the compliance of conditions of Corporate Governance by Welspun Corp Limited, for the year ended on March 31,2013, as stipulated in Clause 49 of the Listing Agreement of the said Company with stock exchange.The compliance of conditions of Corporate Governance is the responsibility of the management. Our examination was limited toprocedures and implementation thereof, adopted by the Company for ensuring the compliance of the conditions of the CorporateGovernance. It is neither an audit nor an expression of opinion on the financial statements of the Company.In our opinion and to the best of our information and according to the explanation given to us, we certify that the Company has compliedwith the conditions of Corporate Governance as stipulated in the above-mentioned Listing Agreement.We state that in respect of investor grievances received during the year ended March 31, 2013, the Registrars of the Company havecertified that as at March 31, 2013, there were no investor grievances remaining unattended/pending for more than 15/ 30 days asapplicable.We further state that such compliance is neither an assurance as to the future viability of the Company nor the efficiency or effectivenesswith which the management has conducted the affairs of the Company.For Mansi Damania.Company SecretariesMansi DamaniaProprietorCertificate of Practice No. 8120MumbaiMay 30, 201328
Growth at InfinityRs. 108,701 mn. 2013- Achieved 1mn MT mark in production, sales and order booking- New 175,000 tons HFIW mill at Little Rock commissionedand received API certification- Filed a scheme of proposed demerger of its pipes &plates business and other businessestonsInitiative of Setting up new HFIW Plant of 175,000 tons in USSaudi Plant - capacity of 300,000 tons operational29
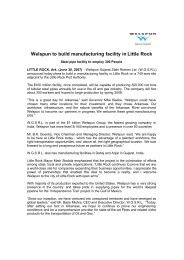
Management Discussion and AnalysisThe Management Discussion and Analysis (MD&A) should be read in conjunction with the Audited Consolidated Financial Statements ofWelspun Corp Limited (”Welspun” or the “Company”), and the notes thereto for the year ended March 31, 2013. This MD&A coversWelspun’s financial position and operations for the year ended March 31, 2013. Amounts are stated in Indian Rupees (in millions) unlessotherwise indicated. Abbreviations and acronyms used in this MD&A are identified in the Glossary of Terms in Welspun’s Annual Report ofFY 2012-13. The numbers used in the analysis are on a consolidated basis, the corresponding number for the previous year have beenregrouped and reclassified wherever necessary.Forward-Looking StatementsThis report contains forward-looking statements, which may be identified by their use of words like ‘plans’, ‘expects’, ‘will’, ‘anticipates’,‘believes’, ‘intends’, ‘projects’, ‘estimates’ or other words of similar meaning. All statements that address expectations or projectionsabout the future, including but not limited to statements about the Company’s strategy for growth, product development, marketposition, expenditures, and financial results, are forward-looking statements. Forward-looking statements are based on certainassumptions and expectations of future events. The Company assumes no responsibility to publicly amend, modify or revise any forwardlooking statements, on the basis of any subsequent developments, information or events.Despite the challenging environment, we have broken the 1 million tonne barrier in pipeproduction, sales and order booking. While the fire in the US plant threatened to jeopardize thisgoal, we showed tremendous resilience to restore full scale production in record time and reachthe coveted mark. While the year saw the ramping up of our LSAW mill in Anjar and expansionof Spiral plant in Mandya, it will be best remembered for the commissioning of our new HFIWplant in USA. Also, to enhance our marketing capabilities and client servicing, we havereorganized the pipe business into three geographical divisions, each under independentBusiness Unit heads. We have also proposed splitting WCL into two distinct listed companiesone for pipes and another for the infra and steel businesses for better management focus.- B. K. Mishra,Managing Director, Welspun Corp LimitedTHE COMPANY OVERVIEWWelspun Corp Ltd (WCL) is one of the largest players globally in the large diameter line pipe segment. The Company has emerged as one ofthe leading names in the industry over the last 15 years and today offers a ‘one stop solution’ in line pipes with its wide product range andspecifications. It has modern state-of-the-art global manufacturing facilities in India, USA and Saudi Arabia for Longitudinal (LSAW), Spiral(HSAW) and ERW/HFIW pipes, with its products manufactured under strict quality standards. Not only does Welspun’s list of clientsinclude some of the biggest names from the Oil and Gas sectors, but the Company is also well known for supplying line pipes to some ofthe most challenging projects in the world like Deepest Pipe line, Longest Pipe Line, Heaviest Pipe line and Highest Pipe line.The Company exports pipes to the global market including some of the most demanding markets in terms of quality and innovation, likethe US and Middle East. With marketing offices in Houston (USA), Dubai (UAE), and Dammam (Saudi Arabia), the Company hasestablished a strong presence in some of the key markets and is able to satisfy existing customers, and reach out to newer customers aswell. The Company has become an approved supplier to over 50 major oil and gas companies across the world. This enables the Companyto participate and bid in key projects across the world.GLOBAL ECONOMIC OVERVIEWThe global economic environment continued to be challenging in FY13. Global economic growth was harder to come by than anticipated,with growth in CY12 reported at 3.2 percent as against International Monetary Fund (IMF) projections of 3.5 percent in early 2012. Thisalso implied a slowdown from the 4.0 per cent growth witnessed in CY11. The key challenges to more widespread global economicgrowth included a prolonged Eurozone crisis; and slowing growth in emerging economies on account of a sharp deceleration in demandfrom key advanced economies, domestic policy tightening, and the end of investment booms in some of the major emerging marketeconomies. One of the key exceptions to the slowdown trend was the US economy which grew faster than in CY11, thanks to astrengthening private sector. (see figure1)32
Figure 110GDP growth across regions8Percentage642WORLDUSAEUROZONECHINAINDIA022011 A 2012 A 2013 E 2014 PSource : IMF ReportGlobal economic prospects have improved but the road to recovery, especially in the advanced economies, will remain bumpy. Accordingto IMF projections, global GDP growth is expected at 3.3 per cent in CY2013, a marginal improvement over the CY12 figure of 3.2 per cent.Downside risks may have been reduced at least for the time being, as advanced economy policymakers have successfully defused two ofthe biggest short-term threats to global recovery, the threat of a euro area breakup and a sharp fiscal contraction in the United Statescaused by a plunge off the “fiscal cliff”. Still, a significant improvement in growth is not expected as fiscal adjustments drag growth inadvanced economies and, in turn, delays cyclical recovery in emerging market and developing economies, especially in China and India.Indian EconomyFor the Indian economy, the slowdown in growth that began in FY12 continued in FY13. For FY13, the growth rate of real GDP is estimatedat 5.0 percent, the slowest pace in a decade. The slowdown has been broad-based, affecting all major sectors of economic activity.Slowdown in industrial sector growth which started in FY12 continued in FY13, bringing down the average industrial growth to 3.3percent from an average of 9.2 percent during the preceding two years. Continued weakness in the industrial sector dragged downgrowth in services as well, bringing down its projected rate of growth at an 11-year low of 6.6 percent. Although persistent weakness inthe global environment contributed to the slowdown in growth, the adverse contagion effects from the Eurozone debt crisis explain onlya small part of the overall deceleration. (See figure 2) The key challenges facing the economy included a record current account deficitcoupled with a high fiscal deficit and stubbornly high inflation, with the Reserve Bank of India (RBI) finding it difficult to strike a balancebetween monetary stimulus and price restraint.Key Financial Indicators - IndiaFigure 21412Percentage1086422008-20092009-20102010-20112011-20122012-20130GDPGrowthSource: RBIInvestmentGrowthAvg. WPIInflationCurrent AccountDeficitRecovery in 2013-14 is expected to be modest. Subdued domestic business confidence, coupled with supply constraints, such as shortageof coal and natural gas, stoppage of mining in some states and delays in commissioning of large projects are expected to drag downgrowth for some more time. However, there is reason for optimism. Pick up of growth in consumption expenditure and gross fixed capitalformation in the second half of FY13 suggest that the slowdown in demand may be bottoming out. With output growth slowing, headlineinflation has fallen to its lowest level in over three years. This has prompted RBI to lower policy rates twice in the last quarter of FY13 andto follow it up with another cut in the first quarter of FY14. With interest rates on a downward trajectory, investment is expected to pickup. Policy action to reduce fuel subsidies and the recently presented fiscal 2014 Union Budget has reaffirmed the government’s commitmentto fiscal consolidation.33
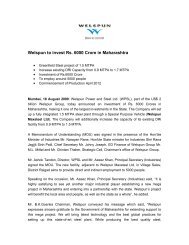
Foreign ExchangeThe Indian Rupee has been very volatile against the US dollar and other major currencies over the last year. Against the US dollar, from ahigh of 50.88 in April 2012, it depreciated sharply to around 57.16 levels in June 2012. It started appreciating post-June, reaching 51.85 inOctober 2012. But since then, the rupee has weakened closing the financial year at close to 55 levels. This volatility has created furtheruncertainty for companies, affecting both Importers and Exporters in equal measure. Figure 3 shows the exchange rate fluctuationsduring the year for USD-INR.Figure 3USD vs. INR58.0057.0057.1656.0055.0054.2854.0053.0052.0051.8651.00 50.8850.0049.0048.00Apr 12 May 12 Jun 12 Jul 12 Aug 12 Sept 12 Oct 12 Nov 12 Dec 12 Jan 13 Feb 13 Mar 13Source: x rates.comGLOBAL ENERGY DEMANDThe global energy landscape is changing, with potentially far-reaching consequences for energy markets and trade. It is being mapped bythe resurgence in oil and gas production in the United States and could be further reshaped by a retreat from nuclear power in somecountries, continued rapid growth in the use of wind and solar technologies and by the global spread of unconventional gas production.Increasing policy focus on energy efficiency in various countries is expected to be a game changer for the energy industry.Global energy demand is expected to increase by over one‐third in the period to 2035. Emerging economies are expected to be at theforefront to drive global energy markets with the share of non‐OECD energy demand rising from 55% in 2010 to 65% in 2035. China wouldaccount for the largest share of the growth in global energy use, with its demand rising 60% by 2035, followed by India (where demand isexpected to more than double) and the Middle East. OECD energy demand in 2035 is predicted to be just 3% higher than in 2010, butthere are dramatic shifts in its energy mix as fuel substitution will see the collective share of oil and coal drop by fifteen percentage pointsto 42%.Figure 4Share of global energy demand100%80%60%40%6,030 Mtoe 12, 380 Mtoe 16,730 MtoeRest of non-OECDMiddle EastIndiaChinaOECD20%1975 2010 2035Source: IEA World Energy Outlook, Nov 2012Fossil fuels remain the principal sources of energy worldwide, though renewable energy is expected to grow rapidly. Demand for oil, gasand coal will grow in absolute terms through 2035, but their combined share of the global energy mix has been calculated to fall from 81%to 75% during that period. The unlocking of unconventional resources portends a very bright future for natural gas and is expected toovertake coal in the primary energy supply mix by 2035.An energy renaissance in the United States is redrawing the global energy map, with implications for energy markets and trade. TheUnited States, which currently imports around 20% of its total energy needs, is on its way to become self‐sufficient in net terms by 2035thanks to rising production of oil, shale gas and bio-energy, and improved fuel efficiency in transport. Falling US oil imports mean thatNorth America will become net oil exporter by approximately 2030, accelerating the ongoing shift in the international oil trade towardsAsian markets, putting greater focus on the security of strategic routes that link them to the Middle East .34
Figure 5Middle East oil export by destinationmb/d 7200062011520354321China India Japan & Korea EuropeSource: IEA World Energy Outlook, Nov 2012United StatesGLOBAL OIL SCENARIOThe outlook for long-term oil demand is presented in Figure 6. Global oil demand is expected to increase by over 20 mb/d over the period2010–2035, reaching 107.3 mb/d by 2035. OECD demand peaked in 2005 and over the longer term, is expected to see a steady decline.Overall, 87% of the increase in global demand is in developing Asia, where demand is estimated to reach 90% of that of the OECD by 2035.Figure 6World Oil Demand Outlook, 2010 – 2035 (mb/d)2010 2015 2020 2025 2030 2035OECD America 24.1 23.7 23.5 23.0 22.4 21.7OECD Europe 14.7 13.7 13.4 13.0 12.6 12.1OECD Asia Oceania 8.1 8.4 8.2 8.0 7.6 7.3OECD 46.8 45.8 45.2 44.0 42.6 41.1Latin America 4.9 5.4 5.8 6.1 6.4 6.6Middle East & Africa 3.3 3.8 4.1 4.5 4.8 5.1India 3.3 4.0 4.9 6.0 7.4 9.0China 9.0 11.1 13.2 15.0 16.4 17.6Other Asia 6.8 7.5 8.4 9.1 9.7 10.3OPEC 8.1 9.0 9.8 10.6 11.4 12.0Developing countries 35.4 40.8 46.3 51.3 56.0 60.6Russia 3.2 3.5 3.6 3.6 3.6 3.6Other Eurasia 1.6 1.7 1.8 1.9 2.0 2.1Eurasia 4.8 5.2 5.4 5.5 5.6 5.6World 87.0 91.8 96.9 100.9 104.2 107.3Source: OPEC World Oil Outlook 2012ReportFigure 730Growth in Oil Demand, 2010 – 2035 (mb/d)25OPEC201587% of the growthin oil demand is indeveloping AsiaChinaOther Asia1050–5OECD oil demandpeaked in 2005OECD AmericaOECD EuropeOECD and Eurasian countriesSource: OPEC World Oil Outlook 2012ReportIndiaMiddle East & AfricaLatin AmericaDeveloping countriesNorth America and Iraq will be the key geographies which are expected to play a major role in reshaping the oil industry in the comingyears.United States Oil ScenarioThe United States is projected to become the largest global oil producer before 2020, exceeding Saudi Arabia until the mid‐2020s. At thesame time, new fuel‐efficiency measures in transport begin to curb US oil demand. The result is a continued fall in US oil imports, to theextent that North America is on the path to become a net oil exporter around 2030. This significant change in North America's positionimpacts the switch in direction of international oil trade towards Asia, putting a focus on the security of the strategic routes that bringMiddle East oil to Asian markets. The United States, which currently imports around 20% of its total energy needs, is expected to becomeall but self‐sufficient in net terms by 2035 (see figure 8)– a dramatic reversal of the trend seen in most other energy‐importing countries.35
Figure 8mboe/d25US oil and gas production2015Unconventional gas105Conventional gasUnconventional oilConventional oil1980 1990 2000 2010 2020 2030 2035Source: IEA World Energy Outlook, Nov 2012Canada Oil ScenarioIn 2012, total Canadian production increased from 2011 levels by 223,000 b/d to reach 3.2 million b/d. Continued growth is forecast in thelong term with production expected to reach 6.7 million b/d by 2030. Of this, oil sands production is expected to contribute 5.2 millionb/d. On the conventional oil side, declining eastern Canada production is expected to be offset by growth from western Canada, socombined production stabilizes at a level of almost 1.5 million b/d. Figure 9 shows the forecast for total Canadian production dividedbetween eastern and western Canada.Figure 9Canadian Crude Oil Productionmillion b/d 2012 2015 2020 2025 2030Total* Canadian(including oil sands)3.2 3.9 4.9 6.0 6.7Eastern Canada 0.2 0.2 0.2 0.2 0.1Western CanadaConventional 1.2 1.4 1.4 1.4 1.4(including condensate)Oil Sands 1.8 2.3 3.2 4.5 5.2*Totals may not add up due to rounding.Source: CAPP Crude Oil Report, 2013.Iraq Oil ScenarioIraq would account for 45% of the growth in global oil production to 2035 and become the second-largest global oil exporter, overtakingRussia. Iraq’s energy sector holds the key to the country’s future prosperity and can make a major contribution to the stability and securityof global energy markets. According to the IEA, Iraq is already the world’s third‐largest oil exporter and has the resources and plans toincrease its oil and natural gas production as it recovers from three decades punctuated by conflict and instability. Success in developingIraq’s hydrocarbon potential and effective management of the resulting revenues can fuel Iraq’s social and economic development.Failure will hinder Iraq’s recovery and put global energy markets on course for troubled waters.Iraq’s oil production is expected to reach 6.1 mb/d by 2020 (more than double from current production levels) and 8.3 mb/d by 2035. Thelargest increase in production is to come from the super‐giant fields in the south of Iraq, around Basrah. The increase in Iraqi oilproduction of more than 5 mb/d over the period to 2035 makes Iraq by far the largest contributor to global supply growth (accounting for45% of the anticipated growth in global output), overtaking Russia in the 2030s to become the world’s second‐largest oil exporter(see figure 10). The growth of Iraq’s production means that it becomes a key supplier to fast‐growing Asian markets, mainly China.36
Figure 10mb/d987654321Iraq oil productionNorthCentreSouthmb/d 987654321Iraq oil exportsOtherAsia2012 2020 2035Source: IEA World Energy Outlook, Nov 20122012 2020 2035GLOBAL GAS SCENARIOWhile the regional picture for natural gas varies, the global outlook over the coming decades looks to be bright, as demand increases by50% to 169 trillion cubic feet in 2035. Unconventional gas accounts for nearly half of the increase in global gas production to 2035, withmost of the increase coming from China, the United States and Australia. But the unconventional gas business is still in its formative years,with uncertainty in many countries about the extent and quality of the resource base and concerns about the environmental impact ofproduction. Public confidence can be underpinned by robust regulatory frameworks and exemplary industry performance. By bolsteringand diversifying sources of supply, tempering demand for imports (as in China) and fostering the emergence of new exporting countries(as in the United States), unconventional gas can accelerate movement towards more diversified trade flows, putting pressure onconventional gas suppliers and on traditional oil linked pricing mechanisms for gas.Figure 11Major global gas trade flows, 2035Source: IEA World Energy Outlook, Nov 2012Natural GasGlobal growth in natural gas use slowed in 2012 (2.0% vs. average of 2.8% in the past decade), although it still exceeded that of oil andtotal energy use. Among the headwinds facing gas are continuing weak demand in Europe, resilience of coal in North America as well aspersistent bottlenecks and disruptions in the LNG value chain that in 2012 caused an exceptional global decline of LNG supply. At thesame time, Asian demand for gas remains red-hot, and gas is beginning to gain traction as a transport fuel.Natural Gas consumption was 111 trillion cubic feet in 2008 and would reach 169 trillion cubic feet by 2035 as per IEA estimates. Thenatural gas supply is becoming larger and is getting spread over many regions and locations, which shall continue to fuel the demand forpipeline infrastructure. Natural gas is the world's fastest-growing fossil fuel, with consumption expected to increase at an average rate of1.6% per year from 2008 to 2035. Growth in consumption occurs in every region and is most concentrated in Non-OECD countries, wheredemand increases nearly three times as fast as in OECD countries. Increases in production in the Non-OECD regions more than meet theirprojected consumption growth, and as a result Non-OECD exports to OECD countries will grow through 2035. Non-OECD producers willaccount for more than 81 % of the total growth in world natural gas production from 2008 to 2035.37
Figure 12World Natural Gas Consumption (in trillion cubic feet), 2008 - 2035150111123133144157169Non OECD10050OECD02008 2015 2020 2025 2030 2035Source: IEA Report Number: DOE/EIA 0484(2012)The largest production increases from 2008 to 2035 are projected for the Middle East (15.3 trillion cubic feet) and non-OECD Asia (11.8trillion cubic feet). Iran and Qatar increase natural gas production by a combined 10.7 trillion cubic feet, or nearly one-fifth of the totalincrement in world gas production.Shale GasShale gas has become an increasingly important source of natural gas and crude oil in not just the United States over the past decade, butalso in other parts of the world like Canada, Europe, Asia and Australia. Shale gas has been referred to as “the biggest energy innovation ofthe decade” by world renowned energy economist Mr. Daniel Yergin.The Initial assessment of shale gas resources in 48 major shale basins in 32 countries indicates a large potential of Shale gas finds all acrossthe globe.An analysis in the US Annual Energy Outlook 2013 indicates Shale gas production, which grows by 113 percent from 2011 to 2040, is thegreatest contributor to natural gas production growth. Its share of total production increases from 34 percent in 2011 to 50 percent in2040. Tight gas and coal-bed methane production also increase, by 25 percent and 24 percent, respectively, from 2011 to 2040, even astheir shares of total production decline slightly. The growth in coalbed methane production is not realized until after 2035, when naturalgas prices and demand levels are high enough to spur more drilling.Figure 13US Natural Gas Production, 1990-2035 (trillion cubic feet per year)40History 2011 Projections3020Shale gasTight gas10Lower 48 onshore conventionalAlaskaLower 48 offshoreCoalbed methane01990 2000 2010 2020 2030 2040Source : U.S. Energy Information Administration | Annual Energy Outlook 2013The availability of large shale gas reserves in the US has led some to propose natural gas-fired power plants as lower-carbon emissionreplacements for coal plants, and as backup power sources for wind energy.Natural Gas Scenario – IndiaNatural Gas contributes to about 10 per cent to the primary energy mix of the country, as compared to the global average share of gas of24 per cent. With the country's primary energy consumption growing over 4% CAGR and natural gas expected to increase its share in thethtotal energy mix, natural gas demand is expected to grow at more than 5% in the 13 five-year plan period.Although the gas production in domestic fields has been falling in recent years, it is expected to pick up in coming years due to the recent38
policy changes in gas prices. The significant increase in gas prices from US$4.2/mmbtu to US$ 8.4/mmbtu (expected) from April 2014should provide impetus for higher domestic production. The prospects for non conventional sources like shale and CBM are still atnascent stages. While four rounds of CBM block allocation has been completed with Raniganj (West Bengal) block starting commercialproduction to serve clients from the Durgapur-Asansol belt, bidding for shale gas exploration is expected to be launched towards the endof 2013. ONGC and OIL are aggressively implementing pilot projects to assess the shale gas potential in the country while RelianceIndustries Limited (RIL) and GAIL have entered the US shale industry to gain technical expertise and may apply that expertise indeveloping shale gas reserves in India.Import of gas is also expected to go up in spite of the anticipated increase in domestic production. Currently, more than a quarter ofIndia's gas demand is met through LNG imports and spot gas. LNG regasification capacity in India is 12.5 mtpa which is expected to reacharound 40-45 mtpa by 2016, if all proposed terminals are commissioned on time.The $ 7.6 billion Turkmenistan-Afghanistan-Pakistan-India (TAPI) gas pipeline for supplying 3.2 billion cubic feet of natural gas per day, hasalready finalized the Gas Sale Purchase Agreement (GSPA) and the transit fee with all the participating countries. Gas Authority of IndiaLtd (GAIL) has also tied up to commence shale gas imports from 2016-17 from the US. Under the initial contracts, the fuel is estimated to bepriced at $10-11 per mmbtu. These developments are expected to accelerate the market share of natural gas in the country's energy mix.GLOBAL STEEL PIPE INDUSTRY2012-13 was a challenging year for the global pipe industry. In the year, the industry continued to be characterized by excess capacity andlow utilization levels. Part of the reason was a slowdown in oil and gas demand in Europe triggered by the economic crisis there. It wasfurther exacerbated by end of some large projects as well as uncertainty in certain upcoming projects.However, the outlook for the industry looks brighter. The global pipeline demand as per Simdex for the projects starting from 2013 to2017 is about 673 projects resulting in an opportunity for supplies of more than US$ 356 billion across geographies as presented in Figure 14Figure 14Future pipeline projects (Projects starting in 2013 -2017)NumberGeographical Zoneof projectsLengthBusiness value(km in '000) (miles in '000) (billon USD)North America 229 64 40 69Latin America 48 33 20 52Europe 119 36 22 65Africa 62 25 16 31Middle East 92 25 16 40Asia 76 40 25 73Australasia 47 14 9 26TOTAL 673 237 148 356Source : Simdex data as on 14 may 2013Several large projects are in an advanced stage, which should convert to orders over the next couple of years.KEY UPCOMING PROJECTSCanadian PipelinesCanada has huge proven reserves of oil (175 bn bbl) making it the country with world’s 3rd largest proven reserve. It also has hugereserves of natural gas (61 tcf) and shale gas (355 tcf). Canada produces 50% more oil and double the natural gas it consumes and theexcess is exported. More than 97% of Canada’s crude exports and 63% of natural gas exports go to the US, mainly through pipelines. Thisis expected to reduce over a period of time as US achieves self sufficiency, thanks to the shale gas boom. For instance, US net importrequirement for oil is expected to fall by 64%, whereas there will be 153% rise in demand in China and 132% rise in other Asian Markets.Hence, Canada will have to build pipelines to take its oil and gas to new markets and de-risk its economy.Similarly, most of Canada’s oil and gas is located on the western part of the country which is landlocked. Refineries on the eastern coast ofCanada currently rely on imports. In 2012, Canada imported more than 600,000 barrels per day to supply its Eastern refineries. Thereforenew pipelines are required to transport the crude oil from the Western Canada Sedimentary Basin (WCSB) to key export marketsincluding eastern Canada, Asia and the U.S. Gulf Coast.There are several pipelines being planned to cater to this demand. Some of the key ones are:Energy East pipeline - The Energy East Pipeline project involves converting natural gas pipeline capacity in approximately 3,000kilometres of TransCanada’s existing Canadian Mainline to crude oil service and constructing up to approximately 1,400 kilometres of39
new pipeline. The project will have the capacity to transport as much as 850,000 barrels of crude oil per day, greatly enhancing produceraccess to markets in Eastern Canada. The Energy East Pipeline could eliminate Canada’s reliance on higher priced crude oil currently beingimported. Likely in-service date for the pipeline is late-2017.Kinder Morgan Trans Mountain crude Line - Kinder Morgan's $5.4 billion expansion of its 1,150 km Trans Mountain crude line fromStrathcona, Alberta, to Burnaby, British Columbia, will boost capacity to 890,000 b/d from 300,000 b/d by 2017 subject to the requiredapprovals from the National Energy Board (NEB).Enbridge Mainline Expansions - Enbridge has planned two major expansions for its Mainline which will allow western Canadian crude toreach existing markets in the Midwest and Ontario and new markets in the U.S. Gulf Coast.Keystone XL projectIn North America, TransCanada's Keystone XL project, aimed at moving Canadian crude oil down through the US to the Gulf Coast, isawaiting the go ahead. The 875-mile, 830,000 b/d line is facing opposition from environmentalists but pipeline supporters claim thatcontinued delays of approving the pipeline are hindering the recovery of the US economy. A decision on the pipeline is expected be late 2013.Figure 15 Keystone Pipeline SystemFigure 16New Pipeline Capacity Needed in 2017 to Meet Oilsands Production Growth(Million bbl/d)7Source : TranscanadaCoastal Gas Link – The proposed pipeline is a 650-kilometre gas pipeline across northern British Columbia to the west coast of B.C.The pipeline will transport natural gas from Dawson Creek area to the proposed LNG Canada facility near Kitimat.Prince Rupert Gas Transmission project - TransCanada has been selected by Progress Energy Canada Ltd. to design, build, own andoperate the proposed Prince Rupert Gas Transmission (PRGT) Project. The approximately 750-kilometre pipeline is expected to delivernatural gas from the District of Hudson's Hope to the proposed Pacific NorthWest LNG facility within the District of Port Edward on Lelu Island.Iraq PipelinesWith Iraq undergoing major reconstruction post the war, the country is expected to become the world’s second largest oil exporter in theworld in a few years. There exists around 9,294 km of pipeline in Iraq including Crude and Product lines, and most of these have toreplaced in the next five years. Iraq currently has two strategic pipelines – one to Syria and the other to Turkey. The Syria line (~1,800 km) isalmost completely destroyed while the Turkey line (~1,600 km) is 60% destroyed. Apart from the large diameter pipes, demand is high forERW pipes to connect to the main pipelines. Over the next five years, demand for lines pipes in Iraq is pegged around 9,000 kms for largediameter pipes and around 8,000 km for ERW pipes.Figure 17Iraq- Strategic PipelinesStrategic Pipeline2, Partial tocompleteReplacement654321Oil SupplyKeystone XLKeystoneOther Existing Capacity02012 2014 2016 2018 2020 2022 2024Strategic Pipeline1, Partial tocompleteReplacement40
European pipelinesIn Europe, with the Nord Stream project complete and bringing Russian natural gas into northern Europe via a subsea link under the BalticSea, attention has now switched to two other Russia-to-Europe links. One is the possible Nord Stream Extension Project (Next) to provideadditional capacity into northern Europe. This is likely to involve two 1,200 km long pipelines running in parallel to the existing NordStream and possibly needing a comparable amount of material – around 2.4 million mt of 1,150mm diameter pipe. An offshore extensionto the UK has also been discussed.The other is South Stream, a planned link to transmit Russian natural gas through to southern Europe via the Black Sea to Bulgaria, andinvolving four parallel pipelines totalling about 2,400 km pipeline, backed by Russia’s Gazprom and partners. From Bulgaria, gas will flowon to several southern European countries – including Hungary, Serbia, Slovenia, northern Italy, and possibly others. Construction willrequire an estimated 4.3 million mt of steel pipe (about 1.5 million mt for overland, and 2.8 million mt for the underwater section).Figure 18Some existing and proposed pipelines to bring natural gas into EuropeRussian gas artery (simplified)Existing gas pipelinesPlanned gas pipelines1 Nabucco2 South Stream3 Trans Adriatic PipelineSource: Platts Report May 2013Shale Gas – Huge Potential in Pipeline DemandShale gas provides a huge potential for increase in pipeline demand for the coming years, especially small diameter pipe and is expectedto play an important role in shaping North American, European, Australian, and Asian natural oil and gas demand. Pipelines from shalegas fields are being connected to the main trunk lines, thus creating demand potential for pipes in a consistent manner.According to data from the US Energy Information Agency (EIA), the amount of technically recoverable shale gas/oil deposits in the US haschanged greatly in recent years. This has been due to both technological advances and a pickup in survey activities, which are makingincreasingly detailed data available. There is considerable potential for further increases in the amount of technically recoverable shalegas/oil deposits with further advances in technology and survey activity. In particular, areas outside North America that have seen littlesurvey activity for unconventional resources are likely to see large increases in the level of technically recoverable deposits leading toincrease in pipe demand.The Replacement Demand – the potential upsideThe approximate life of a pipeline on average is 25-30 years. A high percentage of both hazardous liquid and natural gas transmissionpipelines are way beyond those years, and are expected to be considered for replacement. The need for replacing old and damagedpipelines became clear during a series of accidents across North America in 2010 and 2011 in states like Michigan, California, Illinois,Georgia, Pennsylvania, Alberta – Canada etc. More than 60% of all US natural gas transmission lines were installed before 1970, accordingto the nonprofit Pipeline Safety Trust and 37% are from the 1950s or earlier. Around 4% — nearly 12,000 miles — are pre-1940, and somesegments have been in place for 120 years. These antiquated pipelines pose a serious risk to the environment. Although there have beendiscussions on replacing these pipelines, there has been no concrete action from the governments or the pipeline operators. Thisdemand, if it materialises, would provide significant growth opportunity for pipeline manufacturers around the world, for many years.DOMESTIC PIPE DEMANDIndia currently has around 12,000 km of natural gas pipeline. Most of these gas pipelines are in northern and western regions and muchdevelopment is needed in southern, eastern and central regions. The network density is low when compared with some of the moredeveloped natural gas markets. The pipeline length to country area ratio of 0.003km/square km as compared to 0.06 for USA, 1.17 for UK,1.24 for Germany and 0.02 for Bangladesh. Thus, India offers huge opportunities in the transmission and development of natural gas grid(NGG).With the correct government policies and requisite quality approvals, the Indian pipeline network can grow at a substantial rate over thenext few years. The formation of Petroleum & Natural Gas Regulatory (PNGRB), City Gas distribution network and new gas finds on India'seastern coast are positives for the Indian pipe industry. Gas Authority of India Limited (GAIL) plans to invest more than Rs. 38 billion in thenext few years over new pipelines in India.41
Water Pipeline Demand in IndiaThe water sector provides an additional opportunity for the pipes sector, especially HSAW pipes. The water resource potential in India is186.9 million ha mtrs, mostly from rainfall. Though the annual availability of water is more than utilization, there is a rising demand tofully utilize this potential. Recognizing the criticality, the Centre in its 12th Five Year Plan, has indicated gross budgetary support forthdevelopment of water resources to Rs. 1,096 bn as against Rs. 414 bn allocated in the 11 Plan.Under the Jawaharlal Nehru National Urban Renewal Mission (JNNURM), 65 cities in Indian covered under the Urban Infrastructure andGovernance (UIG) component of the Mission have prepared comprehensive City Development Plans which include investment planswith a focus on providing citywide urban services, such as water supply, sanitation, drainage, urban transport etc. A total of 551 projects,at an approved cost of Rs. 618bn for the 65 mission cities spread over 31 states / UTs have been sanctioned. Of the 551 projects, 313 werewater supply and sanitation projects (including sewerage and solid waste management) and 73 storm-water drainage projects.Figure 19Major JNNURM funded projectsProjectsMumbai - IV Water Supply SchemeMumbai Sewage Disposal ProjectWater Supply Scheme (Ajmer & Pushkar)Sewerage Scheme (Lucknow)Water Supply Scheme (Patna)Source : Projects Today` Billion3024875StateMaharashtraMaharashtraRajasthanUttar PradeshBiharData as of 31 March 2013Among the upcoming projects, Gujarat Water Supply and Sewage Board (GWSSB) irrigation Pipeline costing approximately Rs. 29 billion,is significant.<strong>WELSPUN</strong>’S FY13 HIGHLIGHTSAll Time high Sales , Production volumeThe Company has achieved all time high sales and production volume of over 1 mn ton in FY13. This is despite the fire in the Little Rockfacility in July 12, which disrupted close to 3 months of production. Sales volumes picked up in the second half of the year as the companyexecuted a significant portion of its strong order book. Despite the challenging environment, the company managed to deliverperformance as guided.Strong order book position at Rs. 52,140 million; Outstanding pipe order book over 757 K MT; Over 1 mn tonnes of orders bookedduring the yearThe order book stands at stands at Rs. 52,140 million (US$ 956 million), 757 K MT in pipes as on 30th May 2013. 80% of pipe orders arefrom export markets like North America, Middle East, Europe, North Africa and South East Asia. During the financial year, the companyhas booked new orders over more than 1 mn tonne in Pipes. This demonstrates the Company’s leadership position in challenging marketconditions, thanks to its quality and track record.Completed the New HFIW Mill at Little Rock, Arkansas USA and received the API certificationThe boom in Shale gas in the US has spurred potential demand for small diameter pipes. To address this strong demand growth in theHFIW line pipe segment in North America, the Company has commissioned 175,000 MTPA HFIW mill and Coating Plant in Little Rock, US.The mill, which has already received the API certification, is likely to ramp up to optimal utilization in FY14.Capacity addition in Mandya, to cater the Domestic Water Pipe DemandThe Company has also completed the capacity expansion of 50,000 MTPA in Mandya this year taking the total capacity of the plant to1,50,000 MTPA. The plant is primarily meant to cater to the water pipeline demand in India.Saudi Plant receives approvals from one of its large O&G customersDuring the year the Company has received approval from Saudi Aramco, one of the oil and gas giants in the Middle East and one of the keyclients for the pipe facility in Dammam. This has translated to significant orders from the client resulting in the Saudi facility movingtowards optimal utilization levels.World leader in line pipe capacityThe Company’s total Global pipe capacity has reached 2.425 million MTPA with the commissioning of additional HSAW capacity inMandya and HFIW capacity at Little Rock Arkansas. The LSAW line pipe capacity is at 0.70 million MTPA catering to the growing market ofthe deep offshore projects across the globe. With the Company’s investment in the Kingdom of Saudi Arabia in FY11 and the expansion atMandya, the HSAW line pipe capacity today stands at 1.35 million MTPA. The current global capacity distribution of the Company isshown in Figure 20.42
Figure 20Current Global Capacities in '000 MTPAProducts Anjar, India Dahej, India Mandya, India Dammam, SA Little Rock, US Total CapacityLSAW 350 350 700HSAW 500 50 150 300 350 1,350ERW/HFIW 200 175 375Current Pipe Capacity 1,050 400 150 300 525 2,425Plate & Coil 1,500 1,500Expanded Global ReachThe Company has today its global presence in India, US and Saudi Arabia through its manufacturing facilities and marketing offices inDubai and Houston. This helps the Company to be closer to the customers and provide them end to end pipe solutions. The Companyserves clients in more than 30 countries globally.Figure 21AMERICASEURO PE & CISCanadaCzech Rep.RussiaUSAMexicoBahamasTrinidad & TobagoVenezuelaColombiaPeruSpainAlgeriaTunisiaNigeriaLibyaEgyptSudanIraqQatar IranUAESaudi OmanIndiaDOMESTICChinaBangladeshMyanmarThailandMalaysiaSOUTHEAST ASIAAUSTRALIAIndonesiaBoliviaPlant LocationsAnjar, IndiaDahej, IndiaMandya, IndiaDammam, SaudiLittle Rock, USAMarketing OfficesMumbai, IndiaDelhi , IndiaDammam, Saudi ArabiaDubai, UAEHouston, USAMENAPlantsMktg OfficeCountries servedReorganisation of the pipes business structureFor enhancing marketing capabilities and customer servicing, the management has reorganized the pipes business into a geographicbusiness unit structure. Three business units- the Americas; Middle East, Africa & Europe; and India and APAC, have been formed toensure focussed attention on major markets and clients. Each unit, under an independent Business Unit Head reporting to the MD,would own the marketing as well as production of pipes for their respective geographies. In order to accelerate entry into unexploredmarkets, an exploratory business unit “New markets” has also been formed, aimed at penetrating the untapped potential evident inthese markets. These business units, three geographic and one exploratory, would be supported by global support organizations namely -Supply Chain, Quality, Technical, Human Resource and Finance.Conversion of CCDs’ issued to Granele Ltd in FY 12The Compulsorily Convertibles Debenture (CCD’s) issued to Granele Ltd in FY12 was fully converted to equity share at the pre determinedprice of Rs.225 per share during the year on February 18 2013. This represents 12.22% of the fully diluted equity capital of the Company.The CCD’s carried a coupon of 5% which was paid to Granele Limited on the conversion.Buyback of FCCB’s of USD 68.5 mn out of total of USD 150 mnThe Company has successfully bought back its Foreign Currency Convertible Bonds (FCCB) worth USD 68.5 mn out of USD 150 mn duringthe year in two tranches of USD 44.1 mn in October 2012 and USD24.4 mn in March 2013 at and earned as average discount of 7.4% onthe accreted value of the bonds. This buyback has resulted an average USD yield of ~10%. The FCCB outstanding of USD 81.5 mn, is due inOctober 2014.43
Business Re-organisation – Demerger to create renewed business focus and enhance shareholder value creationThe Board of Directors of Welspun Corp Limited at their meeting held on 30 May 2013 have approved a reorganization of its business intotwo distinct and focused listed companies as under (subject to necessary regulatory approvals):1) Existing Company (“Welspun Corp Ltd” or “WCL”) to focus solely on the Pipes and Plates business in India and globally; and2) Demerged or new Company (“Welspun Enterprises Ltd or “WEPL”) focused on Steel (DRI), Infrastructure, Oil & Gasexploration and Energy businessesKey highlights of the demerger scheme• Creates focused business entities in:- Pipes and plates- Steel, Infrastructure, Oil & Gas and Energy• Vertical demerger creates a mirror shareholding across both entities resulting in no dilution for any of the existingshareholders• Tax complaint demerger and hence tax neutral• Scheme requires approval of only one High Court (Gujarat High Court) which is expected to expedite the processstst• Demerger Appointed date: 1 April 2012 and expected Demerger Effective Date: 31 January 2014Rationale for the demergerUnder the current structure, Welspun Corp is a conglomerate with business interests spread across – Pipes (Pipes & Plates), Steel (DRI)and Infrastructure (Infra, O&G and Energy). Each of these businesses have different financial characteristics, their own sector cycle andstage of development. As a result, each business has a different market perception and return expectations among investors andstakeholders. Historically, stakeholders have expressed concern regarding the complexity of the WCL corporate structure and thechallenges of co-mingling what are relatively new long gestation businesses with a well-established, dynamic and diverse pipes business.Historic data shows that specialized companies with balance sheets tailored to respective business cycles have easier access to capitalmarkets, are better understood by a wider investor and creditor base and have produced higher shareholder returns over the longer run.Benefits of the demergerThe Board believes the demerger will maximise long term shareholder value by:• Enhancing management focus on the two companies independently and providing each company with greater flexibility topursue strategic objectives;• Allowing both companies to adopt independent capital structures and financial policies appropriate for their operationalrequirements and strategic objectives;• Providing greater investment choice for shareholders, with direct participation in the future performance of the relativelynascent infrastructure, energy and steel businesses; and• Allowing closer alignment between business performance and management incentive plans for each business – drivingaccountability and management engagement.The demerger will provide the various businesses under WEPL the flexibility to pursue their independent plans:• Infrastructure: The consolidation of the EPC business under Leighton Welspun is expected to yield synergistic cost savings,open up new markets and improve operating performance. The BOT business is fully operational with positive cash flowsafter servicing debt obligations. The infrastructure business is self-sufficient to meet its commitments and liabilities.• Steel (DRI): Maxsteel has no cash interest and debt repayment obligations until September 2014. The recent developmentsin the gas scenario in the country indicate an improvement in the availability of cost-effective gas in the medium term.Maxsteel is already exploring proven alternate technologies to generate and/or procure alternate sources of gas atcompetitive prices without significant capex.• Energy: Welspun Energy is one of the largest renewable energy players in India and has the largest operational solar energycapacity in the country. Current operational capacity of 130 MW is expected to rise to ~400 MW by 2014. The business is wellfundedfor its existing growth plans.• Oil and gas: Exploration in the existing blocks is continuing. There are no plans for new acreages.44
<strong>WELSPUN</strong> - A SWOT AnalysisSTRENGTHS- Well established brand in global large diameter pipemarket with excellent track record- Strategically located enabling proximity to its topcustomers with local presence in US and MiddleEast.- International accreditations from key clients forexecuting high-end offshore projects.- State of the art technological capabilities forservicing high end markets- Highly skilled resources to execute the moststringent projectsWEAKNESS- Inability to capitalize on the forward and backwardintegrations- Plate business suffering from underutilisation- Tough domestic market leading to overdepence onexportsOPPORTUNITIES- High growth markets in Canada and Iraq- Persistent efforts to establish a presence inrelatively new markets like North Africa, SouthAmerica and South East Asia- Replacement market potential in USA- Growing HFIW demand in the US due to thediscovery of abundant shale gas reservesTHREATS- Challenging macro environment- Challenging world O&G market scenario- Raw Material volatility- High competition resulting in erosion of margins- Volatile foreign exchange rates<strong>WELSPUN</strong>'S WAY FORWARDCapitalise on quality track record and scaleOver the years, the Company has made its mark as one of the best manufacturers of high end quality products in the international pipemarket. The Company is focused on increasing its product efficiency and strengthening customer relationships. The Company has beenreceiving repeat orders from its loyal customer base on account of its quality and delivery track record. WCL is confident of continuing thistrend of delighting the customer. The Company has built scale across geographies which will help it cater to demand from across theglobe.Leverage accreditations with international O&G majorsThe Company has been pre-approved with international Oil &Gas majors and is further leveraging the relationship by partnering themand do research and development on high grade critical applications for newer projects. Simultaneously, the Company is growing itsdelivery capabilities with its state of the art technologies and processes.Local player in key HSAW marketsThe Company's HSAW plants comprise of total capacity of 1.35 million MTPA, and are located near major markets of North America, LatinAmerica, Middle East, and Africa. With pipe mills in Saudi Arabia, the US and India, the Company has been able to position itself as a localplayer in the key markets.Exploring and entering new markets with better marketing focusWhile continuing to strengthen its position in the key existing markets like North America, Middle East, and India, WCL will target toincrease its market share in relatively new geographies like Latin America, South East Asia and North Africa.New organizational structure for pipes to spur growthThe new organizational structure based on geographic business units, will help the Company to book more orders and45
service customers better. It will build accountability and ensure execution through role clarity, performance management system andperformance alignment. It will also help build the leadership pipeline through competency based capability development.VISION FOR THE COMPANYWelspun Corp Ltd has laid the foundations for becoming the most respected line pipe company in the world. In the next five years, apartfrom strong profitable growth, the company is also aiming to:• Be seen as a preferred business partner to its customers and suppliers• Be seen as the organization with highest quality standards in its segment of manufacturing• Become an employer of choice• Strengthen global presence• Be admired as a socially responsible corporate and a sustained value creator for all its stakeholdersRISKS AND CONCERNSThe key risks for the company are:• Challenging economic environment: The macroeconomic outlook continues to be challenging in India as well as in the otherkey markets where the Company operates.• Volatile crude oil and gas prices: Volatility in the price of crude oil/gas creates uncertainty for oil & gas producers regardingthe viability of new exploration. This in turn could create uncertain future demand for line pipes in the oil & gas segment.• High level of competition: While the potential demand for new oil and gas pipelines remains high in most of the Company'smarkets, there has been considerable delays in decisions in many projects on account of factors such as policy uncertainty,environmental concerns etc. This has led to fewer than expected projects coming to the market, resulting in high level ofcompetition. The Company has a strong order book and hence the Company's focus will be on profitability rather thanwinning orders at any cost.• Volatile exchange rates: The rupee exchange rate against the major currencies such as the US dollar has been very volatile.ThoughtheCompanyhasimplementedawell-definedhedgingpolicy,foreignexchangefluctuationscouldaffectreportedresults.HUMAN RESOURCES POLICYIn past one year, the HR team at Welspun has re-organized itself as a combination of centralized and decentralized structure. The majorfocus was to bring synergy within the HR team and focus on bringing uniformity in process / policies across the Group.Based on the feedback received from the GPTW (Great Place to Work Survey) 2011 and to serve the need for synergy and uniformity,organizational re-structuring of the existing HR team was done and specific action areas were identified. Accordingly, based on theimportance of the Program Management Activities, six focus areas were identified globally which would help in developing theCompany's most important and invaluable asset “ Human Resources”.• HR Operations• Performance Management System, Industrial Relations and Corporate Social Responsibilities• Talent Management• Employee Development• Talent Acquisition• Employee EngagementKEY HIGHLIGHTSThe key initiatives taken in HR are as listed below:HR Policies and Practices: To bring uniformity in the HR processes, Group HR Manual comprising of standardized group level policies andprocedures with a flavor of location level policies was introduced. A process of introduction of “Group Induction Manual” and “EmployeeHandbook” to facilitate employee's awareness regarding the policies and procedures governing them has also been set up.Talent Management: To bring objectivity in the process of identification of HiPo(High Potential)employees across the Group, PersonalityAssessment tests were conducted and Individual development plan was drawn and implemented.Performance Management System: Goal Setting exercise for entire Group & performance review were the key activities. Sessions onPMS process were organized at all locations to make employees understand the nitty-gritties of the PMS process & also align theindividual goals with the Business objectives.Talent Acquisition: Internal Job Portal was launched to provide platform for all the employees to internally channelize their careeraspirations and facilitate the hiring activities. Other sources like head hunting and employee referrals were mostly used which resulted inbringing down the recruitment cost by 94%.46
Employee Engagement: Launch of Tablet – an employee engagement committee was the major initiative. Few sub-committees wereformed under Tablet like Fun Tab, Whiztab, Sport Tab and E – Tab. Monthly fun events, practice sessions for Sports Tournament,nominations in Mumbai Marathon and monthly newsletters were the key activities of Tablet.Employee Communication: Individual & Group communication forums were launched. At the individual level, process of stay interviewswas started to conduct 'health check' of the Organization. At the Group level, communication forums like Monthly Departmental Meeting(MDM) and Town hall were started to share business updates with employees and to address their concerns. Launch of E- Blog, aninternal blogging site was another major highlight. Welspun Intranet Portal – “One Welspun” and Welspun Global Helpdesk – HR & AdminHelpdesk were also launched.INTERNAL CONTROL AND ADEQUACYManagement of the Company maintains adequate internal control system which is designed to provide reasonable assurance that assetsare safeguarded and transactions are rightly executed and recorded in accordance with management authorization and accountingpolicies.All the records are adequately maintained for preparation of financial statements and other financial information. Apart from internalcontrols, the Company also audits the efficiency and security of its operations, its information technologies and data, in accordance withthe global standards. The Audit Committee of the Company met fourteen times in FY13 to review internal audit reports as well as theinternal control systems and financial disclosures.47
2. BREAKUP OF VARIOUS COST ITEMS AS A %AGE OF SALES (CONSOLIDATED)(Rs. Million)Particulars FY 2012-13 FY 2011-12Amount(%) Amount (%)Revenue from operations 108,701 100% 89,766 100%Cost of goods sold 71,746 66.0%58,911 65.6%Employee Benefit Expenses 6,075 5.6%4,876 5.4%Manufacturing & Other ExpensesStore & spares consumed 2,523 2.3%2,376 2.6%Coating & other Job charges 4,314 4.0%1,440 1.6%Power, fuel & water charges 2,382 2.2%1,924 2.1%Freight Material handling charges 5,615 5.2%3,505 3.9%Construction Cost 2,212 2.0%2,207 2.5%Product Compensation & Claims 3 –649 0.7%Exchange Difference (Net) 1,273 1.2%1,248 1.4%Other expenses 5,379 4.9%4,059 4.5%Total Manufacturing & Other Expenses 23,701 21.8%17,408 19.4%Total Expenses 101,522 93.4%81,195 90.5%Other Income 3,110 2.9%2,676 3.0%Reported EBITDA 10,289 9.5%11,247 12.5%Finance Costs 4,931 4.5%3,999 4.5%Depreciation / Amortization 4,761 4.4%3,515 3.9%PBT (Profit before Tax) and Exceptional items 597 0.5%3,732 4.2%Provision for Tax 390 0.4%1,503 1.7%Exceptional Items (1,091)(1.0)%PAT before Minority Interest and Share of (Loss)/Profitfrom Associate Companies(884) (0.8)%2,229 2.5%Share of (Loss)/Profit from Associate Companies (38) 14Minority Interest 219 0.2%142 0.2%Profit/(Loss) After Tax (704) (0.6)%2,386 2.7%EPS (Basic) - Rs. per share (3.03) 10.89EPS (Diluted) - Rs. per share (3.03) 9.7149
a. Cost of goods soldCost of goods sold increased by 22% to Rs. 71,746 million in FY13 from Rs. 58,911 million in FY12 mainly due to the increasedpipe sales volumes. Cost of goods sold as a percentage to net sales has been stable at approximately 66%.b. Manufacturing and other expensesManufacturing, transportation and other expenses are Rs. 23,701 million in FY13 from Rs. 17,408 million in FY12.The increase is mainly due to an increase in coating and other job charges as well freight and material handling charges, againon account of the higher sales volumes, especially exports .• Stores and spares consumption increased by 6% to Rs. 2,523 million in FY13 from Rs. 2,376 million in FY 12.• Coating and other job charges increased by 199% to Rs. 4,314 million in FY13 from Rs. 1,440 million in FY12.• Power, fuel and water costs were higher by 24% at Rs. 2,382 million in FY13 as against Rs. 1,924 million in FY12.• Freight, material handling and transportation cost increased by 60% to Rs. 5,615 million from Rs. 3,505 million due toproduction and shipment from India towards the export orders executed from the Indian Operations during the year.• The construction cost has remained at similar levels at Rs. 2,212 million in FY13.• Foreign exchange charges showed an increase of 2% over FY12 at Rs. 1,273 million mainly due to the depreciation ofRupee from $1=Rs. 50.875 to $1=Rs. 54.285 (7%).c. Employee Benefit Expenses increased by 25% to Rs. 6,075 million in FY13 from Rs. 4,876 million in FY12 primarily on accountof increase in headcount at various locations including Anjar LSAW, Mandya HSAW, US HFIW and Infra Business.d. Finance Costs increased by 23% to Rs. 4,931 million in FY13 from Rs. 3,999 million in FY12 mainly on account of new debtraised and charging of interest on foreign currency convertible bonds which were capitalized earlier as per AccountingStandard 16 on borrowing cost.e. Depreciation/Amortization charges increased 35% to Rs. 4,761 million in FY13 from Rs. 3,515 million in FY12 mainly due totranslation impact of overseas assets due to weakening of INR, and retrospective change in accounting policy made inrespect of cash subsidy received for BOT projects.3. MARGINSa. EBITDA MarginsReported EBITDA for FY13 is Rs. 10,289 million, as compared to that of Rs. 11,247 million for FY12. EBITDA margin was loweras high competition resulted in lower margins per tonne in the pipe business. Margins were also negatively impacted byweak business environment in plates and infra businesses as well as inadequate gas availability in the DRI (Steel) business.Adjusting for the non-operational income and the forex provisions, normalized EBITDA for FY13 stood at Rs. 8,452 million,compared to Rs. 10,901million for FY12.b. PAT MarginProfit/(Loss) after tax in FY13 was at Rs. (704) million as compared to Rs. 2,385 million in FY12. This was on account of:• Lower pipe margins• Plate business being affected by low demand• Infra business being weak• Cost of gas being very high in DRI (Steel) business resulting in lower volumes and margins• Exceptional items of Rs. 1,091 million, mainly on account of Rs. 542 million write off on abortive exploration activities in2 exploration blocks; and Rs. 494 million being project related expenses in one of subsidiary charged off in theP&L account.50
Table: Balance Sheet (Consolidated)ParticularsI. EQUITIES AND LIABILTIESShareholder's fundsAs at31st March 2013As at31st March 2012ChangeShare capital 1,315 1,139 176Reserve and surplus 55,263 39,794 15,469Compulsory Convertible Debentures (Unsecured)-7,884 (7,884)NETWORTH 56,578 48,816 7,761Minority Interest 3,546 3,433 113Non-current liabilitiesLong-term borrowings 49,531 39,714 9,817Deferred tax liabilities (Net) 5,600 5,036 564Other Long term liabilities 2,271 3,405 (1,134)Long-term provisions 251244 7Current liabilitiesShort-term borrowings 2,043 7,773 (5,730)Trade payables 30,380 32,923 (2,543)Other current liabilities 17,371 14,885 2,485Short-term provisions 1,344 1,812 (468)ASSETSNon-current assetsFixed assetsTotal 168,914158,043 10,871Tangible assets 64,197 52,581 11,616Intangible assets 233281 (48)Capital work-in-progress 5,276 6,191 (915)Intangible assets under development 18980 108Build,Operate & Transfer (BOT) 5,127 4,491 636Goodwill On Consolidation 10,656 9,888 768TOTAL FIXED ASSETS 85,678 73,513 12,165Non-current investments 1,178355 823Deferred tax assets (net) 88 66 22Long-term loans and advances 4,452 5,132 (680)Other non-current assets 328 357 (29)Current assets(Rs. Million)Current investments 17,494 19,431 (1,937)Inventories 25,669 25,632 36Trade receivables 17,614 15,260 2,354Cash and Bank balancesShort-term loans and advancesOther current assets7,0445,5003,86910,2555,8092,232(3,212)(309)1,637Total 168,914 158,043 10,87151
4. Surplus FundsTemporary surplus funds are invested in short term securities such as mutual funds and government securities. Nevertheless, inorder to achieve higher growth and value creation for the stakeholders, the Company aims to retire high cost debt to improveoverall profitability and make the balance sheet healthy.5. Capital DeploymentDuring FY13, capital deployment increased from Rs. 158,043 million to Rs. 168,914 million mainly due to capitalization ofHFIW plant at Little Rock, LSAW plant at Anjar, HSAW expansion at Mandya and revaluation of fixed assets of DRI (Steel)business. The capital expenditure was mostly funded by new debt which has resulted in an increase in gross and net debt.6. NetworthNet worth at the end of FY13 increased by Rs. 7,761 million to Rs. 56,578 million. The Share Capital has gone up by 35.16 mnshares at a face value of Rs. 5 per share leading to an increase of Rs. 176 million in FY13. This was mainly on account ofconversion of CCDs issued to Granele Limited In 2011. The CCDs carried a coupon of 5% and were mandatorily converted intoequity shares at Rs. 225 per share, which represents 12.22% of the fully diluted equity capital of the Company. The Reserves andSurplus of the Company has increased by Rs. 15,469 million in FY13 at Rs. 55,263 million.The details equity raised as part of Net worth are as under:a. Share CapitalDuring the year, issued and paid up equity share capital (no. of shares) increased from 227,781,035 equity shares to262,948,299 (of face value of Rs. 5 each) as at 31st March 2013 due to new issuance of 35,038,889 Equity Shares through CCDconversion, issued to Granele Limited in February 2013 and 128,375 shares to ESOP holders.b. Reserves and Surplussti) Capital Reserve: The balance as of 31 March, 2013 amounted to Rs. 1,057 million which is the same as in the previousfinancial year.stii) Capital Reserve on Consolidation: The balance as of 31 March, 2013 amounted to Rs. 153 million which is sameas in the previous financial year.iii) Securities Premium account stands at Rs. 25,265 million by way of net addition of Rs. 7,709 million during the year onconversion of CCDs issued to Granele Ltd in FY 13. The discount of on issuance of shares under ESOPs was Rs. 3 million andpremium of redemption of FCCB of Rs. 12 million.iv) Debenture Redemption Reserve: Debenture Redemption Reserve has decreased by Rs. 322 million due to reversal onredemption of secured non convertible debentures and now stands at Rs. 1,142 million at end of FY13.v) Cash subsidy at Rs. 1,265 million is considered in FY13 due to the change in accounting treatment of subsidies receivedfrom the state government for BOT assets.vi) Revaluation reserve stands at Rs. 6,564 million (as against nil in FY12) on account of revaluation of fixed assets related toDRI (Steel) business.vii)General Reserve has increased by Rs. 53 million and stands at Rs. 1,749 million at the end of FY13.stviii) Profit and Loss account: The balance retained in the Profit and Loss Account as on 31 March 2013 has decreased byRs. 385 million to Rs. 17,705 million after providing an equity dividend of 10%.7. Loan fundsGross debt at the end of FY13 stands at Rs. 55,772 million up by Rs. 2,365 million over the previous year. The componentsincluded in gross debt are long term borrowings of Rs. 49,531 million, current portion of long term borrowings of Rs. 4,198million, and short term borrowings of Rs. 2,043 million at the end of FY 13.Major movements during the year are:i. The overall long term borrowings and current portion of long term debt has gone up by Rs. 8,095 million.Long term borrowings for FY13 were Rs. 49,531 million compared to Rs. 39,714 million for FY12, an increase of Rs. 9,817million. The increase in long term borrowings from FY12 to FY13 can attributed as below:- Increaseinredeemablenon-convertibledebenturesofRs.3,428millionfromRs.10,000milliontoRs.13,428million.- Increase in External commercial Borrowings of Rs. 2,013 million from Rs. 5,174 million to Rs. 7,188 million.- The new foreign currency loan taken is Rs. 1,615 million in FY13.- Increase in term loans from banks of Rs. 6,672 million from Rs. 13,074 million to Rs. 19,746 million.- Increase in inter-corporate deposit of Rs. 419 million from Rs. 2,691 million to Rs. 3110 million.- Increase in deferred sales tax loan of Rs. 27 million from Rs. 583 million to Rs. 610 million.- The Foreign Currency Convertible Bonds (FCCBs) of value Rs. 3,485 million were brought back during the year. Thestoutstanding FCCB as on 31 March 2013 is Rs. 4,424 million.CurrentportionoflongtermborrowingsdecreasedbyRs.1,722milliontoRs.4,198millioninFY13fromRs.5,920millioninFY12.52
ii. Short term borrowings have gone down by Rs. 5,730 million mainly due to repayment of working capital/other shortterm loans of Rs. 1,549 million in WCL – India, Rs. 553 million in Oil and Gas business, and Rs. 1,119 million in Saudi.Cash and liquid investments for FY13 have decreased by Rs. 5,149 million to Rs. 24,537 million from Rs. 29,686 million in FY12.Net debt stands at Rs. 31,235 million as of 31st March 2013 after accounting for cash and liquid investmentsNet Debt to Networth ratio is at 0.55 times indicating a strong Balance Sheet.8. Fixed AssetsNet block of fixed assets (including CWIP) increased by Rs. 12,165 million to Rs. 85,678 million in FY13, mainly due tocapitalization of HFIW plant at Little Rock, HSAW expansion at Mandya and revaluation of fixed assets of DRI (Steel) business ofRs. 6,564 million. Below is the breakdown of the increase in the overall fixed assets.- Increase of Rs. 11,616 million in tangible assets from Rs. 52,581 million in FY12 to Rs. 64,197 million in FY13; Aboveincludes revaluation effect of Rs. 8,454 million in respect of DRI (Steel) business.Other fixed assets increased by Rs. 549 million from FY12 to FY13 mainly on account of increase in Goodwill on consolidation ofRs. 768 million , BOT of Rs. 636 million and decease in CWIP of Rs. 915 million at the end year.9. InventoryThe overall inventory increased marginally by Rs. 36 million to Rs. 25,669 million mostly due to increase in raw materials ofRs. 495 million, decrease in finished goods of Rs. 2,187 million, increase in WIP stock of Rs. 1,661 million and stores and spares ofRs. 68 million.The inventory turnover days have decreased from 105 days of Net Sales in FY12 to 86 days of Net Sales in FY13.10. Trade ReceivablesTrade Receivables increased from Rs. 15,260 million in FY12 to Rs. 17,614 million in FY13. Sundry Debtors are at 59 days (62 daysin FY12) of net sales during the year.11. Cash, Bank Balances and Current InvestmentsCash, Bank Balances and Current Investments at the end of FY13 stand at Rs. 24,537 million as compared to Rs. 29,686 million atthe end of FY12. Current investments decreased from Rs. 19,431 million to Rs. 17,494 million during the year on account of cashwithdrawn for operational requirements.12. Long Term Loans and AdvancesLong term loans and advances decreased by Rs. 680 million to Rs. 4,452 million in FY13. Below is the breakup of the change inlong term loans and advances from FY12 to FY13.- Decrease in capital advances by Rs. 262 million to Rs. 1,712 million.- Decrease in loans and advances to related parties (incl. share application money) by Rs. 871 million to Rs. 54 million(on conversion in to non current investments).- Increase in other loans and advances recoverable in cash and kind, balances with government authorities (advance taxes) byRs. 585 million to Rs. 2,106 million.13. Other Current AssetsOther current assets increased by Rs. 1,637 million to Rs. 3,869 million mainly due to the following changes from FY12 to FY13.- Increase in unbilled work in progress by Rs. 1,015 million with respect to infrastructure.- Increase in receivables toward claims by Rs. 324 million.- Decrease in interest accrued on current investments, fixed deposits and others by Rs. 392 million- Increase of export benefit receivables of Rs. 642 million from FY12 to FY13.14. Short Term Loans and AdvancesShort term loans and advances decreased by Rs. 309 million to Rs. 5,500 million from FY12 to FY13 mainly due to the following:- Decrease in advances recoverable in cash or kind by Rs. 439 million.- Increase in balances with government authorities on account of direct and Indirect taxes by Rs. 116 million.- Increase in pre paid expenses and employee advances by Rs. 99 million.15. Trade PayablesTrade payables have gone down by Rs. 2,543 million to Rs. 30,380 million in FY13 from Rs. 32,923 million in FY12, primarily on53
account of decrease in acceptances of Rs. 2,593 million and increase in other creditors by Rs. 49 million in FY13.Trade payables are at 102 days (134 days in FY12) of Net Sales.16. Cash Conversion CycleCash conversion cycle for FY13 is 27 days compared to 22 days for FY12.17. LiquidityWe broadly define liquidity as our ability to generate sufficient funds from both internal and external sources to meet ourobligations and commitments. Our primary liquidity requirements have been to finance our working capital requirements forour operations and for capital expenditures and investments. We have financed our capital requirements primarily throughfunds generated from our operations, equity/equity related issuance and borrowings.18. Cash FlowsThe table below summarizes our cash flow for the periods indicated: (Rs. in millions)March 31,2013 March 31,2012Net cash generated from operating activities 1,080 14,286Net cash generated used in investing activities (1,672) (22,054)Net cash generated (used)/from financing activities (2,648) 9,634Net cash increase/(decrease) at the end of the period (3,239) 1,867a) Operating ActivitiesNet cash generated from operating activities in FY13 was Rs. 1,080 million. Net cash generated from operating activitiesconsisting of operating profit before working capital changes and tax is Rs. 4,322 million.Working capital changes include change in trade and other receivables of Rs. (3,896) million, inventories of Rs. (36) million andtrade and other payables of Rs. 863 million.b) Investing ActivitiesNet cash used in investing activities was in FY13 was Rs. 1,672 million.Rs. 301 million from the sale of fixed assets, Rs. 2,309 million for interest received, and Rs. 277 million from dividend incomecontributed toward investing cash inflows for investing activities during FY13.Cash outflows for investing activities during FY13 primarily include Rs. 6,878 million for the purchase of fixed assets (includingCWIP), Rs. 36 million for investment in joint venture and associates, Rs. 22 million for increase in share application money givenand Rs. 2,305 million from the sale of current investments.c) Financing ActivitiesNet cash generated used financing activities in FY13 is Rs. 2,648 million.Cash inflows from financing activities for FY13 primarily include Rs. 10 million proceeds from issuance of equity shares,Rs. 3,372 million proceeds from Non-Convertible Debentures, Rs. 1,700 million was towards the redemption of debentures,Rs. 3,485 million on prepayment or buyback of FCCBs, Rs. 6,878 million on accounts of net proceeds from long term borrowingsand Rs. 3,745 million as net decrease in other short term borrowings.Rs. 132 million for dividends paid including corporate dividend tax, and Rs. 3,846 million towards interest paid contributetoward financing cash outflows during FY13.Note on Foreign Currency Hedging Policy:The Company has major part of its revenues and expenses in foreign currency, which provides natural hedge. The value additionis hedged through forward sale of dollars with vanilla products. The long term liabilities in foreign currency are kept unhedged asthe Company is net foreign exchange earner. At any point of time the Company manages the net forex position to an optimumlevel considering potential forecasted trade exposures.For the standalone results, the Note No. 32 in this annual report on page No. 90 deals with "Disclosure of Derivative Instrumentsand Unhedged Foreign Currency Exposure" and the table for the current year is reproduced and explained below with the helpof superscripts for each numerical item.(Rs. Million)ParticularsAmount HedgedMarch 31st 2013Amount Unhedged*A) In respect of Short term receivables and payablesi) In respect of Debtorsa) Existing as on the Balance sheet dateb) In respect of future forecasted transactions631 (2)721 (1)54
ii) In respect of Creditorsa) Existing as on the Balance sheet dateb) In respect of future forecasted transactionsB) In respect of Short term receivables and payables existing as onthe Balance Sheet datei) Borrowingsii) Other liabilities or payablesiii) Other assets or receivablesC) In respect of Long term receivables and payables existing as onthe Balance Sheet datei) Borrowingsii) Other liabilities or payablesiii) Other assets or receivables4,438 (4)13,689 (3)1,814 (6) 908 (6)- 1,606 (7)-886 (8)- 12,581 (9)- 1,764 (10)- -D) Other derivative Hedge instruments13,873 (12)Note : The Net un hedged short term payables/borrowings as on 31st March 2013 is Rs.14,596 million (as on 31st March 2012 Net un hedged short termpayables/borrowings was Rs.9,616 million.)The above table is reproduced in the form of overall receivables and payables position and provides the net position as on 31stMarch,2013, with regard to foreign currency exposure and the net unhedged position.Explanations for A) in respect of short term receivables and payables (1 to 5)(Rs. Million)ParticularsMarch 31, 2013Receivables Payables Differencei) In respect of Trade receivables and payablesExisting as on the Balance sheet date721 (1) 18,126 (3+4)In respect of future forecasted transactions based onorders in hand24,615 11,307Total Trade 25,336 29,433 (4,097)ii)HedgesExisting as on the Balance sheet date-(4)4,438In respect of future forecasted transactions(2)631-Total Hedge 631 4,438 (3,806)Net Unhedged Trade 24,705 24,996 (291)Conclusion: The difference between receivables and payables is after including orders in hand and hedges in place. The net unhedgedposition is at optimum level, as the Company enjoys the natural hedge.Explanation for B) in respect of Short term receivables and payables existing as on balance sheet date (6 to 8)6. Out of Total short term borrowings (ECB) Rs. 2,722 million, Rs. 1,814 million is hedged and balance Rs. 908 is unhedged.7. Includes Rs. 791 million for Advance received from customers for future shipments and Rs. 815 million for claims payable.8. Includes Rs. 65 million Short term fixed deposits and balance in foreign currency account and Rs. 271million advance paymentto Subsidiary and Rs. 220 million receivable against dividend and Rs. 85 million advance payment to vendors and Rs. 244 millionreceivable against claims.Explanation for C) in respect of Long term receivables and payables existing as on balance sheet date (9 to 10)9. Rs. 4,424 million represents foreign currency convertible bondsandRs.6,542millionrepresentsforeigncurrencyECBloanandRs.1,615 million represents foreign currency loan.10. Rs. 1,764 million represents claims payableExplanation for D) in respect of other derivative hedge instruments (12)12. i) Interest Rate Swap: Rs. 8,873 million (equivalent to US $ 163 million) floating to fixed for ECB loan for partially mitigatinginterest rate volatility.ii) Coupon Only Swap: Rs. 5,000 million ( equivalent to US $ 107 million) conversion of long term rupee loan into foreigncurrency loan on notional principal basis. This results into conversion of high cost rupee loan into cost effective LIBOR basedforeign currency loan.Cautionary StatementSome of the statements in this Management Discussions and Analysis, describing the projections, estimates and expectations may be forwardlooking statements within the meaning of the applicable laws and regulations. Actual results may differ substantially from those expressed orimplied. Important developments that could affect Welspun's operations include a shift in the industry structure, significant changes in politicaland economic environment in India and globally, tax laws, import duties, litigations and labour relations.55
Corporate Social Responsibility- A Welspun CommitmentIn the past 26 years, Welspun has established itself as one of the fastest growing Indian conglomerates with presenceacross five business verticals. Wherever we start our facilities, our commitment is to reach out to the nearbycommunities.We at Welspun find ourselves proficient to address the various needs of the communities, under three distinctdomains that have become the guiding principles of our CSR initiatives. Hence the Group’s social vision has beenenshrined in the 3E’s.• Education• Empowerment• Environment and HealthA brief overview of the activities that we undertake as part of our CSR initiatives is best presented under each of the 3guiding principles.EDUCATIONThe future of our country is in our young population. Welspun promotes and supports the Right to Educationand is dedicated to improving and enhancing the quality of education.Quality Education Program• In 2012-2013 At Anjar, Welspun initiated a Quality Education Project with the Government ofGujarat in association with Light of Life Trust (NGO). The Welspun Quality Education project aimsto reach out to all the 123 government schools in Kutch in the next 5 years.• Currently as a pilot project, we are reaching out to three government schools viz, Varsamedi, NewDudhai and Bhadreshwar to make a subtle difference to 28 teachers and 584 students from Std V –VIII.• At Salav, Maharashtra, to improve the access to education for the Katakari tribals (locals of Salav),we have tied up with the Light of Life trust to impart quality education at the secondary schoollevel. This project now reaches out to 100 tribal children and aims at arming these children withsuperior social and vocational skills.• With the objective of helping teachers to stay at par with the various developments in theeducation field & upgrading their teaching skills, Teacher training programs have been conductedin Kotma (Anuppur, MP), Vijayaraghavgarh (Katni MP) & in Neemuch (MP). A total of 93 teachershave attended these training programs.58
Balwadis (Pre-primary Education Centers) and Adult Literacy• Welspun runs 3 Balwadis in the workers colonies in Anjar and Vapi, Gujarat. A total of 158 childrenare benefitting from the basic education imparted at these Balwadis.Computer Training• We initiated Jeevan Asha Computer Training Centre at Salav where children are being providedcomputer and soft skills training. Jeevan Asha Training Centre has covered 60 students with basiccomputer training. We aim to cover over 200 students under the Jeevan Asha computer project inSalav by June 2013.Career Counseling• This initiative is carried out for children belonging to Welspunites at the Head office (Mumbai) andfor students of Std X to XII at Welspun Vidya Mandir (CBSE Board School) at Anjar and Salav.Psychometric tests are administered and one on one counseling is conducted based on the testresults.Educational, Recreational and Motivational Sessions for Cancer Patients and their Families• As a part of our Employee Volunteering Initiative, 17 Welspunites spend quality time (on workingSaturdays) at St. Jude’s childcare center, Mumbai in quest of making a qualitative difference to thelives of 38 underprivileged children suffering from cancer and their parents. The group teachesskills like Spoken English, Computer literacy, Dance, Art and Craft.EMPOWERMENTAs we secure our future generations in terms of education, we also see the need to empower families so thatthey can sustain themselves in the near term and move towards growth and prosperity. And what is betterthan to focus on empowering women!Women Empowerment• We run five vocational centers for women in (names of the places) that provide guidance andtraining for cut and sew operations. Till now 264 women have benefitted from these centers and184 have been absorbed in Welspun India Ltd.• Inspired by the success of this endeavor, we have also replicated this initiative at Welspun Gram,Vapi. We aspire to start a women empowerment initiative at Palghar and Rakholi based on thelocal area needs and skill set.• Similarly, 4 tailoring & stitching centers have been started and are operating in the villages ofUmarda & Chhatai in Anuppur district and Dokariya and Bhujbhuja in Katni districts (of MP). Thewomen undergo training and on successful completion, Usha International awards them acertificate. A total of 232 women have successfully completed the course.59
Youth Empowerment• To provide employment opportunities to the village youth, a number of job fairs have beenorganized at various locations in Madhya Pradesh & Rajasthan. Around 415 youth received offerletters with the job fairs organized till date.• To empower our youth and encourage them to take on vocational skill courses, we have adoptedthe Industrial Training Institute (ITI) at Vansda, Navsari District under the Central GovernmentScheme of ITI up gradation through the Public-Private partnership route. Simultaneously, we havealso tied up with MPSTME College, Sirpur and Vapi where we provide a six-month practical trainingto students.ENVIRONMENT & HEALTHWe realize the importance of conservation of natural resources and nature for sustainablefuture growth. Health is wealth! With this adage in mind, we follow a unique system ofproviding health and empowerment together.Primary Health Care ServicesMobile Health Vans Mumbai• In Mumbai, for the underprivileged section of the society Welspun aims to provide freeaccess to Primary Health Care Services hence, we have launched our Mobile Health Vanin Association with Wockhardt Foundation. This initiative has covered 15532 people inthe year 2011-12 from six communities. The mobile van is equipped with medicines, adoctor and a paramedic.Regular & Special Medical Camps• We have organized 124 medical camps at our various locations in Katni, Anuppur &Nimach (MP) & Jodhpur (Rajasthan).• Through our various Medical & Health intervention programs at Katni, Neemuch,Anuppur (Madhya Pradesh) & Jodhpur (Rajasthan), we have been able to reach out to47,412 villagers.Anti- Tobacco Program• Welspun initiated Anti tobacco Life Skill Project with 33 secondary schools from Alibaug partneringwith Salaam Bombay Foundation (NGO). This project covered approximately 10000 students, 100teachers and 50 Anganwadi Workers.Waste Water Recovery Plant• As an example of our effort to grow through a sustainability focus, we have set up a state-of-artWaste Water Recovery Plant having capacity of 10MLD (million Liters Daily) at Anjar Campus,60
which takes care of both Textile as well as Pipe plant effluent.• It is one of the largest Waste Water Recovery plant in textile industry at a single location havingseries of treatment stages leading to its designed capacity of 90% recovery.• This set-up recycles 100% of our water and we re-use 85% of water during our processing therebyconserving water in our already water-starved location of AnjarNisargruna Biogas Plant• Our focus on renewable energy both for business and environment has been instrumental in ourinstalling a centralized ‘ Nisargruna Biogas plant’ at WIL, Anjar to handle and process thebiodegradable waste materials generated from kitchen, canteen, garden and other biologicalsludge of Welspun City and Gram, Anjar.• Presently 2-2.5 MT of biodegradable waste is feed into the Nisargruna Plant, which generates fuelgas equivalent to 40kg of LPG, which in turn is used for cooking in plant canteen.Tree Plantation• We have planted a total of 6,32,000 trees, shrubs and hedge in Anjar and plan to plant additional50,000 trees in 2013• More than 3335 plants have been planted during the various drives at various locations in Katni,Anuppur & Nimach in Madhya Pradesh & in Jodhpur in Rajasthan. Saplings have also beendistributed to the villagers to be grown in their own surroundings.These little steps in our journey towards sustainable growth are aimed at providing a socio-economic growth to thesociety that has given us so much in terms of business.61
Standalone Accounts1 Independent Auditor's Report on Standalone Accounts 632 Standalone Balance Sheet 683 Standalone Statement of Profit & Loss 694 Standalone Notes to Accounts 705 Standalone Cashflow Statement 1026 Section 212 disclosure 103Consolidated Accounts1 Independent Auditor's Report on Consolidated Accounts 1042 Consolidated Balance Sheet 1063 Consolidated Statement of Profit & Loss 1074 Consolidated Notes to Accounts 1085 Consolidated Cashflow Statement 1376 Section 212 (8) disclosure 13862
Independent Auditor's ReportTo the Members ofWelspun Corp LimitedReport on the Financial Statements1. We have audited the accompanying financial statements of Welspun Corp Limited (“the Company'') which comprise the BalanceSheet as at 31 March, 2013, the Statement of Profit and Loss and Cash Flow Statement for the year then ended, and a summary ofsignificant accounting policies and other explanatory information.Management's Responsibility for the Financial Statements2. Management is responsible for the preparation of these financial statements that give a true and fair view of the financial position,financial performance and cash flows of the Company in accordance with the Accounting Standards referred to in sub-section (3C) ofSection 211 of the Companies Act, 1956 ("the Act"). This responsibility includes the design, implementation and maintenance ofinternal control relevant to the preparation and presentation of the financial statements that give a true and fair view and are freefrom material misstatement, whether due to fraud or error.Auditor's Responsibility3. Our responsibility is to express an opinion on these financial statements based on our audit. We conducted our audit in accordancewith the Standards on Auditing issued by the Institute of Chartered Accountants of India. Those standards require that we complywith ethical requirements and plan and perform the audit to obtain reasonable assurance about whether the financial statementsare free from material misstatements.4. An audit involves performing procedures to obtain audit evidence about the amounts and disclosures in the financial statements.The procedures selected depend on the auditor's judgment, including the assessment of the risks of material misstatement of thefinancial statements, whether due to fraud or error. In making those risk assessments, the auditor considers internal control relevantto the Company's preparation and fair presentation of the financial statements in order to design audit procedures that areappropriate in the circumstances. An audit also includes evaluating the appropriateness of accounting policies used and thereasonableness of the accounting estimates made by management, as well as evaluating the overall presentation of the financialstatements.5. We believe that the audit evidence we have obtained is sufficient and appropriate to provide a basis for our audit opinion.Opinion6. In our opinion and to the best of our information and according to the explanations given to us, the said financial statementstogether with the notes thereon, give the information required by the Act in the manner so required and give a true and fair view inconformity with the accounting principles generally accepted in India:a) In the case of the Balance sheet, of the state of affairs of the Company as at 31 March, 2013;b) In the case of the Statement of Profit and Loss, of the Profit of the Company for the year ended on that date; andc) In the case of the Cash Flow Statement, of the cash flows for the year ended on that date.Emphasis of Matter7. We draw attention to Note 46 of the financial statements, relating to remuneration paid/ provided in respect of Managing Directorof the Company, which turned out to be in excess of the limits prescribed under Section 198 read with Schedule XIII to the Act, due toinadequate profit, hence is subject to the approval of the Central Government. Our Opinion is not qualified in respect of this matter.Report on other legal and regulatory requirements8. As required by the Companies (Auditor's Report) Order, 2003 (“the Order"), issued by the Central Government of India in terms ofsub-section (4A) of Section 227 of the Act, we give in the Annexure a statement on the matters specified in paragraphs 4 and 5 of theOrder.9. As required by section 227(3) of the Act, we report that:(i)(ii)We have obtained all the information and explanations which to the best of our knowledge and belief were necessary for thepurpose of our audit;In our opinion, proper books of account as required by law have been kept by the Company so far as appears from ourexamination of those books;63
(iii) The Balance Sheet, the Statement of Profit and Loss and Cash Flow Statement dealt with by this Report are in agreement withthe books of account;(iv) In our opinion, the Balance Sheet, the Statement of Profit and Loss, and Cash Flow Statement comply with the AccountingStandards referred to in sub-section (3C) of Section 211 of the Act;(v)On the basis of written representation received from the directors as at 31 March, 2013, and taken on record by the Board ofDirectors, none of the directors is disqualified as at 31 March, 2013, from being appointed as a director in terms of clause (g) ofsub-section (1) of Section 274 of the Act.For MGB & CoChartered AccountantsFirm Registration Number 101169WJeenendra BhandariPartnerMembership Number 105077Mumbai, 30 May 201364
Annexure referred to in Paragraph (8) under the heading of “Report on Other Legal and RegulatoryRequirements” of our report of even date(i)In respect of its fixed assets:(a)(b)(c)The Company has maintained proper records showing full particulars including quantitative details and situation of fixed assets.The fixed assets have been physically verified by the management under a phased programme of verification, which in ouropinion provides for physical verification of all the fixed assets over the period. According to the information and explanationsgiven to us, no material discrepancies were noticed on such physical verification.During the year, in our opinion, a substantial part of its fixed asset has not been disposed off by the Company.(ii)In respect of its inventories:(a)(b)(c)As explained to us, the inventories (other than materials lying with the third parties which have substantially been confirmed)have been physically verified during the year by the management.In our opinion and according to the information and explanations given to us, the procedures of physical verification ofinventories followed by the management were reasonable and adequate in relation to the size of the Company and the natureof its business.On the basis of our examination of records, in our opinion, the Company has maintained proper records of inventory and nomaterial discrepancies were noticed on physical verification.(iii) According to the information and explanations given to us, the Company has neither granted nor taken any loans, secured orunsecured to/from companies, firms or other parties covered in the register maintained under section 301 of the Act.(iv) In our opinion and according to the information and explanations given to us, there are adequate internal control systemscommensurate with the size of the Company and the nature of its business for the purchases of inventory, fixed assets and for thesale of goods and services. Further, during the course of our audit, we have neither come across nor we have been informed of anyinstance of continuing failure to correct major weakness in the aforesaid internal control systems.(v)To the best of our knowledge and belief and according to the information and explanations given to us:(a)(b)The particulars of contracts or arrangements referred to in section 301 of the Act that need to be entered in the registermaintained under the said section have been so entered.Where such transactions of value in excess of rupees five lakhs in respect of any party during the year, have been made at priceswhich appear prima facie reasonable and/or comparable with the prevailing market prices at the relevant time.(vi) According to the information and explanations given to us, the Company has not accepted any deposit from the public. Therefore,the provisions of Clause (vi) of paragraph 4 of the Order is not applicable to the Company(vii) In our opinion, the Company has an internal audit system commensurate with the size and nature of its business.(viii) We have broadly reviewed the cost records maintained by the Company pursuant to the Companies (Cost Accounting Records)Rules, 2011 as prescribed by the Central Government under Section 209(1)(d) of the Companies Act, 1956 and are of the opinionthat prima facie the prescribed cost records have been maintained. We have, however, not made a detailed examination of the costrecords with a view to determine whether they are accurate or complete.(ix) According to the books and records of the Company examined by us and information and explanations given to us:(a)Undisputed statutory dues, including provident fund, investor education and protection fund, employee state insurance,income tax, sales tax / value added tax, wealth tax, service tax, custom duty, excise duty, cess and any other material statutorydues to the extent applicable have generally been regularly deposited with theappropriate authorities. There are noundisputed amounts payable in respect of the aforesaid dues outstanding as at 31 March 2013 for a period of more than sixmonths from the date they became payable.65
(b)Following are the particulars of dues of income tax, sales tax/value added tax, service tax, custom duty and excise duty whichhave not been deposited on account of any dispute:Name of the Statute Amount Period to which Forum where dispute(Nature of dues) ( ` in million) the amount relates is pendingGujarat Sales Tax Act, 1969 andGujarat Value Added Tax Act, 200324.74 FY 2006-07 High Courtto FY 2008-09Sales Tax / Value Added Tax 13.86 FY 2000-01 toFY 2002-03andFY 2005-06 toFY 2006-07#58.01 FY 2006-07 toFY 2008-09Central Sales Tax Act, 1956Central Sales TaxCentral Excise Act, 1944- Excise DutyGVAT / GujaratCommercial Tax TribunalJoint Commissioner ofCommercial tax, Appeals0.92 FY 2001-02 Sales Tax Tribunal##5.22 FY 2008-09 Joint Commissioner ofCommercial tax, Appeals24.00 FY 2003-04 and High CourtFY 2010-116.33 FY 2006-07 toFY 2007-08and FY 2010-11Custom Excise andService Tax AppellateTribunal9.77 FY 2008-09 Commissioner of CentralExcise and Customs3.45 FY 2007-08 andFY 2009-10Commissioner of CentralExcise and Customs(Appeals)20.52 FY 2009-10 Deputy Commissioner ofCentral Excise andCustoms- Service Tax 10.27 FY 2004-05 toSupreme Court of IndiaFY 2006-07Customs Act, 1962Customs Duty17.04 FY 2007-08 toFY 2010-1182.94 FY 2005-06 toFY 2012-1331.94 FY 2006-07 toFY 2011-1223.59 FY 2008-09 toFY 2012-1321.33 FY 2006-07,FY 2009-10 toFY 2012-13Custom Excise and ServiceTax Appellate TribunalCommissioner/AdditionalCommissioner of CentralExcise and CustomsCommissioner of CentralExcise and Customs(Appeals)Deputy / AssistantCommissioner of CentralExcise and CustomsSuperintendent of CentralExcise and Customs8,609.82** FY 2007-08 to Custom Excise and ServiceFY 2009-10Tax Appellate TribunalIncome Tax Act, 1961Income Tax 2,770.97 FY 2004-05 toFY 2010-11#` 0.7 million paid subsequent to the Balance Sheet date.##` 1.05 million paid subsequent to the Balance Sheet date.**does not include penalty of ` 8,814.82 million (refer note 33)66Commissioner of Incometax, (Appeals)
(x)(xi)(xii)(xiii)(xiv)(xv)(xvi)(xvii)The Company does not have accumulated losses as at 31 March 2013 and has not incurred any cash losses during the year and inthe immediately preceding year.Based on our audit procedures and according to the information and explanations given to us, the Company has not defaulted inrepayment of dues to financial institutions, banks and debenture holders during the year.According to the information and explanations given to us, the Company has not granted loans and advances on the basis ofsecurity by way of pledge of shares, debentures and other securities.The Company is not a chit fund / nidhi / mutual benefit fund / society. The provisions of clause (xiii) of paragraph 4 of the Order,therefore, are not applicable to the Company.According to the information and explanations given to us, the Company is not dealing or trading insecurities. However, theCompany has invested its surplus funds in Mutual Funds / Bonds / Certificates of deposits during the year and maintained properrecords of transactions in respect of its investments and timely entries have been made therein. All securities are held by theCompany in its own name.In our opinion and according to the information and explanations given to us, the terms and conditions on which the Company hasgiven guarantees for loans taken by subsidiaries and others from banks and financial institutions are prima facie not prejudicial tothe interests of the Company.According to the information and explanations given to us, the Company has raised term loans during the year. The term loanshave been applied for the purposes for which they were raised.According to the information and explanations given to us and on overall examination of the Balance Sheet, we report that fundsraised on short-term basis have not been used during the year for long-term investments.(xviii) During the year, the Company has not made any preferential allotment of shares to companies or parties covered in the registermaintained under section 301 of the Act.(xix)(xx)(xxi)According to the information and explanations given to us, the Company has created adequate security in respect of debenturesissued.The Company had raised funds by issue of Compulsorily Convertible Debentures, Global Depository Receipts and ForeignCurrency Convertible Bonds and in the earlier years which have been utilized for the purposes for which they were raised exceptunutilized funds have been temporarily invested as referred in Note 2(e), 2(f) and 4(d)(iv).In our opinion and according to the information and explanations given to us, no fraud by the Company and no significant fraud onthe Company has been noticed or reported during the year.For MGB & CoChartered AccountantsFirm Registration Number 101169WJeenendra BhandariPartnerMembership Number 105077Mumbai, 30 May 201367
Balance Sheet as at 31 March( ` in million)Notes 2013 2012EQUITY AND LIABILITIESShareholders' fundsShare capital 2 1,314.74 1,138.91Reserves and surplus 3 42,715.02 34,490.3744,029.76 35,629.28Compulsorily convertible debentures 2(e) – 7,883.75Non-current liabilitiesLong-term borrowings 4 26,053.72 22,838.77Deferred tax liabilities (net) 5 3,893.91 3,545.12Other long-term liabilities 6 1,764.26 2,417.44Long-term provisions 7 130.46 139.5331,842.35 28,940.86Current liabilitiesShort-term borrowings 8 1,177.93 2,928.18Trade payables 9 19,083.28 25,361.35Other current liabilities 10 6,751.66 8,008.42Short-term provisions 11 1,122.55 1,571.5528,135.42 37,869.50Total 104,007.54 110,323.39ASSETSNon-current assetsFixed assets 12- Tangible assets 29,621.82 30,271.18- Intangible assets 216.23 262.81- Capital work-in-progress 1,784.84 1,979.48Non-current investments 13 19,593.84 14,659.39Long-term loans and advances 14 3,051.27 5,540.98Other non-current assets 15 – 76.3154,268.00 52,790.14Current assetsCurrent investments 16 16,908.26 19,379.99Inventories 17 14,741.86 16,498.50Trade receivables 18 9,770.79 10,927.63Cash and bank balances 19 4,328.63 6,409.43Short-term loans and advances 20 2,320.14 3,078.45Other current assets 21 1,669.88 1,239.2649,739.56 57,533.25Total 104,007.54 110,323.39Notes forming part of the financial statements 1 - 57As per our attached report of even dateFor and on behalf of the BoardFor MGB & Co. B.K.Goenka Braja MishraChartered Accountants Chairman Managing DirectorFirm Registration Number 101169WJeenendra Bhandari B.R.Jaju Pradeep JoshiPartner Chief Financial Officer Company SecretaryMembership Number 105077Mumbai, 30 May 201368
Statement of Profit and Loss for the year ended 31 March( ` in million)Notes 2013 2012RevenueRevenue from operations (Gross) 22 70,601.02 60,541.39Less: Excise duty 4,279.37 2,844.27Revenue from operations (Net) 66,321.65 57,697.11Other income 23 3,003.77 2,192.04Total 69,325.43 59,889.15ExpenditureCost of materials consumed 24 41,559.92 36,908.84Purchases of traded goods 25 9,207.69 6,853.50Changes in inventories of finished goods and goods in process 26 (1,475.94) (843.56)Employee benefits expense 27 2,197.07 1,756.09Other expenses 28 11,139.96 10,136.74Total 62,628.70 54,811.60Profit before finance costs, depreciation/amortization and tax 6,696.73 5,077.55Less: Depreciation and amortization expense 12 2,289.91 1,843.52Finance costs 29 2,988.98 2,470.96Profit before tax and exceptional Items 1,417.84 763.07Less: Exceptional items 35 538.20–Profit before tax after exceptional items 879.64 763.07Tax expense- Current tax 126.09 71.64- MAT Credit Entitlement (126.09) (71.64)- Deferred tax 348.79 113.69Profit after tax 530.86 649.38Earnings per share of ` 5 each fully paid up (in `) 44- Basic 2.29 2.96- Diluted 2.29 2.96Notes forming part of the financial statements 1 - 57As per our attached report of even dateFor and on behalf of the BoardFor MGB & Co. B.K.Goenka Braja MishraChartered Accountants Chairman Managing DirectorFirm Registration Number 101169WJeenendra Bhandari B.R.Jaju Pradeep JoshiPartner Chief Financial Officer Company SecretaryMembership Number 105077Mumbai, 30 May 201369
Notes forming part of the Financial StatementsNote 1 Significant Accounting PoliciesI. Basis of preparation of financial statementsThe financial statements are prepared in accordance with the Indian Generally Accepted Accounting Principles (“GAAP”) as a goingconcern under the historical cost convention on an accrual basis and comply in all material aspects with accounting standardsnotified under Companies (Accounting Standards) Rules, 2006, the provisions of Companies Act, 1956 and guidelines issued by theSecurities and Exchange Board of India (SEBI). The accounting policies adopted in preparation of these financial statements areconsistent with those followed in the previous year.Pursuant to the announcement of the Institute of Chartered Accountants of India (ICAI) on “Accounting for Derivatives” on the earlyadoption of Accounting Standard (AS-30) “Financial Instruments: Recognition and Measurement”, the Company has early adoptedthe standard w.e.f 1 April 2007 to the extent that the adoption does not conflict with the existing mandatory accounting and otherauthoritative pronouncements, Company Law and other regulatory requirements.II.III.IV.Use of estimatesThe preparation of the financial statements requires the management to make estimates and assumptions that affect the reportedamounts of assets and liabilities, disclosure of contingent liabilities as at the date of the financial statements and the reportedamount of revenue and expenses of the year. The estimates and assumptions used in the accompanying financial statements arebased upon management's evaluation of the relevant facts and circumstances as of the date of the financial statements. Theexamples of such estimates include the useful life of the tangible and intangible assets, allowance for doubtful debts/advances,future obligations in respect of retirement benefit plan etc. Actual results could differ from those estimates and in such case thedifference is recognised in the period when known or materialised.Tangible and intangible assets(a)(b)(c)Tangible assets are stated at original cost (net of tax/duty credit availed) less accumulated depreciation, amortisation andimpairment losses except freehold land which is carried at cost. Cost includes cost of acquisition, construction and installation,taxes, duties, freight, other incidental expenses related to the acquisition, trial run expenses (net of revenue) and pre-operativeexpenses including borrowing costs incurred during pre-operational period.Projects under which tangible assets are not ready for their intended use are carried at cost, comprising direct cost, relatedincidental expenses.Intangible assets are carried at cost, net off accumulated amortization and impairment loss, if any.Borrowing costsBorrowing costs that are attributable to the acquisition or construction of qualifying assets are capitalized as part of cost of suchassets till such time the asset is ready for its intended use. All other borrowing costs are recognised as expense.V. Impairment of tangible and intangible assetsAt each balance sheet date, the Company reviews the carrying amount of tangible and intangible assets to determine whether thereis any indication of impairment loss. If any such indication exists, the recoverable amount of the assets is estimated in order todetermine the extent of impairment loss. The recoverable amount is higher of the net selling price and the value in use, determinedby discounting the estimated future cash flows expected from the continuing use of the asset to their present value.VI. Depreciation / Amortization on tangible and intangible assets(a)(b)(c)Depreciation on tangible assets is provided on straight line method at the rates prescribed in Schedule XIV to the CompaniesAct, 1956 except for certain Plant and Machinery which are depreciated on the basis of estimated useful lives of 13 – 15 years.The company has adopted a policy of depreciating both computers and mobile phones based on the useful life of the assets i.e.4 years and 3 years respectively. The rates of depreciation derived from these estimated useful lives are higher than thoseprescribed in Schedule XIV to the Companies Act, 1956.For determining the appropriate rate of depreciation on Plant and Machinery, continuous process plant has been identified onthe basis of technical opinion taken by the Company / Expert.Intangible assets are amortized on a straight-line basis over its expected useful life as estimated by the management.VII. InvestmentsInvestments, which are readily realisable and are intended to be held for not more than one year from the date on which suchinvestments are made, are classified as current investments. All other investments are classified as long-term investments.70
Notes forming part of the Financial StatementsLong-term investments are valued at cost less provision for diminution other than temporary, in the value of such investments.Current investments are valued at lower of cost and fair value.VIII. Revenue recognition(a)(b)(c)(d)(e)Sale of goods is recognized on transfer of significant risks and rewards of ownership to the customers. Export sales arerecognised on the basis of date of bill of lading. Gross sales include excise duty and adjustments for price variations, excludesales tax/value added tax.Export benefits: Duty Entitlement Pass Book (DEPB), Focus Market and Focus Product are recognised on accrual basis. TargetPlus / Duty Free Entitlement Certificate scheme of EXIM policy are recognized when utilized.Revenue from services is recognized on completion of services.Dividend income is recognized when the right to receive the dividend is established.Interest income is recognized at the agreed rate on time proportion basis.IX.InventoriesInventories are valued at lower of cost and net realizable value. The basis of determining cost for various categories of inventories isas follows:-(a) Raw materials, Stores and Spares – Moving weighted average basis.(b) Goods-in-process – Cost of materials plus labour and other production overheads.(c) Finished goods – Cost of materials plus labour, production overheads and excise duty on such goods.X. Foreign currency transactions(a)(b)(c)Transaction in foreign currency are accounted at the exchange rate prevailing on the date of such transactions. Currentmonetary assets and liabilities are translated at the exchange rate prevailing at the reporting date. Non-monetary items arecarried at cost.Gains or losses arising on remittance / translations at the year- end are credited / debited to the statement of profit and lossexcept treatment as per amendment to AS-11 effective till 31 March 2020 (Refer note 31 (b))Premium / discount on forward exchange contracts not relating to firm commitments or highly probable forecastedtransactions and not intended for trading or speculation purposes is amortized as income or expense over the life of thecontract.XI.Derivative instruments and hedge accountingThe Company uses foreign currency derivative contracts to hedge its risk associated with foreign currency fluctuations relating tocertain firm commitments and forecasted transactions. The Company designates these hedging instruments as cash flow hedgesand applying the recognition and measurement principles set out in Accounting Standard 30 “Financial Instruments: Recognitionand Measurement” (AS 30). The gain or loss on the effective hedges is recorded in “Hedging Reserve Account” until the transactionis complete. The gain or loss is accounted in the statement of Profit and Loss upon completion of the transaction or when the hedgeinstrument expires or terminates or ceases to qualify for hedge accounting.XII. Employee benefits(a)(b)(c)Short-term employee benefits are recognized as an expense at the undiscounted amount in the statement of profit and loss ofthe year in which the related services are rendered.Post employment and other long-term benefits are recognized as an expense in the statement of Profit and Loss of the year inwhich the employee has rendered services. The expense is recognized at the present value of the amounts payable determinedusing actuarial valuation techniques. Actuarial gains and losses in respect of post employment and other long-term benefits arerecognized in the statement of Profit and Loss.Payments to defined contribution retirement benefit schemes are charged as expenses as and when they fall due.XIII. Employee stock options schemeIn respect of employee stock options granted pursuant to the Company’s Stock Option Scheme, the intrinsic value of the options(excess of market price of the share over the exercise price of the option) is treated as discount and accounted as employeecompensation cost over the vesting period.71
Notes forming part of the Financial StatementsXIV. Accounting for taxes on income(a)(b)Current tax is determined as the amount of tax payable in respect of taxable income for the year computed as per the provisionsof the Income Tax Act, 1961.Deferred tax is recognized subject to consideration of prudence, on timing difference, being the difference between taxableincome and accounting income that originate in one period and are capable of reversal in one or more subsequent periods andmeasured using relevant enacted tax rates.XV. Leasesa) Finance leaseAssets acquired under finance lease are capitalised and the corresponding lease liability is recognized at lower of the fair valueof the leased assets and the present value of minimum lease payments at the inception of the lease. Intial costs directlyattributable to lease are recognized with the asset under lease.b) Operating leaseLease of assets under which all the risks and rewards of ownership are effectively retained by the lessor are classified asoperating lease. Lease payments under operating leases are recognized as an expense on accrual basis in accordance with therespective lease agreements.XVI. Provisions, contingent liabilities and contingent assetsContingent liabilities are disclosed in respect of possible obligations that arise from past events but their existence will be confirmedby the occurrence or non-occurrence of one or more uncertain future events. A provision is made when it is probable that an outflowof resources embodying economic benefits will be required to settle an obligation and in respect of which a reliable estimate can bemade. Provision is not discounted and is determined based on best estimate required to settle the obligation at the year end date.Contingent assets are not recognized or disclosed in the financial statementsXVII.Earnings per shareBasic earnings per share is computed and disclosed using the weighted average number of equity shares outstanding during theyear. Dilutive earnings per share is computed and disclosed using the weighted average number of equity and dilutive equityequivalent shares outstanding during the year, except when the results would be anti-dilutive.( ` in million)2013 20122. Share capitalAuthorised304,000,000 (304,000,000) Equity Shares of ` 5/- each 1,520.00 1,520.0098,000,000 (98,000,000) Preference Shares of ` 10/- each 980.00 980.00Total 2,500.00 2,500.00Issued, subscribed and paid up262,948,299 (227,781,035) Equity Shares of ` 5/- each fully paid up 1,314.74 1,138.91Total 1,314.74 1,138.9172
Notes forming part of the Financial Statementsa) Reconciliation of number of Equity shares outstandingAt the beginning of the year 227,781,035 1,138.91 204,668,910 1,023.34– By way of Global Depository Receipts (GDR) – – 23,026,000 115.13– By way of Conversion of Compulsory Convertible Debentures (CCD) 35,038,889 175.19 – –– Equity shares allotted on exercise of Employees Stock Options 128,375 0.64 86,125 0.43b) Terms and rights attached to equity sharesc) Shareholders holding more than 5% shares of the companyJ P Morgan Chase Bank, NA ADR Account (Custodian and againstwhich GDR have been issued to Insight Solutions Limited) 23,026,000 8.76 23,026,000 10.11Granele Limited 35,038,889 13.33 – –Life Insurance Corporation of India Limited & its Schemes 19,283,580 7.33 19,277,980 8.46Welspun Wintex Limited 13,336,576 5.07 13,336,576 5.85Welspun Mercantile Limited 13,877,701 5.28 12,377,701 5.43Welspun Fintrade Limited 18,955,791 7.21 15,148,340 6.65Krishiraj Trading Limited 26,907,692 10.23 26,805,403 11.77d) Employee Stock Options Scheme2013 2012Number of ` in million Number of ` in millionEquity SharesEquity SharesOutstanding at the end of the year 262,948,299 1,314.74 227,781,035 1,138.91The Company has only one class of equity shares having a par value of ` 5 per share. Each holder of equity shares is entitled to onevote per share, however the holders of global depository receipts (GDR's) do not have voting rights in respect of shares representedby the GDR's till the shares are held by the custodian. The dividend when proposed by the Board of Directors is subject to theapproval of the shareholders in the ensuing Annual General Meeting.In the event of liquidation of the company, the holders of the equity shares will be entitled to receive remaining assets of thecompany, after distribution of preferential amounts. The distribution will be in proportion to the number of equity shares held by theshareholders.2013 2012Name of Shareholders Number of Percentage Number of PercentageEquity Shares (%) Equity Shares (%)In respect of options granted under the Welspun Employee Stock Options Scheme, in accordance with the guidelines issued bySecurities and Exchange Board of India, the value of options (based on intrinsic value of the share on the date of the grant of theoption) is accounted as deferred employee compensation, which is amortized on a straight line basis over the vesting period.Employee benefits expense include credit of ` 6.60 million ( ` 1.51 million) on account of reversal of options lapsed during the year.During the year, 128,375 equity shares of `5 each fully paid up were issued at a price of `80.00. Discount allowed aggregating to` 3.43 million ( ` 2.27 million) in respect of shares allotted pursuant to the Employee Stock Options Scheme is credited toSecurities Premium Account as per guidelines of Securities and Exchange Board of India.73
Notes forming part of the Financial StatementsStock options outstanding as at the year end are as follows:Granted during Granted during2006-07 2009-10Exercise price `80.00 `66.75Date of grant 8 January 2007 20 April 2009Vesting period commences on 8 January 2008 20 April 2010Options outstanding at the beginning of the year 375,250 32,875Options exercised during the year 128,375 –Options lapsed during the year 246,875 –Options outstanding as at 31 March 2013 – 32,875e) Compulsorily Convertible Debentures (CCD)During the previous financial year, the Company has raised US$ 178.01 million (Equivalent INR 7,883.75 million) by way of issue ofunsecured CCD carrying a coupon of 5% (Five) annually until issue of Equity Shares upon conversion of the CCD. Since the holder ofCCD have not opted for conversion during the period of 18 months from the date of issue of the said CCD, the CCD got converted on18 February 2013 into 35,038,889 equity shares of ` 5 each fully paid up at a conversion price of ` 225 per share. The entire proceedshave been invested in short-term securities as at 31 March 2013.f) Global Depository Receipts (GDR)During the previous year, the Company has raised US$ 115.00 million (Equivalent INR 5,180.85 million) by way of issue of 23,026,000equity shares of ` 5 each fully paid up at a premium of ` 220 each (equivalent 23,026 Non-voting GDR each of US$ 4,994.45 eachrepresenting 1000 equity shares of par value of ` 5 each). The entire proceeds have been invested in short-term securities as at31 March 2013.( ` in million)2013 20123. Reserves and surplusCapital reserveAs per last balance sheet 1,057.26 1,057.26Securities premiumAs per last balance sheet 17,252.74 12,332.32Add/(Less): Received during the year 7,718.18 5,072.08Discount on issue of shares under employees stock option scheme 3.43 2.27Premium on redemption of foreign currency convertible bonds 11.70 (45.75)Utilized towards share / debenture issue expenses (56.40) (108.17)24,929.65 17,252.74Debenture redemption reserveAs per last balance sheet 1,464.29 1,107.14Add: Appropriated during the year (321.92) 357.141,142.36 1,464.29Employee stock options outstanding0.73 10.77Hedging reserve account [refer note 31(c)] (44.84) (178.18)Foreign Currency Monetory Item Translation Difference account [refer note 31(b)] (275.37) (322.97)General reserveAs per last balance sheet 1,696.11 1,631.11Add: Appropriated during the year 53.09 65.001,749.20 1,696.11Surplus in the statement of Profit and LossAs per last balance sheet 13,510.35 13,415.48Profit for the year 530.86 649.38Less: AppropriationsGeneral reserve 53.09 65.00Debenture redemption reserve (321.92) 357.14Proposed dividend on equity shares 131.47 113.89Tax on proposed dividend 22.34 18.48Dividend on equity shares of earlier year 0.20 –Total Appropriations(114.82) 554.51Net Surplus in the Statement of Profit and Loss14,156.03 13,510.35Total 42,715.02 34,490.3774
Notes forming part of the Financial Statements4. Long-term borrowingsSecured( ` in million)Redeemable non-convertible debentures 13,428.00 10,000.00 – 1,700.00External commercial borrowings 6,542.09 5,174.13 2,721.68 2,577.38Term loan from bank 1,614.98 – – –Other loans 27.73 – 6.04 –UnsecuredNon-currentCurrent2013 2012 2013 2012Foreign currency convertible bonds 4,424.23 7,631.25 – –Deferred sales tax loan 16.69 33.39 16.69 16.69Total 26,053.72 22,838.77 2,744.41 4,294.07a) The debentures together with interest are secured by first charge ranking pari passu by way of mortgage/hypothecation of entireimmovable and movable fixed assets of the Company, both present and future and second/floating charge on current assets, subjectto prior charge in favour of banks for working capital facilities.Name of Shareholders Face value Redemption Rate of Amount( `) date interest (p.a.) ( `in million)5000 1,000,000 September 2025 9.55% 5,0005000 1,000,000 August 2025 9.55% 5,000900 1,000,000 November 2020 11.00% 900328 1,000,000 September 2019 11.15% 3282200 1,000,000 August 2019 11.15% 2,200Total 13,428b )External commercial borrowings (ECB) is secured by first charge ranking pari passu by way of mortgage/hypothecation of entireimmovable and movable tangible assets of the Company both present and future. Further, the ECB is also secured by exclusivecharge by way of hypothecation of Debt Service Reserve Account. The ECB comprises of US$ 163.45 million (US$ 140 million) and JPY677.65 million (JPY 1015.20 million) and carries interest of LIBOR plus 1.25% to 4.50%.The ECB is repayable as followsRepayment schedule US$ Amount JPY Amount(million) ( `in million) (million) ( `in million)April 2013 46.55 2,526.97 337.55 194.71April 2014 46.90 2,545.97 340.10 196.18April 2015 2.70 146.57 – –October 2015 2.70 146.57 – –April 2016 4.00 217.14 – –October 2016 14.00 759.99 – –April 2017 4.00 217.14 – –October 2017 14.00 759.99 – –April 2018 4.00 217.14 – –October 2018 14.00 759.99 – –April 2019 5.30 287.71 – –October 2019 5.30 287.71 – –Total 163.45 8,872.88 677.65 390.8975
Notes forming part of the Financial Statementsc) Term loan from bankTerm loan of US$ 29.75 million equivalent to ` 1,614.98 million (US$ Nil) from bank is secured by first charge ranking pari passu byway of mortgage/hypothecation of entire movable and immovable tangible assets of the Company and second charge over theentire current assets of the company both, present and future. The loan carries interest of LIBOR plus 5.00%. The loan is repayable in18 equal quarterly instalments after a moratorium of 30 months from the date of first disbursement i.e. 15 November 2012.d) Foreign Currency Convertible Bonds (FCCB)i) During the financial year 2009 - 2010, the Company had raised US$ 150 million (Equivalent INR 6,942 million) by way of issue of1500 4.5% FCCB of US$ 100,000 each. The Bond holders have an option to convert outstanding bonds (US$ 81.50 million)into 13,045,433 equity shares of ` 5 each fully paid up at an initial conversion price of ` 300 per share with a fixed rateof exchange on conversion of ` 48.02 = US$ 1 at any time on or after 26 November 2009 until 10 days prior to Maturity date(i.e. 17 October 2014). Unless previously converted, redeemed or repurchased and cancelled, the Bonds will be redeemed on17 October 2014 at 102.8028% of the principal amount so as to give a gross yield of 5% per annum (calculated on semi annualbasis) to the Bond holders.The Company has an option to redeem the Bonds at their Early Redemption amount upon occurrence of events specified in theOffering Circular for issue of the Bonds (“Offering Circular”). Further, the Company has an option to mandatorily convert theBonds after three years as specified in the Offering Circular.ii) Premium payable on redemption of FCCB aggregating to credit of `11.70 million (debit of `45.75 million) has been adjustedagainst securities premium as per Section 78 of the Companies Act, 1956. In the event, Bond holders exercise the conversionoption, the amount of premium utilized from securities premium will be suitably adjusted in respective years.iii)iv)During the year, the company has repurchased 685 4.5% FCCB of US$ 100,000 each aggregating to US$ 68.50 million at adiscount gain of US$ 4.00 million (equivalent ` 216.70 million) arising on repurchase of FCCB is shown under "Other income".Part of the net proceeds received from the issue of FCCB has been utilized as per objects of the issue viz for funding of Plate andCoil Mill, Pipe Mill Capex Projects (Anjar and Mandya) and Investment in overseas subsidiary. Pending utilization, the balanceissue proceeds of US$ 0.55 million equivalent INR 30.09 million (US$ 17.04 million equivalent INR 866.91 million) have beeninvested in short term deposits/current account with a bank abroad and ` Nil ( ` 1.46 million) lying in current account with abank in India.( ` in million)2013 20125. Deferred tax liabilities (net)Deferred tax liabilitiesFiscal allowance on fixed assets 4,466.42 4,157.08Others 93.60 104.794,560.02 4,261.86Deferred tax assetsEmployee benefits 17.47 15.17Provision for doubtful debts and advances 79.74 56.49Unabsorbed fiscal allowances 568.90 645.09666.11 716.75Total 3,893.91 3,545.12( ` in million)2013 20126. Other long-term liabilitiesLiability towards claims 1,764.26 2,417.44Total 1,764.26 2,417.4476
Notes forming part of the Financial Statements7. Long-term provisions( ` in million)2013 2012Employee benefits 46.98 44.35Premium payable on redemption of FCCB 83.48 95.188. Short-term borrowingsSecuredTotal 130.46 139.53( ` in million)2013 2012Working capital loan from banks 1,177.93 1,727.28(Secured by first charge on hypothecation of raw materials, finished goods and work /goods in process, stores & spares and book debts of the Company and second charge onentire immovable and movable fixed assets of the Company both present and future.)Short-term loan from other parties – 1,200.90(Secured against pledge of bonds of ` 1,200.90 million held as current investments)Total 1,177.93 2,928.18( ` in million)2013 20129. Trade payablesAcceptances 17,127.63 22,145.05Others (refer note 30) 1,955.65 3,216.30Total 19,083.28 25,361.35( ` in million)2013 201210. Other current liabilitiesCurrent maturities of long term borrowings (refer note 4) 2,744.41 4,294.07Interest accrued but not due on borrowings 517.75 557.86Unclaimed dividend 5.30 5.20Other payablesCreditors for- Capital goods 179.76 175.54- Expenses 908.53 759.24Trade advances and deposits 1,026.90 1,229.56Statutory dues 553.80 732.58Liability towards claims 815.22 254.38Total 6,751.66 8,008.42( ` in million)2013 201211. Short-term provisionsEmployee benefits 3.85 2.40Others forProposed equity dividend 131.47 113.89Tax on proposed equity dividend 22.34 18.48Litigations 79.79 79.79Liquidated damages 461.08 572.07Mark to market losses on derivative contracts 308.29 521.76Taxation (net of advances) 115.72 263.16Total 1,122.55 1,571.5577
Notes forming part of the Financial StatementsNote 12 - Fixed assets ( in mi ion)`Gross Block Depreciation/Amortization Net BlockAs at Additions Deductions As at Upto For the year Deductions Impairment Upto As at As at01 April 31 March 01 April 31 March 31 March 31 March2012 2013 2012 2013 20132012a) Tangible assetsFreeho d and 192.66 7.70 – 200.37 – – – – – 200.37 192.66Bui dings 4,668.71 577.58 – 5,246.29 615.76 133.11 – – 748.87 4,497.42 4,052.95P ant and machinery 33,215.95 1,043.47 21.46 34,237.97 7,489.50 2,013.21 12.61 105.59 9,595.69 24,642.28 25,726.45Office and other equipments 334.00 18.13 2.88 349.25 147.02 36.54 1.67 – 181.90 167.35 186.97Vehic es 56.39 11.31 5.06 62.64 25.17 5.79 2.31 0.51 29.16 33.48 31.22Furnitures and fixtures 127.28 11.74 5.59 133.43 46.35 8.87 2.66 – 52.56 80.87 80.92Total (a) 38,594.98 1,669.94 34.98 40,229.94 8,323.80 2,197.53 19.25 106.09 10,608.17 29,621.82 30,271.18b) Intangible assetsSoftware 468.83 46.24 – 515.07 206.02 92.81 – 298.83 216.23 262.81Total (b) 468.83 46.24 – 515.07 206.02 92.81 – – 298.83 216.23 262.81Total (a+b) 39,063.81 1,716.18 34.98 40,745.00 8,529.82 2,290.34 19.25 106.09 10,907.01 29,838.05 30,533.99Previous year31,744.85 7,376.09 57.13 39,063.81 6,698.52 1,847.83 16.52 8,529.82 30,533.99Capital work-in-progress 1,784.84 1,979.48Notes:1. Gross b ock of P ant and Machinery inc udes ` 63.49 mi ion ( ` 63.49 mi ion) in respect of expenditure incurred on capita asset, ownership of which does not vest in the Company.2. Depreciation and amortisation expense for the year inc udes `0.43 mi ion ( `4.30 mi ion) transferred to pre-operative expenses.3. For detai s of exchange difference capita ised as per amended AS-11, refer note 31 (b).4. Pre-operative expenses of ` 52.60 mi ion ( ` 249.44 mi ion) in respect of projects have been capita ized during the year.5. Borrowing costs a ocated to fixed assets / capita work-in-progress is `27.73 mi ion ( `241.41 mi ion).6. Capita work-in-progress inc udes pre-operative expenses of `Ni ( `52.60 mi ion)78
Notes forming part of the Financial Statements( ` in million)2013 201213. Non-current investments(Valued at cost unless stated otherwise)A. Trade investments – Unquotedi) Wholly owned subsidiariesWelspun Pipes Inc.10,001 (10,001) equity shares of US$ 1 each 0.44 0.44Nil (16,000) redeemable preferred stock of US$ 1,000 each – 645.50Welspun Pipes Limited 0.50 0.5050,000 (50,000) equity shares of ` 10 eachWelspun Infratech Limited48,639,899 (48,639,899) equity shares of ` 10 each 1,920.85 1,920.8542,289 (28,300) 7% unsecured optionally convertible debentures of ` 100,000 each 4,228.90 2,830.00Welspun Tradings Limited 50.22 50.225,013,402 (5,013,402) equity shares of ` 10 eachWelspun Natural Resources Private Limited 186.60 186.601,875,000 (1,875,000) equity shares of ` 10 eachii) Other SubsidiariesWelspun Maxsteel Limited113,622,058 (113,622,058) equity shares of ` 10 each 8,042.17 8,042.173,740,000 (Nil) 0% redeemable preference shares of ` 10 each 37.40 –Welspun Mauritius Holdings Limited102,089 (102,089) equity shares of US$ 1 each 4.70 4.7080,009,968 (14,999,968) preference shares of US$ 1 each 3,976.65 680.04Welspun Infra Enterprises Limited 0.50 –50,000 (Nil) equity shares of ` 10 eachiii) Joint VentureDahej Infrastructure Private Limited (Extent of holding 50%)500,000 equity shares of ` 10 each – 5.00Less: Provision for diminution in the value – (5.00)iv) AssociatesRed Lebondal Limited (Extent of holding 25%) 0.03 0.03450 (450) equity shares of Euro 1 eachLess: Provision for diminution in the value (0.03) –Welspun Energy Limited (Extent of holding 26%) 910.85 262.7460,493,342 (17,515,300) equity shares of ` 10 eachWelspun Captive Power Generation Limited (Extent of holding 24%)2,938,427 (5,000) equity shares of ` 10 each fully paid up 29.41 0.0516,976,573 (Nil) preference shares of ` 10 each fully paid up 169.86 –B. Other investments – QuotedStandard Chartered Bank PLC Indian Depository Receipt 34.77 34.77334,331 (334,331) Indian Depository Receipt of ` 100 eachC. Other investments – UnquotedWelspun Enterprises (Cyprus) Limited 0.77 0.7711,800 (11,800) equity shares of Euro 1 eachLess: Provision for diminution in the value (0.77) –Total 19,593.84 14,659.39(All the above shares and securities are fully paid up)Aggregate book value of quoted investments 34.77 34.77Aggregate book value of unquoted investments 19,559.87 14,629.62Aggregate market value of quoted investments 39.58 31.43Aggregate provision for dimunition in value of investments 0.80 5.0079
Notes forming part of the Financial Statements( ` in million)2013 201214. Long-term loans and advances(Unsecured considered good, unless otherwise stated)Capital advances- Subsidiary (refer note 40) – 26.13- Others 119.43 88.54Less: Provision for doubtful advances 4.68 2.14114.75 112.54Deposits- Related parties (refer note 40) 309.60 351.10- Others 68.07 71.57Less: Provision for doubtful deposits 2.86 2.84374.80 419.83Loans and advances to related parties (refer note 40)Loan to Subsidiary 1,618.95 1,116.32Share application money- Subsidiaries 610.59 2,807.24- Other related parties 21.55 894.762,251.09 4,818.31Other loans and advancesAdvances recoverable in cash or kind 104.31 113.41Prepaid expenses 8.51 4.87Loan to employees 0.08 0.36Minimum Alternative Tax credit entitlement 197.73 71.64310.63 190.28Total 3,051.27 5,540.98( ` in million)2013 201215. Other non-current assetsReceivable towards claim – 76.31Total – 76.31( ` in million)2013 201216. Current Investments(Valued at lower of cost and fair value, unless stated otherwise)Quotedi) Bonds8.30% Government of India Loan 2042 358.37 –3,500,000 (Nil) Bonds of ` 100 each7.80% Government of India Loan 2021 49.50 –500,000 (Nil) Bonds of ` 100 each8.20% Government of India Loan 2025 714.10 –7,000,000 (Nil) Bonds of ` 100 each8.15% Government of India Loan 2022 1,119.97 –11,000,000 (Nil) Bonds of ` 100 each8.33% Government of India Loan 2026 723.92 –7,000,000 (Nil) Bonds of ` 100 each8.28% Government of India Loan 2032 259.83 –2,535,000 (Nil) Bonds of ` 100 each80
Notes forming part of the Financial Statements( ` in million)2013 20128.33% Government of India Loan 2036 520.40 –5,000,000 (Nil) Bonds of ` 100 each9.45% Gujarat State Petroleum Corp Limited 2022 465.08 –450 (Nil) Bonds of ` 1,000,000 each9.80% Gujarat State Petroleum Corp Limited 2073 600.00 –600 (Nil) Bonds of ` 1,000,000 each10.45% Gujarat State Petroleum Corp Limited 2072 551.80 –531 (Nil) Bonds of ` 1,000,000 each9.03% Gujarat State Petroleum Corp Limited 2028 1,500.36 –1,500 (Nil) Bonds of ` 1,000,000 each9.60% HDB Financial Services Limited 2023 250.00 –250 (Nil) Bonds of ` 1,000,000 each8.85% IDFC Limited 2016 217.00 –217 (Nil) Bonds of ` 1,000,000 each9.90% Industrial Finance Corporation of India Limited 2022 210.56 –8,510 (Nil) Bonds of ` 25,000 each9.90% Industrial Finance Corporation of India Limited 2027 721.00 –29,140 (Nil) Bonds of ` 25,000 each9.90% Industrial Finance Corporation of India Limited 2032 406.03 –16,410 (Nil) Bonds of ` 25,000 each9.90% Industrial Finance Corporation of India Limited 2037 653.21 –26,400 (Nil) Bonds of ` 25,000 each9.90% Industrial Finance Corporation of India Limited 2021 196.34 –193 (Nil) Bonds of ` 1,000,000 each10.15% Industrial Finance Corporation of India Limited 2023 43.00 –430 (Nil) Bonds of ` 100,000 eachIndustrial Finance Corporation of India Limited Deep Discount Bond 2033 22.04 –3,390 (Nil) Bonds of ` 25,000 eachIndustrial Finance Corporation of India Limited Deep Discount Bond 2039 269.56 –41,470 (Nil) Bonds of ` 25,000 eachIndustrial Finance Corporation of India Limited Deep Discount Bond 2040 269.56 –41,470 (Nil) Bonds of ` 25,000 each7.70% Indian Overseas Bank 2016 16.65 –17 (Nil) Bonds of ` 1,000,000 each7.77% Indian Railway Finance Corporation Limited 2026 1.01 –10 (Nil) Bonds of ` 100,000 each8.90% Jarkhand State Development Loan 2022 5.04 –50,000 (Nil) Bonds of ` 100 each9.18% NABARD 2017 101.82 –100 (Nil) Bonds of ` 1,000,000 each8.85% Power Grid Corporation of India Limited 2027 13.78 –11 (Nil) Bonds of ` 1,250,000 each8.20% Power Finance Corporation Limited 2022 2.09 –2,000 (Nil) Bonds of ` 1,000 each9.28% Rural Electrification Corporation Limited 2017 102.07 –100 (Nil) Bonds of ` 1,000,000 each8.70% Rural Electrification Corporation Limited 2018 149.96 –150 (Nil) Bonds of ` 1,000,000 each81
Notes forming part of the Financial Statements( ` in million)2013 20129.85% Reliance Capital Limited 2023 450.00 –450 (Nil) Bonds of ` 1,000,000 each9.95% Reliance Capital Limited 2022 30.00 –30 (Nil) Bonds of ` 1,000,000 each10.40% Reliance Capital Limited 2022 47.13 –47 (Nil) Bonds of ` 1,000,000 each10.00% Reliance Capital Limited 2017 57.24 –57 (Nil) Bonds of ` 1,000,000 each10.10% Reliance Capital Limited 2022 21.16 –21 (Nil) Bonds of ` 1,000,000 each10.20% SREI Infrastructure Finance Limited 2020 155.00 –155 (Nil) Bonds of ` 1,000,000 each10.75% SREI Infrastructure Finance Limited 2014 75.00 –75 (Nil) Bonds of ` 1,000,000 each8.30% Government of India Loan 2040 413.55 616.984,000,000 (6,350,000) Bonds of ` 100 each8.83% Government of India Loan 2041 599.94 2,229.065,500,000 (21,600,000) Bonds of ` 100 each8.97% Government of India Loan 2030 1,811.10 1,660.9916,614,500 (16,000,000) Bonds of ` 100 each9.15% Government of India Loan 2024 26.00 570.99240,000 (5,500,000) Bonds of ` 100 each8.97% Andhra Pradesh State Development Loan 2022 20.03 20.03200,000 (200,000) Bonds of ` 100 eachIndustrial Finance Corporation of India Limited Deep Discount Bond 2031 184.63 114.7228,404 (26,104) Bonds of ` 25,000 eachIndustrial Finance Corporation of India Limited Deep Discount Bond 2032 269.56 77.4741,470 (15,650) Bonds of ` 25,000 each9.70% Industrial Finance Corporation of India Limited 2030 4.12 374.294 (362) Bonds of ` 1,000,000 eachIndustrial Finance Corporation of India Limited Deep Discount Bond 2034 269.56 170.5041,470 (41,470) Bonds of ` 25,000 eachIndustrial Finance Corporation of India Limited Deep Discount Bond 2035 31.17 14.514,795 (4,795) Bonds of ` 25,000 eachIndustrial Finance Corporation of India Limited Deep Discount Bond 2036 14.24 5.702,190 (2,190) Bonds of ` 25,000 eachIndustrial Finance Corporation of India Limited Deep Discount Bond 2037 112.91 44.4117,370 (14,840) Bonds of ` 25,000 eachIndustrial Finance Corporation of India Limited Deep Discount Bond 2038 269.56 134.9041,470 (41,470) Bonds of ` 25,000 each8.99% Madhya Pradesh State Development Loan 2022 5.06 5.0650,500 (50,500) Bonds of ` 100 each8.81% West Bengal State Development Loan 2021 10.08 250.33100,000 (2,500,000) Bonds of ` 100 each10.05% Air India Limited Bonds 2031 – 2,978.23Nil (2,786) Bonds of ` 1,000,000 each8.71% Andhra Pradesh State Development Loan 2022 – 267.70Nil (2,674,500) Bonds of ` 100 each82
Notes forming part of the Financial Statements( ` in million)2013 20128.79% Government of India Loan 2021 – 624.57Nil (6,000,000) Bonds of ` 100 each8.78% Gujarat State Development Loan 2021 – 10.00Nil (100,000) Bonds of ` 100 each9.23% Gujarat State Development Loan 2021 – 252.60Nil (2,500,000) Bonds of ` 100 each9.25% IDBI Bank Limited – 16.91Nil (17) Bonds of ` 1,000,000 each9.65% Krishna Bhagya Jala Nigam Limited 2022 – 730.00Nil (730) Bonds of ` 1,000,000 each8.48% LIC Housing Finance Limited 2013 – 49.57Nil (50) Bonds of ` 1,000,000 each8.73% Madhya Pradesh State Development Loan 2022 – 151.61Nil (1,500,000) Bonds of ` 100 each8.79% Maharashtra State Development Loan 2021 – 250.35Nil (2,500,000) Bonds of ` 100 each9.42% National Fertilizers Limited 2016 – 100.00Nil (100) Bonds of ` 1,000,000 each8.20% National Highways Authority of India 2022 – 144.48Nil (141,565) Bonds of ` 1,000 each8.30% National Highway Authority of India 2027 – 81.77Nil (79,000) Bonds of ` 1,000 each9.00% NTPC Limited 2027 – 45.40Nil (227) Bonds of ` 200,000 each9.35% Power Grid Corporation of India Limited 2018 – 100.60Nil (100) Bonds of ` 1,000,000 each9.25% Power Grid Corporation of India Limited 2018 – 1,121.95Nil (896) Bonds of ` 1,250,000 each9.70% Power Finance Corporation Limited 2018 – 50.98Nil (50) Bonds of ` 1,000,000 each9.36% Power Finance Corporation Limited 2021 – 549.47Nil (550) Bonds of ` 1,000,000 each9.45% Power Finance Corporation Limited 2026 – 194.71Nil (195) Bonds of ` 1,000,000 each9.46% Power Finance Corporation Limited 2026 – 600.82Nil (595) Bonds of ` 1,000,000 each9.61% Power Finance Corporation Limited 2021 – 495.00Nil (500) Bonds of ` 1,000,000 each8.80% Pondicherry State Development Loan 2022 – 80.01Nil (800,000) Bonds of ` 100 each9.38% Rural Electrification Corporation Limited 2016 – 108.50Nil (108) Bonds of ` 1,000,000 each9.48% Rural Electrification Corporation Limited 2021 – 896.10Nil (887) Bonds of ` 1,000,000 each9.75% Rural Electrification Corporation Limited 2021 – 100.00Nil (100) Bonds of ` 1,000,000 each9.02% Rajasthan State Development Loan 2021 – 101.24Nil (1,000,000) Bonds of ` 100 each83
Notes forming part of the Financial Statements( ` in million)2013 20129.23% Rajasthan State Development Loan 2021 – 101.53Nil (1,000,000) Bonds of ` 100 each9.85% SBI Cards and Payments Services Limited 2019 – 400.00Nil (400) Bonds of ` 1,000,000 each11.40% SREI Infrastructure Finance Limited 2022 – 500.00Nil (500) Bonds of ` 1,000,000 each10.20% Tourism Finance Corporation of India Limited 2021 – 54.00Nil (54) Bonds of ` 1,000,000 each11.80% TATA Iron and Steel Company Perpetual Bonds – 531.25Nil (500) Bonds of ` 1,000,000 each8.71% Tamilnadu State Development Loan 2022 – 356.18Nil (3,554,500) Bonds of ` 100 each8.72% Tamilnadu State Development Loan 2022 – 130.06Nil (1,300,000) Bonds of ` 100 each9.02% Uttar Pradesh State Development Loan 2021 – 200.90Nil (2,000,000) Bonds of ` 100 each9.04% West Bengal State Development Loan 2021 – 50.16Nil (500,000) Bonds of ` 100 each9.28% West Bengal State Development Loan 2021 – 101.93Nil (1,000,000) Bonds of ` 100 each10.85% West Bengal State Electricity Distribution Company Limited 2026 – 69.06Nil (69) Bonds of ` 1,000,000 each8.60% LIC Housing Finance Limited 2020 – 4.13Nil (4) Bonds of ` 1,000,000 eachii) Certificate of depositsAndhra Bank Limited 2013 244.51 –2,500 (Nil) Bonds of ` 100,000 eachIndusind Bank Limited 2013 491.75 –5,000 (Nil) Bonds of ` 100,000 eachSicom Limited 500.00 –1 (Nil) CD of ` 500,000,000 eachUCO Bank Limited 2012 – 243.91Nil (2,500) units of ` 100,000 eachAllahabad Bank Limited 2012 – 244.43Nil (2,500) units of ` 100,000 eachiii) Mutual fundReliance Liquid Fund – Treasury Plan – Daily Dividend Option 280.97 –Total 16,908.26 19,379.99Aggregate book value of quoted investments16,908.26 19,379.99Aggregate market value of quoted investments17,107.31 19,651.5084
Notes forming part of the Financial Statements( ` in million)2013 201217. InventoriesRaw materials (including goods-in-transit of `3,408.22 million ( `2,775.64 million)) 5,779.37 8,930.06Goods-in-process 2,939.08 1,300.61Finished goods 4,698.54 4,861.07Stores and spares 1,324.86 1,406.75Total 14,741.86 16,498.50Details of inventories under broad headsRaw materialsH.R. Coils 946.99 902.51H.R. Plates 676.00 2,967.19M.S. Slabs 474.22 1,915.39Others 273.92 369.33Goods-in-transit 3,408.23 2,775.64Total 5,779.37 8,930.06Goods-in-processWelded pipes 2,099.33 229.57Coating 8.83 14.94Plates and Coils 223.79 461.43Others 607.13 594.68Total 2,939.08 1,300.61Finished goodsWelded pipes 3,151.20 3,809.74M.S. Plates 635.86 907.30H.R Coils 743.64 120.41Coating 167.85 23.62Total 4,698.54 4,861.07( ` in million)2013 201218. Trade receivables*(Unsecured)Over six monthsConsidered good 805.79 1,289.06Considered doubtful 90.65 62.60Less: Provision for doubtful debts (90.65) (62.60)805.79 1,289.06Others considered good 8,965.00 9,638.57Total 9,770.79 10,927.63*includes receivable from Subsidiaries ` 5,667.50 million ( `2,760.50 million)85
Notes forming part of the Financial Statements19. Cash and bank balances( ` in million)2013 2012Cash and cash equivalentsBalances with banks:- Current accounts 3,579.04 3,649.09- Deposits having original maturity period of less than three months 57.14 1,877.65Cheques on hand 0.98 36.00Cash on hand 1.75 2.60Other bank balancesBalances with banks - Current accounts* 11.48 25.56Unclaimed dividend accounts 5.30 5.20Deposits having original maturity period of more than three months but less than twelve months – 30.76Margin money depositsTotal672.944,328.63782.576,409.43*being balance in Debt Service Reserve account, not available for use by the company( ` in million)2013 201220. Short-term loans and advances(Unsecured considered good unless otherwise stated)Deposits- Related parties (refer note 40) 37.28 37.28- Others 1.77 12.3439.05 49.62Loans and advances to related parties (refer note 40)- Subsidiaries 412.27 191.95- Other parties 3.90 –416.17 191.95Other loans and advancesAdvances recoverable in cash or in kind 693.17 421.60Balances with government authorities - Indirect taxes 1,341.61 2,537.30Prepaid expense 45.30 49.10Loans and advances to employees 12.38 27.372,092.46 3,035.36Less: Provision for doubtful advancesTotal227.542,320.14198.483,078.45( ` in million)2013 201221. Other current assetsInterest accrued on- Loans to subsidiaries 102.39 248.33- Current investments 295.73 616.13- Fixed deposits 32.96 45.79- Others 20.55 17.80Receivable towards claim 244.51 76.31Dividend receivable from subsidiaries 220.38 –Export benefits receivable 749.22 226.43Assets held for disposal 4.13 8.46Total 1,669.88 1,239.2686
Notes forming part of the Financial Statements22. Revenue from operations( ` in million)2013 2012Sale of Product- Finished goods 56,851.45 49,357.62- Traded goods 9,790.16 7,252.48Other operating revenues (refer note 45) 3,959.41 3,931.29Revenue from operations (gross)70,601.02 60,541.39Less: Excise duty 4,279.37 2,844.27Revenue from operations (net) 66,321.65 57,697.11Details of sale of products under broad headFinished goodsWelded pipes 38,144.78 29,227.10M.S. Plates 8,040.46 14,793.23H.R. Coils 6,359.21 3,097.70Coating 3,032.76 460.97Power 0.15 195.84Steam 1,096.48 786.56Others 177.61 796.2256,851.45 49,357.62Traded goodsH.R. Coils 9,790.169,790.167,252.487,252.48( ` in million)2013 201223. Other incomeInterest from- Subsidiaries 113.57 269.36- Current investments 1,219.25 692.64- Fixed deposits 79.37 133.64- Others 279.08 124.30Profit on sale of tangible assets (net) – 0.10Dividend Income from- Subsidiaries on non-current investment 220.38 –- Current investment 249.46 405.00Profit on sale of current investments 331.08 219.87Profit on sale of non-current investments 234.42 –Miscellaneous income 277.17 347.13Total 3,003.77 2,192.0487
Notes forming part of the Financial Statements24. Cost of materials consumed( ` in million)2013 2012Inventory at the beginning of the year 6,154.42 3,036.61Add: Purchases 37,776.65 40,026.6543,931.07 43,063.26Less: Inventory at the end of the year 2,371.15 6,154.42Total 41,559.92 36,908.84Details of raw materials consumedH.R. Coils 10,247.97 8,260.85H.R. Plates 17,628.10 12,470.24M.S. Slabs 11,799.08 15,129.09Welding and coating materials 1,710.30 842.24Others 174.47 206.43Total 41,559.92 36,908.84( ` in million)2013 201225. Purchases of traded goodsPurchases of traded goods - H.R. Coils 9,207.69 6,853.50Total 9,207.69 6,853.50( ` in million)2013 201226. Changes in inventories of finished goods and goods-in-processInventories at the end of the yearGoods-in-process 2,939.08 1,300.61Finished goods 4,698.54 4,861.077,637.62 6,161.68Inventories at the beginning of the yearGoods-in-process 1,300.61 508.28Finished goods 4,861.07 4,809.846,161.68 5,318.11Total (1,475.94) (843.56)( ` in million)2013 201227. Employee benefits expenseSalaries, wages and bonus 2,008.84 1,562.24Contribution to provident and other funds 93.94 110.23Employee compensation expenses (net) (6.60) (1.51)Staff welfare expenses 100.89 85.14Total 2,197.07 1,756.0988
Notes forming part of the Financial Statements28. Other expenses( ` in million)2013 2012Stores and spares consumed 1,937.48 1,875.35Coating and other Job charges 3,038.73 1,833.60Power, fuel and water charges 1,817.00 1,554.16Freight, material handling and transportation 1,099.22 1,629.53Excise duty on stocks 235.52 2.24Rent 85.86 86.75Rates and taxes 4.60 8.23Repairs and maintenance- Plant and machinery 77.52 150.60- Buildings 18.41 26.36- Others 84.91 40.12Travelling and conveyance expenses 215.68 156.72Communication expenses 23.44 20.37Professional and consultancy fees 283.72 253.84Insurance 96.59 83.02Directors' sitting fees 1.56 1.02Printing and stationery 10.56 11.93Security charges 23.82 21.03Membership and subscription 25.83 14.51Vehicle expenses 20.38 17.65Exchange difference (net) 1,088.64 831.82Auditors remuneration 8.89 7.36Product compensation and claims 3.29 649.39Sales promotion expenses 17.69 30.56Liquidated damages 73.21 192.97Commission and discount on sales 564.22 422.28Provision for doubtful debts and advances (net) 59.72 96.68Bad debts and advances written off 2.18 1.46Provision for diminution in the value of non-current investments 0.80 –Provision for impairment of tangible assets 106.09 –Loss on sale / discard of tangible assets 8.29 –Miscellaneous expenses 106.09 117.17Total 11,139.96 10,136.74( ` in million)2013 201229. Finance costsInterest expense- Term loans 204.13 127.56- Debentures/Bonds 1,999.76 1,602.62- Working capital 44.00 20.87- Others 32.18 14.56Other borrowing costs 708.91 437.29Exchange difference (net) – 268.07Total 2,988.98 2,470.9689
Notes forming part of the Financial Statements30. Micro, Small and Medium EnterprisesDisclosure of amount due to suppliers under "The Micro, Small and Medium Enterprises Development Act, 2006 (MSMED Act)" as at31 March is as under:( ` in million)2013 2012Principal amount due to suppliers under MSMED Act, 2006 2.40 16.98Interest accrued and due to suppliers under MSMED Act, on the above amount 0.19 0.222.59 17.20Payment made to suppliers (Other than interest) beyond the appointed day, during the year 31.34 24.85Interest due and payable to suppliers under MSMED Act, for payments already made 0.31 0.31Interest accrued and remaining unpaid at the end of the year to suppliers under MSMED Act 2.10 1.6031. Foreign exchange differencesa) Loss on account of difference in foreign exchange on realignment/realization and on cancellation of derivative instruments of`1,088.64 million ( `831.82 million) and `Nil ( `268.07 million) is accounted in other expenses and finance costs respectivelyother than (b) below.b) The Companies (Accounting Standards) Amendment Rules 2011 has amended the provision of AS-11 related to "The effects ofchanges in Foreign Exchange Rates" vide notification dated 11 May 2011 (as amended on 29 December 2011 and furtherclarification dated 9 August 2012) issued by the Ministry of Corporate Affairs. Accordingly, the Company has adjusted exchangedifference loss amounting to ` 361.90 million ( ` 695.83 million) to the cost of fixed assets and capital work in progress andexchange difference loss of `648.88 million ( ` 612.53 million) is transferred to "Foreign Currency Monetary Item TranslationDifference Account" to be amortized over the balance period of such long term liabilities. Out of the above, loss of ` 373.50million ( `289.56 million) has been adjusted in the current year and loss of `275.37 million ( `322.97 million) has been carriedover and disclosed in shareholders funds.c) The Company has adopted AS-30 as referred to in Note 1 (i) of the Significant Accounting Policies and accordingly loss of`44.84 million ( `178.18 million) related to foreign exchange difference on Cash Flow Hedges for certain firm commitments andforecasted transactions is recognized in Shareholders’ Funds and shown as Hedging Reserve Account.32. Disclosure of derivative instruments and unhedged foreign currency exposure as at balance sheet date( ` in million)2013 2012Amount Amount Amount AmountHedged Unhedged* Hedged Unhedged*a) In respect of Short-term receivables and payablesi) In respect of Trade receivablesExisting as on the balance sheet date – 720.72 – 4,240.79In respect of future forecasted transactions 631.44 - 904.55 –ii) In respect of Trade payablesExisting as on the balance sheet date 4,437.65 13,688.80 9,475.60 10,540.55In respect of future forecasted transactions – – 1,294.63 –b) In respect of short-term receivables and payablesexisting as on the balance sheet datei) Borrowings 1,813.95 907.73 – 3,569.44ii) Other liabilities or payables – 1,606.24 – 1,101.30iii) Other assets or receivables – 885.62 – 1,354.48c) In respect of long-term receivables and payablesexisting as on the balance sheet datei) Borrowings – 12,581.30 – 12,805.39ii) Other liabilities or payables – 1,764.26 – 2,417.44iii) Other assets or receivables – – – 76.31d) Other derivative Hedge instruments** 13,872.88 – 10,578.75 –Note :*The Net un hedged short term payables/borrowings as on 31 March 2013 is ` 14,596.42 million ( ` 9,616.02 million) resulting in natural hedge againstforeign exchange rate fluctuation.**Other derivative Hedge instruments include Coupon Only Swap for notional Rupee liability of `5,000 million ( `5,000.00 million), Interest Rate Swap fornotional foreign currency liability of US$ 163.45 million equivalent to ` 8,872.88 million (US$ 90.00 million equivalent to ` 4,578.75 million) and CurrencySwap for notional Rupee liability of `Nil ( `1,000.00 million).90
Notes forming part of the Financial Statements(in million)2013 2012Amount in Amount inCross Currency Hedges Foreign ForeignCurrency CurrencyIn respect of short term receivablesEUR / US$ – 1.50In respect of short term payablesEUR / US$ 23.12 37.0033. Contingent liabilities not provided for( ` in million)2013 2012Performance guarantees/Bid bond given by banks to company’s customers /government authorities etc. 15,630.87 18,948.50Corporate guarantees given by the company (includes ` 11,998.22 million ( ` 6,427.23 million)) 18,203.96 12,249.50for Loans/Liabilities taken by the subsidiaries. Loans /Liabilities outstanding against theseguarantees are `1772.89 million ( `3,172.34 million)Letters of credit outstanding (net of liability provided) for company’s sourcing 4,087.02 7,960.46Claims against the Company not acknowledged as debts 450.54 423.66Custom duty on pending export obligation against import of Raw Materials 1,387.25 961.18Disputed direct taxes* 2,009.47 –Disputed indirect taxes** 100.73 74.29*Income tax demands mainly include appeals filed by the Company before appellate authorities against disallowances i.e. depreciation/claims/deductions.The management is of the opinion that its tax disputes will be decided in its favour and no material tax liability is likely to be sustained, hence no provision isconsidered necessary.**Demand notice received during the year for duty evasion of ` 8,609.82 million on account of alleged wrong classification of imported raw materials alongwith penalty of `8,609.82 million and penalty of `205 million on directors and officers of the company. In the opinion of management, without prejudice tooverall merits, in any case ` 6,706.60 million is cenvatable duty which is revenue neutral and may not result into recoverable demand and accordingly relevantamount of penalty may not sustain. The matter is under dispute with appellate authority and thus whole amount of duty and penalty referred above is notconsidered as contingent liability.34. Capital and Other Commitmentsa) Estimated amount of contracts remaining to be executed on capital account (net of advances) is ` 280.26 million( ` 579.94 million)b) Other long-term commitments - `5,250 million ( `3,250 million)c) The company has committed to provide continued need based financial support to subsidiaries / associates.35. Exceptional ItemAdani Welspun Exploration Limited - "AWEL" (joint venture between Welspun Natural Resources Private Limited -"WNRPL" andAdani Enterprises Limited - "AEL") had two blocks in Thailand L39/489 and Thailand L22/50. After initial seismic studies andcarrying out detailed diligence of the drilling prospectivity in the adjacent Blocks, AWEL concluded that it was not prudent to pursuedrilling and decided to relinquish these blocks and abandoned the drilling campaign and pay the cost towards unfinished workprogram. Accordingly, AWEL, has charged off `1,537.6 million being the expenditure on abortive exploration activities on the theseBlocks. Accordingly, the company has charged off its share (representing 35%) of `538.20 million advanced for Thailand project inthese financial.36. Disclosures pursuant to adoption of Accounting Standard 15 (Revised 2005) Employee BenefitsThe Employees gratuity fund scheme managed jointly by Kotak Life Insurance Limited and India First Life Insurance Company Limitedis a defined benefit plan. The present value of obligation is based on actuarial valuation using the projected unit credit method. Theobligation for leave encashment is recognized in the same manner as gratuity.91
Notes forming part of the Financial StatementsDefined benefit planDetails of defined benefit plan of Gratuity (Funded) and Leave Encashment (Non-Funded) are as followsI. Actuarial assumptionsEconomic assumptionsMajor assumptions2013 (%p.a.) 2012 (%p.a.)Discount rate (p.a.) 8.25 8.50Expected return on assets 10.00 7.50Salary escalation rate 5.75 5.75Demographic assumptionsMajor assumptionsMortality Latest Compiled Table of LIC (1994-96)Retirement age60 years for all staff and workers (except Presidents and above retirement age is 62 Years)Attrition rate2% up to age 44 and 1% thereafterII.III.IV.Expenses recognized in the statement of profit and lossPresent value of defined benefit obligation and the fair value of assetsChange in the present value of obligation( ` in million)Gratuity Gratuity Leave Leave(Funded) (Funded) Encashment Encashment(Unfunded) (Unfunded)2013 2012 2013 2012Current service cost 77.00 74.91 45.51 54.46Interest cost 9.15 8.52 3.94 3.89Expected return on plan assets (8.25) (6.74) – –Net actuarial (gain)/loss recognized (61.89) (55.22) (31.56) (39.60)Expenses recognized in the statement of profit and loss 16.02 21.47 17.90 18.75( ` in million)Gratuity Gratuity Leave Leave(Funded) (Funded) Encashment Encashment(Unfunded) (Unfunded)2013 2012 2013 2012Present value of obligation as at 31 March 119.18 99.54 50.83 46.75Fair value of plan assets as at 31 March 119.18 99.54 – –Liability recognized in the balance sheet – – 50.83 46.75( ` in million)Gratuity Gratuity Leave Leave(Funded) (Funded) Encashment Encashment(Unfunded) (Unfunded)2013 2012 2013 2012Present value of obligation as at 1 April 99.54 98.37 46.75 46.15Current service cost 77.00 74.91 45.51 54.46Interest cost 9.15 8.52 3.94 3.89Benefits paid (6.36) (21.96) (13.81) (18.15)Actuarial (gain)/loss on obligations (60.16) (60.30) (31.56) (39.60)Present value of obligation as at 31 March 119.18 99.54 50.83 46.7592
Notes forming part of the Financial StatementsV. Change in fair value of plan assetsNotes:External sales / revenue from operations*Carrying amount of segment assetsCapital expenditureGratuity(Funded)2013 2012Gratuity(Funded)2013 2012Within Outside Total Within Outside TotalIndia India India IndiaNotes:a) Segment revenue in the geographical segments considered for disclosure is as follows:- Revenue within India includes sales to customers located within India.- Revenue outside India includes sales to customers located outside India.b) Segment assets and liabilities include the respective amounts identified to each of the segments and amountsallocated on a reasonable basis.c) Capital expenditure also includes expenditure incurred on capital work-in-progress and capital advances( ` in million)Fair value of plan assets as at 1 April 99.54 98.37Expected return on plan assets 8.25 6.74Actuarial gain/(loss) on plan assets 16.02 (5.09)Contributions (6.36) 21.48Benefits paid 1.73 (21.96)Fair value of plan assets as at 31 March 119.18 99.54i) Amount recognized as an expense and included in Note 27 - Employee benefits expense is: Gratuity ` 16.02 million( `21.47 million) and Leave Encashment Expense of `17.90 million ( `18.75 million)ii)37. Segment reporting"Contribution to provident and other funds” is recognised as an expense in note 27 of the statement of profit and loss.i) The Company is engaged in the business of steel products which in the opinion of the management is considered as theonly reportable business segment in the context of Accounting Standard – 17 on “Segment Reporting”.ii)Information about Secondary-Geographical Segment*Sales within India includes deemed exports of ` 9,505.57 million ( ` 8,472.66 million)38. Payment to Auditors( ` in million)40,555.67 25,765.98 66,321.65 33,209.24 24,487.88 57,697.1196,210.75 7,796.79 104,007.54 99,624.51 10,698.88 110,323.391,523.75 – 1,523.75 3,382.64 – 3,382.64( ` in million)2013 2012Audit fee 5.50 4.25Tax audit fee 1.00 0.75Taxation matters 1.50 1.00Other services (Certification fees) 0.78 1.30Out of pocket expenses 0.11 0.0693
Notes forming part of the Financial Statements39. Operating leaseThe Company leases office, residential facilities, equipment etc. under operating lease agreements that are renewable on a periodicbasis at the option of both the lessor and the lessee. The tenure of lease is generally for eleven months to one twenty months.( ` in million)2013 2012Lease rental charges for the year 85.86 86.75Future lease rental obligations payable(under non-cancelable leases)Not Later than one year 58.25 73.55Later than one year but not later than five years 119.02 256.07Later than five years 0.27 0.9840. Related Party DisclosuresParticulars of Subsidiaries / Associates / Joint VenturesName of the Subsidiaries Nature of Business Country of Extent ofIncorporation HoldingDirect SubsidiariesWelspun Pipes Limited Manufacturer of Steel Pipes India 100% (100%)Welspun Natural Resources Private Limited Oil and Gas Exploration India 100% (100%)Welspun Pipes Inc SPV for Steel Pipes Business United States 100% (100%)of AmericaWelspun Tradings Limited Trading in Steel Products India 100% (100%)Welspun Infratech Limited Infrastructure Development India 100% (100%)Welspun Mauritius Holdings Limited SPV for Steel Pipes Business Mauritius 89.98% (89.98%)Welspun Maxsteel Limited Manufacturer of Sponge Iron India 87.35% (87.35%)Welspun Infra Enterprises Limited (w.e.f. 15 March 2013) Infrastructure Development India 100%(--)Indirect SubsidiariesHeld through Welspun Mauritius Holdings LimitedWelspun Middle East Pipes Company LLC Manufacturer of Steel Pipes Kingdom of 50.01% (50.01%)Saudi ArabiaWelspun Middle East Pipes Coating Company LLC Coating of Pipes Kingdom of 50.01% (50.01%)Saudi ArabiaWelspun Middle East DMCC Marketing Company Dubai, UAE 100% (100%)Held through Welspun Pipes Inc.Welspun Tubular LLC Manufacturer of Steel Pipes United States 100% (100%)of AmericaWelspun Global Trade LLC Marketing Company United States 100% (100%)of AmericaHeld through Welspun Natural Resources Private LimitedWelspun Plastics Private Limited Oil and Gas Exploration India 100% (100%)Held through Welspun Infratech LimitedWelspun Projects Limited Infrastructure Development India 61.12% (61.12%)Welspun Road Projects Private Limited Infrastructure Development India 100% (100%)Welspun Infra Projects Private Limited Infrastructure Development India 60% (60%)ARSS Bus Terminal Private Limited Infrastructure Development India 49% (45%)Held through Welspun Projects LimitedAnjar Road Private Limited Infrastructure Development India 100% (100%)Welspun BOT Projects Private Limited Infrastructure Development India 100% (100%)MSK Projects (Himmatnagar Bypass) Private Limited Infrastructure Development India 100% (100%)MSK Projects (Kim Mandavi Corridor) Private Limited Infrastructure Development India 100% (100%)94
Notes forming part of the Financial Statements40. Related Party Disclosures (Contd.)Name of the Subsidiaries Nature of Business Country of Extent ofIncorporation HoldingHeld through Welspun Infra Projects LimitedWelspun Energy Transportation Private Limited Infrastructure Development India 100% (100%)Welspun Water Infrastructure Private Limited Infrastructure Development India 100% (100%)Associate CompaniesRed Lebondal Limited SPV for Steel Pipe Marketing Cyprus 25% (25%)Welspun Energy Limited* Power Generation India 26% (26%)Welspun Captive Power Generation Limited Power Generation India 24% (15%)(w.e.f 26 December 2012)Joint VenturesDahej Infrastructure Private Limited (Up to 20 March 2013) Development of Jetty India --- (50%)Indirect Joint VenturesHeld through Welspun Natural Resources Private LimitedAdani Welspun Exploration Limited Oil and Gas Exploration India 35% (35%)Held through Welspun Infra Projects Private Limited#Leighton Welspun Contractors Private Limited Infrastructure Development India 32.38% (35.00%)Held through Welspun Projects LimitedDewas Bhopal Corridor Limited Infrastructure Development India 50% (50%)Bul MSK Infrastructure Private Limited Infrastructure Development India 50% (50%)Note:#Welspun Projects Limited acquired 7.50% stake in Leighton Welspun Contractors Private Limited (w.e.f. 28 March 2013) and with this Welspun InfratechLimited together holds 39.88% in Leighton Welspun Contractors Private Limited.*Direct and Indirect subsidiaries of Welspun Energy Limited (an associate company): Welspun Energy Madhya Pradesh Limited, Welspun Energy AnuppurPrivate Limited, Welspun Energy UP Private Limited, Welspun Urja India Limited, Welspun Energy Chattisgarh Limited, Welspun Renewables Energy Limited,Welspun Urja Gujarat Private Limited.,Welspun Energy Meghalaya Private Limited, Welspun Energy Jharkhand Private Limited, Welspun Energy OrissaPrivate Limited, Welspun Energy Resources Private Limited, Welspun Solar Park Private Limited, Welspun Energy Park Private Limited, Welspun Solar TechPrivate Limited, Welspun Energy Maharashtra Private Limited, Welspun Energy Rajasthan Private Limited, Solarsys Renewable Energy Private Limited,Welspun Solar Madhya Pradesh Private Limited, Welspun Solar Rajasthan Private Limited, Welspun Solar Punjab Private Limited, Welspun Solar UP PrivateLimited, Welspun Solar AP Private Limited, Unity Power Private Limited, Northwest Energy Private Limited, Dreisatz Mysolar24 Private Limited, SUILHydroPower Private Limited, MI Mysolar24 Private Limited, Solarsys Energy Private Limited, Welspun Solar Kannada Private Limited.Other related parties with whom transactions have taken place during the year and balances outstanding as on the last day ofthe year.Welspun India Limited, Welspun Steel Limited, Remi Metals Gujarat Limited, Welspun Retail Limited, Welspun Anjar SEZ Limited,Welspun Foundation for Health and Knowledge, Welspun Syntex Limited, Vipuna Trading Limited, Welspun Logistics Limited,Welspun Realty Private Limited, Welspun Enterprises (Cyprus) Limited, Welspun Global Brands Limited, Welspun UK Limited,Welspun Marine Logistics LimitedDirectors / Key Management PersonnelNature of RelationshipB. K. Goenka Chairman^R. R. Mandawewala Director*Braja MishraManaging Director**^Executive Chairman upto 13 August 2012*Managing Director upto 26 April 2012**Appointed w.e.f. 26 April 201295
Notes forming part of the Financial StatementsA. Transactions with related parties for the yearSale of goods, services and recoveriesSale of fixed assetsInterest and other income receivedDividend receivedPurchase of goods and servicesPurchase of fixed assetsRent and license fees paidDonationsReimbursement of expenses paid (Net)Directors remunerationLoans, advances and deposits givenLoans, advances and deposits given repaid/adjustedInvestment in sharesInvestment in Optionally Convertible DebenturesSale of sharesShare application money givenShare application money given repaid / adjusted( ` in million)Subsidiaries Associate/ Other Key TotalJoint Related ManagementVenture Parties Personnel36,846.43 21.72 1,678.71 – 38,546.8516,790.16 151.36 1,379.64 – 18,321.16155.73 – 4.84 – 160.5727.97 – 0.48 – 28.44113.57 – 0.44 – 114.01269.36 – 0.41 – 269.77220.38 – – – 220.38– – – – –125.67 238.04 71.03 – 434.75730.04 – 80.88 – 810.93290.40 – – – 290.40– – – – –– – 67.72 – 67.72– – 72.16 – 72.16– – 80.75 – 80.75– – 22.65 – 22.651,186.77 – 69.41 – 1,256.18299.90 – 51.68 – 351.58– – – 154.42 154.42– – – 31.05 31.054,376.34 – – – 4,376.341,509.93 – 72.91 – 1,582.842,694.11 – – – 2,694.111,357.58 – – – 1,357.583,334.02 799.56 – – 4,133.579,007.27 260.01 – – 9,267.281,398.90 – – – 1,398.901,500.00 – – – 1,500.00– – 0.06 – 0.060.13 – – – 0.132,581.03 8.00 – – 2,589.032,733.55 2,594.77 215.00 – 5,543.324,777.68 881.21 – – 5,658.89437.63 2,003.40 150.00 – 2,591.0396
Notes forming part of the Financial StatementsB. Closing balances as at 31 March 2013Loans, advances and deposits givenCorporate guarantees givenInvestments in sharesInvestment in optionally convertible debenturesShare application moneyTrade receivablesInterest receivableTrade payables* [ `2,374 ( `2,374)]Dividend receivable*Denotes figures less than ` 10,000.( ` in million)Subsidiaries Associate/ Other Key TotalJoint Related ManagementVenture Parties Personnel2,031.22 – 350.78 – 2,382.001,381.53 – 388.38 – 1,769.9111,998.22 6,204.28 1.46 – 18,203.966,427.23 4,999.30 822.97 – 12,249.5014,220.04 1,110.15 0.77 – 15,330.9611,531.03 267.82 0.77 – 11,799.624,228.90 – – – 4,228.902,830.00 – – – 2,830.00610.59 21.55 – – 632.142,807.24 699.76 195.00 – 3,702.005,667.50 0.00 27.06 – 5,694.562,760.50 – 14.54 – 2,775.03102.39 – – – 102.39175.04 – – – 175.041.48 26.94 19.85 – 48.26– 0.00 3.20 – 3.20220.38 – – – 220.38– – – – –Disclosure in respect of transactions which are more than 10% of the total Transactions of the same type with related partiesduring the year:i Sale of goods / services and recoveries - Welspun Tradings Limited ` 26,642.57 million ( ` 8,701.43 million), WelspunTubular LLC `9,842.28 million ( `7,703.42 million)ii Sale of fixed assets - Welspun Tubular LLC `153.08 million ( `27.97 million)iii Interest and other income includes - Interest received from Welspun Natural Resources Private Limited ` 111.77 million( `73.29 million), Interest received from Welspun Infratech Limited `Nil ( `196.07 million)iv Dividend received - Welspun Pipes Inc - `220.38 million ( `Nil)v Purchase of goods and services - Welspun Tubular LLC ` 124.05 million ( ` 561.94 million), Welspun Projects Limited`Nil ( `167.34 million), Welspun Steel Limited `7.89 million ( `24.73 million), Welspun Logistics Limited `54.74 million( ` 50.20 million), Welspun Tradings Limited ` 1.06 million ( ` 0.76 million), Welspun Captive Power Generation Limited`238.04 million ( `Nil)vi Purchase of fixed assets - Welspun Projects Limited `290.34 million ( `Nil)vii Rent paid - Welspun Realty Private Limited `58.99 million ( `65.03 million)viii Donation paid - Welspun Foundation for Health and Knowledge ` 80.75 million ( ` 22.65 million) (meant for CorporateSocial Responsibility activities)ix Reimbursement of expenses (net) - Welspun India Limited ` Nil ( ` 42.66 million), Welspun Tubular LLC ` Nil( `281.13 million), Welspun Tradings Limited `1,186.56 million ( `Nil).x Loans, advances and deposits given - Welspun Natural Resources Private Limited ` 1,333.36. million ( ` 424.45 million),Welspun Maxsteel Limited `Nil ( `1,085.48 million), Welspun Pipes Inc `271.43 million ( `Nil), Welspun Tradings Limited`2,721.72 million ( `Nil)xi Loans, advances and deposits given repaid / adjusted - Welspun Natural Resources Private Limited ` 932.06 million( ` 272.10 million), Welspun Maxsteel Limited ` Nil ( ` 1,085.48 million), Welspun Tradings Limited ` 1,762.05 million( ` Nil)97
Notes forming part of the Financial Statementsxii Investment in shares of - Welspun Maxsteel Limited `37.40 million ( `8,042.17 million), Welspun Infratech Limited `Nil( ` 920 million) converted out of Optionally Convertible Debentures, Welspun Mauritius Holdings Limited ` 3,296.62million ( ` 0.10 million), Investment in Optionally Convertible Debentures issued by Welspun Infratech Limited ` 1,398.90million ( `1,500 million), Welspun Energy Limited - `699.76 million ( `260.01 million)xiii Sale of investments in Dahej Infrastructure Private Limited to Welspun Marine Logistics Limited - `0.06 million ( `Nil)xiv Share application money given - Welspun Energy Limited ` Nil ( ` 2,594.77 million), Welspun Infratech Limited ` 706.56million ( `1,126.55 million), Welspun Mauritius Holdings Limited `1837.07 million ( `1,513.40 million), Welspun NaturalResources Private Limited `Nil ( `45 million)xv Share application money given includes repaid / adjusted by - Welspun Energy Limited ` 699.76 million ( ` 2,003.40million), Welspun Infratech Limited ` 1,421.66 million ( ` 411.35 million), Welspun Natural Resources Private Limited`Nil ( `45 million), Welspun Mauritius Holding Limited `3,296.62 million ( `Nil)Disclosure of Closing balances as at 31 March 2013i Loans, advances and deposits - Welspun Logistics Limited `52.40 million ( `52.40 million), Welspun Realty Private Limited` 284.48 million ( ` 320.48 million), Welspun Natural Resources Private Limited ` 1,583.57 million ( ` 1,116.32 million),Welspun Pipes Inc `271.43 million ( `Nil)ii Guarantees and collaterals given - Welspun Pipes Inc ` 1,628.55 million ( ` 4,070 million), Welspun Urja Private Limited` 1,709.30 million ( ` 1,709.30 million), Welspun Middle East Pipes Company LLC ` 5,357.31 million ( ` 2,035 million),Welspun Energy Limited `1,270 million ( `1,270 million), Adani Welspun Exploration Limited `2,624.98 million ( `1,470million), Welspun Tradings Limited `4,668.51 million ( `Nil)iii Investments held - Welspun Infratech Limited `1,920.85 million ( `1,920.85 million), Welspun Maxsteel Limited `8,079.57million ( ` 8,042.17 million), Welspun Pipes Inc. ` 0.44 million ( ` 645.94 million), Welspun Mauritius Holdings Limited` 3,981.36 million ( ` 684.74 million), Welspun Infratech Limited - Optionally Convertible Debentures ` 4,228.90 million( ` 2,830 million)iv Share application money given - Welspun Energy Limited `Nil ( `699.76 million), Welspun Infratech Limited `0.10 million( ` 715.20 million), Welspun Pipes Limited ` 556.64 million ( ` 578.64 million), Welspun Mauritius Holdings Limited`53.85 million ( `1,513.40 million), Welspun Captive Power Generation Limited `21.55 million ( `195.00 million)v Trade receivables - Welspun Tubular LLC `214.06 million ( `1,140.97 million), Welspun Tradings Limited `5,031.14 million( ` 1,555.82 million).vi Interest receivable from Welspun Natural Resources Private Limited - `100.59 million ( `65.96 million)vii Trade payables - Welspun India Limited ` 19.35 million ( ` 0.63 million), Welspun Retail Limited ` 0.47 million ( ` 2.57million), Welspun Captive power Generation Limited `26.93 million ( `Nil)viii Dividend receivable - Welspun Pipes INC. - `220.38 million ( `Nil)vii Directors Remuneration( ` in million)Name Relation 2013 2012B. K. Goenka Chairman^ 15.58 11.78R. R. Mandawewala Director* 0.83 10.00Braja Mishra Managing Director** 138.01 –M. L. Mittal Executive Director Finance^^ – 5.60Asim Chakraborty#Whole Time Director – 3.67Total 154.42 31.05^Executive Chairman upto 13 August 2012*Managing Director upto 26 April 2012 **Appointed w.e.f. 26 April 2012^^Resigned w.e.f 30 September 2011#Resigned from Directorship w.e.f. 4 October 201198
Notes forming part of the Financial Statements41. Disclosure pursuant to Clause 32 of the listing agreement :Loans and advances in the nature of loans to subsidiaries:42. Conversion and Issue of Optionally Convertible Debentures (OCD) by Welspun Infratech Limited43. Net dividend remitted in foreign exchange44. Earnings Per Share (EPS)45. Other operating revenues( ` in million)- Welspun Natural Resources Private Limited 1583.57 1116.32 1955.74 1283.61- Welspun Plastic Private Limited 35.38 – 35.38 –– Welspun Pipes Inc 271.43 – 271.43 –During the year, Welspun Infratech Limited (a wholly owned subsidiary of the company) has further allotted 13,989 (15,000) OCDs of`100,000 each amounting to `1,398.90 million ( `1,500 million). The tenure of OCDs is five years and carries interest @ 11% p.a.from April 2015 onwards and are redeemable at a premium of 5%. The company has the option to convert the said OCDs into equityshares at any time within three years as per the terms of the issue.Period to which it relates 2011 - 2012 2010 - 2011Number of non-resident shareholders 23 27Number of equity shares held on which dividend was due 22,119,265 22,123,395Amount remitted ( ` in million) 11.06 44.24I) Profit after tax for diluted EPS ( ` in million)II) Weighted average number of equity shares for EPS computation530.86 649.38a) For Basic EPS (Nos) 231,836,824 219,028,187b) For Diluted EPS (Nos)* 231,836,824 219,028,187III) EPS on Face Value of ` 5 eachBalance as on 31 MarchMaximum amountoutstanding duringthe year2013 2012 2013 2012Year of remittance (ending on) 2013 20122013 2012Basic and Diluted ( `)* 2.29 2.96*Foreign currency convertible bonds, Compulsory convertible debentures and Employee stock options plan are anti dilutive and ignored in the calculation ofdiluted earnings per share.( ` in million)2013 2012Scrap sales 1,262.78 1,308.44Value added tax incentive 1,359.68 670.30Export benefits 977.02 480.50Excess provisions written back – 1,135.91Others 359.93 336.14Total 3,959.41 3,931.2999
Notes forming part of the Financial Statements46. Remuneration paid or provided in accordance with section 198 of the Companies Act, 1956 to the Directors is as under:( ` in million)Salaries and Allowances 3.71 131.34 – 10.00 10.00 9.01Commission 11.87 – – 1.78 – –Perquisites / Contribution to Provident Fund – 7.50 – – – 0.2647. Value of raw materials consumedImported 33,873.23 81.50 28,145.94 76.26Indigenous 7,686.69 18.50 8,762.90 23.7448. Value of stores and spares consumed2013 2012Chairman Managing Whole Time Executive Managing Whole TimeDirector* Directors Chairman Director DirectorsTotal 15.58 138.84 – 11.78 10.00 9.27*Remuneration paid to Managing Director has turned out to be in excess of the limits specified u/s 198 read with Schedule XIII of the Companies Act, 1956by `78.67 million ( `Nil) due to inadequate profit during the year. The approval of Company's application to the Central Government for excess remunerationis awaited.2013 2012`in million % of `in million % ofConsumptionConsumptionTotal 41,559.92 100.00 36,908.84 100.002013 2012`in million % of `in million % ofConsumptionConsumptionImported 228.47 11.79 201.06 10.72Indigenous 1,709.01 88.21 1,674.29 89.28Total 1,937.48 100.00 1,875.35 100.0049. Value of imports on CIF basis in respect of( ` in million)2013 2012Raw materials 28,884.68 32,854.05Capital goods 51.36 2,286.95Stores and spares 295.61 567.70Traded goods 9,296.01 6,826.59Coal 576.93 778.2450. Expenditure in foreign currency( ` in million)2013 2012Freight, material handling and transportation expenses 534.90 1,102.64Membership and other fees 8.12 17.52Sales commission (net) 521.37 320.35Finance cost (including bank charges) 1,339.96 745.74Professional and consultancy fees 75.88 153.77Coating and other Job work charges 2,533.62 1,583.59Others 98.54 80.91100
Notes forming part of the Financial Statements51. Earnings in foreign exchange52. Disclosure in respect of Joint Ventures54.( ` in million)2013 2012FOB value of exports (including goods-in-transit) 20,993.22 25,243.00Job work and other charges 5,808.89 1,053.84In compliance with Accounting Standard 27 on "Financial Reporting of Interest in Joint Ventures", the company's share of each of theassets, liabilities, income and expenses, etc. in respect of jointly controlled entities are as follows:Name of Joint Venture Description of Interest Country of Incorporation Ownership InterestDahej Infrastructure Private Limited (DIPL) Jointly Controlled Company India 50%up to 20 March 2013Company's Share of Interest in Dahej Infrastructure Private Limited( ` in million)2013 2012Assets – 0.85Liabilities – 0.85Income – –Expense – 6.2553. The company had collected VAT of ` 368.75 million on sales in earlier years which was not paid to VAT authorities and shown asliabilities, claiming it within VAT incentive limit and VAT authorities disputed the sanctioned claim. During the year, claim ofthe company is accepted in assessment order of earlier years by VAT authorities; hence the VAT collected is accounted asincome and reported under other operating revenues.The company has been getting export/domestic orders and executing those orders through one of its subsidiaries. The realisation,income/benefits/claims, or expenses relating to such transactions i.e. risks and reward of these transactions are all on company'saccount, hence the said subsidiary is allowed to retain a small percentage as profit of turnover.55.Miscellaneous expenses include donation of ` 0.05 million paid during the year to a political party named "Bharatiya Janata Party".56.57.The international transactions with Associated Enterprises (AE's) are at arm's length price as per the independent accountantsreport for the year ended 31 March 2012. Further, the Finance Bill, 2012 had sought to bring in certain class of domestic transactionsin the ambit of the transfer pricing regulations with effect from 1 April 2012. The Management is of the opinion that its internationaltransactions with AE's and the specified domestic transactions for the year are at arm's length price and will not have any impact onthe amount of tax expense and provision of taxation in these financials.Previous years figure have been regrouped / reclassified wherever necessary to correspond with current years classifications /disclosures.As per our attached report of even dateFor MGB & Co.Chartered AccountantsFor and on behalf of the BoardB.K.GoenkaChairmanBraja MishraManaging DirectorFirm Registration Number 101169WJeenendra Bhandari B.R.Jaju Pradeep JoshiPartner Chief Financial Officer Company SecretaryMembership Number 105077Mumbai, 30 May 2013101
Cash flow statement for the year ended 31 March( ` in million)2013 2012A) Cash flow from operating activitiesProfit before tax (after exceptional item) 879.64 763.07Adjustments forDepreciation and amortisation expense 2,289.91 1,843.52Interest expense 2,280.07 1,765.60Interest income (1,691.27) (1,219.94)(Profit)/Loss on sale/discard of fixed assets (net) 8.29 (0.10)Provision for impairment of tangible assets 106.09Profit on sale of investments (net) (331.08) (219.87)Dividend income (469.83) (405.00)Provision for doubtful debts and advances (net) 57.11 96.02Provision for diminution in value of non current investments 0.80Employee compensation expenses (net) (6.60) (1.51)Exchange adjustments (net) (235.50) 1,331.96Operating profit before working capital changes 2,887.62 3,953.75Adjustments forTrade and other receivables 1,341.41 (2,470.29)Inventories 1,756.65 (3,342.15)Trade and other payables (6,349.55) 10,379.61Cash generated from operations (363.87) 8,520.91Direct taxes paid (net of refunds) (147.44) (253.06)Net cash from/(used in) operating activities (A) (511.31) 8,267.86B) Cash flow from investing activitiesPurchase of fixed assets (including capital work in progress) (1,309.20) (2,598.43)Sale of fixed assets (net) 7.45 28.20Purchase of long term investmentsSubsidiaries (9,587.29)Others (1,233.25) (260.01)Sale of long term investments Subsidiaries 0.13Sale of long term investments Joint Venture 0.06Sale / (Purchase) of current investments (net) 2,802.75 (6,268.94)(Increase)/decrease in share application money given toSubsidiaries (610.59) (2,250.92)Others (21.55) (396.36)Loans given to subsidiaries (502.63) (1,509.93)Loans given repaid by subsidiaries 1,357.58Dividend received 249.46 405.00Interest received 2,167.68 543.19Net cash from/(used in) investing activities (B) 1,550.18 (20,537.78)C) Cash flow from financing activitiesProceeds from issue of equity shares (including securities premium) (Refer note 2) 10.27 5,079.47Proceeds from issue of debentures (net of issue expenses) 3,371.60 7,883.75Redemption of debentures (1,700.00)Repurchase of foreign currency convertible bonds (3,484.94)Proceeds from long term borrowings 5,498.00Repayment of long term borrowings (2,611.70) (16.69)Increase/(decrease) in short term borrowings (net) (1,750.25) 1,549.17Interest paid (2,320.18) (1,506.01)Dividend paid (including corporate dividend tax) (132.47) (475.07)Net cash from/(used in) financing activities (C) (3,119.67) 12,514.65Net changes in cash and bank balances (A+B+C) (2,080.80) 244.73Cash and bank balances at the beginning of the year 6,409.43 6,164.70Cash and bank balances at the end of the year 4,328.63 6,409.43Note: 1. Cash and bank balances at the end of the year include unrealised loss of ` 8.76 million (Unrealized profit of ` 29.11 million) which is on account ofrealignment of current account/fixed deposits held in foreign currency.2. During the year, conversion of compulsorily convertible debentures of ` 7,883.75 million into equity shares and allotment of equity shares against shareapplication money of ` 3,702.00 million by subsidiaries / associates is not considered in the above statement being non cash transaction.3. Cash and bank balances include `689.72 million ( `844.09 million) which is not available for use by the company.4. Previous year figures have been regrouped/recast wherever necessary.As per our attached report of even dateFor and on behalf of the BoardFor MGB & Co. B.K.Goenka Braja MishraChartered Accountants Chairman Managing DirectorFirm Registration Number 101169WJeenendra Bhandari B.R.Jaju Pradeep JoshiPartner Chief Financial Officer Company SecretaryMembership Number 105077Mumbai, 30 May 2013102
Statement Pursuant to Section 212 of the Companies Act, 1956, related to Subsidiary CompaniesName of the Subsidiary Company Welspun Welspun Welspun Welspun Welspun Welspun Welspun Welspun Welspun Welspun Welspun MSK MSK Welspun Welspun Welspun ARSS Bus Welspun Anjar Welspun Welspun Welspun Welspun WelspunNatural Plastics Maxsteel Pipes Inc. Tubular Global Pipes Ltd. Tradings Infratech Road Projects Projects Projects Infra Energy Water Terminal Bot Road Mauritius Middle Middle Middle InfraResources Pvt. Ltd. Ltd. LLC Trade LLC Ltd. Ltd. Projects Ltd. (Himmat- (KIM Projects Transpor- Infra- Pvt. Ltd. Project Pvt. Ltd. Holdings East East East Enter-Pvt. Ltd. Pvt. Ltd. nagar) Mandavi Pvt. Ltd. tation structure Pvt. Ltd. Ltd. DMCC Pipes Pipes prisesBypass) Corridor) Pvt. Ltd. Pvt. Ltd. Coatings Company Ltd.Pvt. Ltd. Pvt. Ltd. Co. LIC LICFinancial Year of the Subsidiary 31st March 31st March 31st March 31st March 31st March 31st March 31st March 31st March 31st March 31st March 31st March 31st March 31st March 31st March 31st March 31st March 31st March 31st March 31st March 31st March 31st March 31st March 31st March 31st Marchended on 2013 2013 2013 2013 2013 2013 2013 2013 2013 2013 2013 2013 2013 2013 2013 2013 2013 2013 2013 2013 2013 2013 2013 2013Shares of the Subsidiary Company heldon the above Date and Extent of Holding(i) Equity shares 18,75,000 ---- 113,622,058 1,001 ---- ---- 50,000 50,13,402 4,86,39,899 ---- ---- ---- ---- ---- ---- ---- ---- ---- ---- 1,02,089 ---- ---- ---- 50,000equity equity Common equity equity equity equity equityshares of shares of Stock of shares of shares of shares of shares of shares of`10 each `10 each US$ 1 `10 each `10 each `10 each US$ 1 each ` 10 eachNet aggregate amount of Profit/(Losses)of subsidiary for the above financialyear so far as they concern membersof the CompanyNet aggregate amount of Profit/(Losses)for previous financial year thesubsidiary as far as it concern themembers of the Company.par valueeach(ii) Preference Stock ---- ---- 3,740,000 ---- ---- ---- ---- ---- ---- ---- ---- ---- ---- ---- ---- ---- ---- ---- ---- 80,009,968 ---- ---- ---- ----Preference PreferenceShares of Shares of` 10 each US$ 1 each(ii) Extent of holding / Control 100% 100% 87.35% 100% 100% 100% 100% 100% 100% 100% 61.12% 100% 100% 60% 100% 100% 45% 100% 100% 89.98% 100% 50.01% 50.01% 100.00%(i) Dealt with in the accounts of theCompany for the year ended31 March 2013 ( ` million)(ii) Not dealt with in the accounts of (0.14) (0.02) (1,752.74) 25.13 276.68 9.72 – 63.97 – – 33.39 1.91 (3.56) – – – – – – (234.46) (9.18) 0.20 90.47 0.00the Company for the year ended31 March 2013 ( ` million)(i) Dealt with in accounts ofthe Company.(ii) Not dealt with in the accounts – (0.21) (763.62) 92.44 2,192.76 5.62 – 27.58 – – 13.12 5.01 5.94 – – – – – – 28.98 (10.94) (93.21) (70.41) 0.00of the Company.(1)(1) Became Subsidiary w.e.f. 15 March 2013For and on behalf of the BoardB.K.GoenkaChairmanBraja MishraManaging DirectorB.R.JajuChief Financial OfficerPradeep JoshiCompany Secretary103
Independent Auditors' ReportTo,The Board of Directors ofWelspun Corp LimitedReport on the Consolidated Financial Statements1. We have audited the accompanying consolidated financial statements of Welspun Corp Limited (“the Company”), its subsidiaries,jointly controlled entities and associate companies (collectively referred to as “the Group”) which comprise the ConsolidatedBalance Sheet as at 31 March, 2013, the Consolidated Statement of Profit and Loss and the Consolidated Cash Flow Statement forthe year then ended and a summary of significant accounting policies and other explanatory information.Management's Responsibility for the Consolidated Financial Statements2. Management is responsible for the preparation of these consolidated financial statements that give a true and fair view of theconsolidated financial position, consolidated financial performance and consolidated cash flows of the Group in accordance withaccounting principles generally accepted in India. This responsibility includes the design, implementation and maintenance ofinternal control relevant to the preparation and presentation of the consolidated financial statements that give a true and fair viewand are free from material misstatement, whether due to fraud or error.Auditor's Responsibility3. Our responsibility is to express an opinion on these consolidated financial statements based on our audit. We conducted our audit inaccordance with the Standards on Auditing issued by the Institute of Chartered Accountants of India. Those Standards require thatwe comply with ethical requirements and plan and perform the audit to obtain reasonable assurance about whether theconsolidated financial statements are free from material misstatement.4. An audit involves performing procedures to obtain audit evidence about the amounts and disclosures in the consolidated financialstatements. The procedures selected depend on the auditor's judgment, including the assessment of the risks of materialmisstatement of the consolidated financial statements, whether due to fraud or error. In making those risk assessments, the auditorconsiders internal control relevant to the Group's preparation and presentation of the consolidated financial statements that give atrue and fair view in order to design audit procedures that are appropriate in the circumstances. An audit also includes evaluating theappropriateness of accounting policies used and the reasonableness of the accounting estimates made by management, as well asevaluating the overall presentation of the consolidated financial statements.5. We did not audit the financial statements of certain subsidiaries and jointly controlled entities of the Group whose financialstatements reflect revenue of ` 66,516 Million and total assets of ` 63,186 Million for the year then ended. These financialstatements have been audited by other auditors. Our opinion in so far as it relates to the amounts included in respect of thesesubsidiaries and jointly controlled entities is based solely on the reports of such other auditors which have been furnished to us.6. The financial statements of an associate have been audited by other auditor whose report has been furnished to us. The profit ofsuch associate considered for consolidation is ` Nil.7. The financial statements of two subsidiaries and two jointly controlled entities with Group's share of revenue of ` 369 Million andtotal assets of `2,994 Million and Group's share of `38 Million in the loss of two associates have been consolidated based on themanagement accounts and therefore unaudited.8. We believe that the audit evidence we have obtained is sufficient and appropriate to provide a basis for our audit opinion.Opinion9. In our opinion and to the best of our information and according to the explanations given to us, and based on consideration of thereports of other auditors on the financial statements / consolidated financial statements of the subsidiaries, jointly controlledentities and associate companies, the consolidated financial statements give a true and fair view in conformity with the accountingprinciples generally accepted in India:(a) in the case of the Consolidated Balance Sheet, of the state of affairs of the Group as at 31 March, 2013;(b)(c)in the case of the Consolidated Statement of Profit and Loss, of the Loss of the Group for the year ended on that date; andin the case of the Consolidated Cash Flow Statement, of the cash flows of the Group for the year ended on that date.104
Emphasis of Matter10. We draw attention to:(a)(b)Note 45 relating to remuneration paid/ provided in respect of Managing Director of the Company, which turned out to be inexcess of the limits prescribed under Section 198 read with Schedule XIII to the Act, due to inadequate profit, hence is subject tothe approval of the Central Government.In respect of an Indian subsidiary:i) Note 35(c) the expansion project of sponge iron being put on hold due to pending regulatory approvals and non availabilityof key raw material (Natural Gas) at economical rates. Accordingly, project related expenses ` 493.99 Million incurredduring the year are expensed in the statement of profit and loss as exceptional items.ii)Note 43(a) operations of the said subsidiary adversely affected due to non availability of allocated key raw material (NaturalGas) at economical ratesiii) Note 43 (b) revaluation of major fixed assets of subsidiary by ` 6,564.12 Million based on the valuation report issued by aregistered valuer.iv) Note 43(c) no adjustments made for arbitration award for forfeiture of capital advance of ` 1,476.00 Million and otherclaims of ` 57.15 Million, as the said subsidiary is exploring various options, subject to legal opinion, to challenge theaward.Our opinion is not qualified in respect of these matters.For MGB & CoChartered AccountantsFirm Registration Number 101169WJeenendra BhandariPartnerMembership Number 105077Mumbai, 30 May 2013105
Consolidated Balance Sheet as at 31 MarchNotes 2013 2012( ` in million)EQUITY AND LIABILITIESShareholders' fundsShare capital 2 1,314.74 1,138.91Reserves and surplus 3 55,262.91 39,793.7956,577.65 40,932.70Compulsorily convertible debentures 2 (e) – 7,883.75Minority interest 3,546.03 3,432.72Non-current liabilitiesLong-term borrowings 4 49,530.77 39,714.21Deferred tax liabilities (net) 5 (a) 5,599.91 5,036.11Other long-term liabilities 6 2,271.00 3,405.39Long-term provisions 7 250.72 244.2257,652.40 48,399.92Current liabilitiesShort-term borrowings 8 2,043.41 7,773.27Trade payables 9 30,379.65 32,923.01Other current liabilities 10 17,370.54 14,885.24Short-term provisions 11 1,343.93 1,812.2551,137.52 57,393.77Total 168,913.59 158,042.86ASSETSNon-current assetsFixed assets 12- Tangible assets 64,197.10 52,581.13- Intangible assets 233.31 281.20- Build, Operate and Transfer (BOT) 5,127.33 4,491.38- Intangible assets under development 188.62 80.47- Goodwill on consolidation 10,655.83 9,887.86- Capital work-in-progress 5,275.84 6,190.89Non-current investments 13 1,177.63 354.63Deferred tax Assets (net) 5 (b) 88.30 65.98Long-term loans and advances 14 4,452.08 5,132.17Other non-current assets 15 327.90 357.0691,723.94 79,422.76Current assetsCurrent investments 16 17,493.59 19,430.62Inventories 17 25,668.82 25,632.42Trade receivables 18 17,614.02 15,259.93Cash and bank balances 19 7,043.74 10,255.37Short-term loans and advances 20 5,500.23 5,809.50Other current assets 21 3,869.24 2,232.2677,189.64 78,620.10Total 168,913.59 158,042.86Notes forming part of the consolidated financial statements 1 - 46As per our attached report of even dateFor and on behalf of the BoardFor MGB & Co. B.K.Goenka Braja MishraChartered Accountants Chairman Managing DirectorFirm Registration Number 101169WJeenendra Bhandari B.R.Jaju Pradeep JoshiPartner Chief Financial Officer Company SecretaryMembership Number 105077Mumbai, 30 May 2013106
Consolidated Statement of Profit and Loss for the year ended 31 MarchNotes 2013 2012( ` in million)RevenueRevenue from operations (gross) 22 113,956.77 93,447.32Less: Excise duty 5,256.27 3,681.56Revenue from operations (net)108,700.50 89,765.76Other income 23 3,110.40 2,675.84Total 111,810.90 92,441.60ExpenditureCost of materials consumed 24 71,100.56 61,247.38Purchases of traded goods 25 144.06 378.37Changes in inventories of finished goods, work/goods in process 26 501.46 (2,714.65)Employee benefit expenses 27 6,074.79 4,875.68Other expenses 28 23,701.00 17,408.42Total 101,521.87 81,195.20Profit before finance costs, depreciation/amortization and tax 10,289.04 11,246.40Less: Depreciation and amortization expense 12 4,761.21 3,515.23Finance costs 29 4,930.77 3,999.24Profit before exceptional items and tax 597.06 3,731.92Less: Exceptional Items 35 1,090.87 –Profit / (Loss) before tax (493.81) 3,731.92Less: Tax expense- Current tax - current year 4.83 1,224.61- Earlier years 42.36 31.45- MAT credit entitlement (133.99) (44.91)- Deferred tax 477.11 291.62Profit / (Loss) after tax before minority interest and share of results of associates (884.12) 2,229.15Add / (Less) : Share of profit/(loss) from associates (37.96) 14.38Add / (Less) : Minority interest 218.85 141.90Profit / (Loss) for the Year (703.23) 2,385.43Earnings per share of `5 each fully paid-up (in `) 40- Basic (3.03) 10.89- Diluted (3.03) 9.71Notes forming part of the consolidated financial statements 1 - 46As per our attached report of even dateFor and on behalf of the BoardFor MGB & Co. B.K.Goenka Braja MishraChartered Accountants Chairman Managing DirectorFirm Registration Number 101169WJeenendra Bhandari B.R.Jaju Pradeep JoshiPartner Chief Financial Officer Company SecretaryMembership Number 105077Mumbai, 30 May 2013107
Notes forming part of the Consolidated Financial StatementsNote 1: Corporate InformationWelspun Corp Limited (hereinafter referred to as “the Parent Company” or “the Company”) together with its subsidiaries, associates andjointly controlled entities (collectively referred to as “the Group”) are engaged in the business of Production and coating of High gradeSubmerged Arc Welded Pipes, Hot Rolled Steel Plates and Coils, Gas based Sponge Iron (Direct Reduced Iron - DRI and Hot Briquetted Iron- HBI), Infrastructure, Oil and Gas exploration, Energy and Power Generation.Significant Accounting PoliciesIBasis of Consolidationa) The Consolidated Financial Statements (CFS) of the Group are prepared under the historical cost convention on accrual basis inaccordance with the Generally Accepted Accounting Principles in India and Accounting Standard-21 on “Consolidated FinancialStatements” issued by the Institute of Chartered Accountants of India (ICAI), to the extent possible in the same manner as thatadopted by the Parent Company for its separate financial statements by regrouping, recasting or rearranging figures, whereverconsidered necessary.b) The consolidation of the financial statements of the parent company and its subsidiaries is done on a line-by-line basis by addingtogether like items of assets, liabilities, income and expenses. Figures pertaining to the subsidiary companies have beenreclassified wherever necessary to bring them in line with the Group Financial Statements. All significant inter-grouptransactions, unrealized inter-company profits and balances have been eliminated in the process of consolidation. Minorityinterest in subsidiaries represents the minority shareholders proportionate share of the net assets and net income.c) CFS are prepared to the extent possible using uniform accounting policies for transactions and other events in similarcircumstances except for policy differences for which no adjustments made in the accounts are disclosed as under :-i) In case of three subsidiaries, the liability on account of retirement benefits is provided on estimated basis as per locallaw instead of actuarial basis. The liability represents 16.54 % of the total employee benefits liability of the Group as at theyear end.ii)iii)iv)In case of a subsidiary, inventories are valued on first in first out (FIFO) basis. Such inventory represents 0.58% of totalinventories of the Group as at the year end.In case of a subsidiary, tangible fixed assets are depreciated on written down value method representing 0.43% of totaltangible fixed assets of the Group as at the year end.In case of a subsidiary, ancillary costs for arrangement of borrowings are amortized over the period of borrowings insteadof expensed when incurred. Unamortized balance as at 31 March 2013 is ` 60.38 million.d) The CFS includes the Financial Statements of the Parent Company and the subsidiaries (as listed in the table below). Subsidiariesare consolidated from the date on which effective control is acquired and are excluded from the date of transfer / disposal.Name of the Subsidiaries Nature of Business Country of Extent ofIncorporation HoldingDirect SubsidiariesWelspun Pipes Limited Manufacturer of Steel Pipes India 100% (100%)Welspun Natural Resources Private Limited Oil and Gas Exploration India 100% (100%)Welspun Pipes Inc SPV for Steel Pipes Business USA 100% (100%)Welspun Tradings Limited Trading in Steel Products India 100% (100%)Welspun Infratech Limited Infrastructure Development India 100% (100%)Welspun Infra Enterprises Limited SPV for Steel Pipe Business India 100% (--)(w.e.f 15 March 2013)Welspun Mauritius Holdings Limited SPV for Steel Pipes Business Mauritius 89.98% (89.98%)Welspun Maxsteel Limited Manufacturer of Sponge Iron India 87.35% (87.35%)Indirect SubsidiariesHeld through Welspun Mauritius Holdings LimitedWelspun Middle East Pipes Company LLC Manufacturer of Steel Pipes Kingdom of 50.01% (50.01%)Saudi ArabiaWelspun Middle East Pipes Coating Company LLC Coating of Pipes Kingdom of 50.01% (50.01%)Saudi ArabiaWelspun Middle East DMCC Marketing Company Dubai, UAE 100% (100%)108
Notes forming part of the Consolidated Financial StatementsName of the Subsidiaries Nature of Business Country of Extent ofIncorporation HoldingHeld through Welspun Pipes Inc.Welspun Tubular LLC Manufacturer of Steel Pipes USA 100% (100%)Welspun Global Trade LLC Marketing Company USA 100% (100%)Held through Welspun Natural ResourcesPrivate LimitedWelspun Plastics Private Limited Oil and Gas Exploration India 100% (100%)Held through Welspun Infratech LimitedWelspun Projects Limited Infrastructure Development India 61.12% (61.12%)Welspun Road Projects Private Limited Infrastructure Development India 100% (100%)Welspun Infra Projects Private Limited Infrastructure Development India 60% (60%)ARSS Bus Terminal Private Limited Infrastructure Development India 49% (45%)Held through Welspun Projects LimitedMSK Projects (Himmatnagar Bypass) Private Limited Infrastructure Development India 100% (100%)MSK Projects (Kim Mandavi Corridor) Private Limited Infrastructure Development India 100% (100%)Welspun BOT Projects Private Limited Infrastructure Development India 100% (100%)Anjar Road Private Limited Infrastructure Development India 100% (100%)Held through Welspun Infra Projects LimitedWelspun Water Infrastructure Private Limited Infrastructure Development India 100% (100%)Welspun Energy Transportation Private Limited Infrastructure Development India 100% (100%)e)f)AssociatesThe Group has adopted and accounted for Investment in the following Associates in this CFS using the “Equity Method” as perAS-23 issued by ICAI.Name of the Company Nature of Business Country of Extent ofIncorporation HoldingRed Lebondal Limited SPV for Steel Pipe Marketing Cyprus 25% (25%)Welspun Energy Limited* Power Generation India 26% (26%)Welspun Captive Power Generation Limited Power Generation India 24% (15%)(w.e.f. 26 December 2012)*Direct and Indirect subsidiaries of Welspun Energy Limited (an associate company): Welspun Energy Madhya Pradesh Limited, Welspun Energy AnuppurPrivate Limited , Welspun Energy UP Private Limited , Welspun Urja India Limited, Welspun Energy Chhattisgarh Limited, Welspun Renewable Energy Limited,Welspun Urja Gujarat Private Limited, Welspun Energy Meghalaya Private Limited, Welspun Energy Jharkhand Private Limited, Welspun Energy Orissa PrivateLimited, Welspun Energy Resources Private Limited, Welspun Solar Park Private Limited, Welspun Energy Park Private Limited, Welspun Solar Tech PrivateLimited, Welspun Energy Maharashtra Private Limited, Welspun Energy Rajasthan Private Limited , Solarsys Renewable Energy Private Limited, Welspun SolarMadhya Pradesh Private Limited, Welspun Solar Rajasthan Private Limited, Welspun Solar Punjab Private Limited, Welspun Solar UP Private Limited, WelspunSolar AP Private Limited, Unity Power Private Limited, Northwest Energy Private Limited, Dreisatz Mysolar24 Private Limited, SUIL Hydro Power Private Limited,MI Mysolar24 Private Limited, Solarsys Energy Private Limited, Welspun Solar Kannada Private Limited.Joint VenturesThe Group has adopted and accounted for interest in the following Joint Ventures in this CFS, using the “ProportionateConsolidation Method” as per AS-27 issued by ICAI.Name of the Enterprise Nature of Business Country of Extent ofIncorporation HoldingDirect Joint VentureDahej Infrastructure Private Limited (upto 20 March 2013) Development of Jetty India -- (50%)Indirect Joint VenturesHeld through Welspun Natural Resources Private LimitedAdani Welspun Exploration Limited Oil and Gas Exploration India 35% (35%)Held through Welspun Infra Projects Private LimitedLeighton Welspun Contractors Private Limited Infrastructure Development India 32.38% (35%)Held through Welspun Projects LimitedDewas Bhopal Corridor Limited Infrastructure Development India 50% (50%)Bul MSK Infrastructure Private Limited Infrastructure Development India 50% (50%)Leighton Welspun Contractors Private Limited Infrastructure Development India 7.5% (----)(w.e.f. 28 March 2013)109
Notes forming part of the Consolidated Financial Statementsg)Use of estimatesThe preparation of the financial statements requires the management to make estimates and assumptions that affect thereported amounts of assets and liabilities, disclosure of contingent liabilities as at the date of the financial statements and thereported amount of revenue and expenses of the year. The estimates and assumptions used in the accompanying financialstatements are based upon management's evaluation of the relevant facts and circumstances as of the date of the financialstatements. The examples of such estimates include the useful life of the tangible and intangible assets, allowance for doubtfuldebts/advances, future obligations in respect of retirement benefit plan etc. Actual results could differ from those estimatesand in such case the difference is recognised in the period when known or materialised.IIIIIIVVTangible and intangible assetsa) Tangible assets are stated at original cost (net of tax/duty credit availed) less accumulated depreciation, amortisation andimpairment losses except freehold land which is carried at cost. Cost includes cost of acquisition, construction and installation,taxes, duties, freight, other incidental expenses related to the acquisition, trial run expenses (net of revenue) and pre-operativeexpenses including borrowing costs incurred during pre-operational period.b) Projects under which tangible assets are not ready for their intended use are carried at cost, comprising direct cost, relatedincidental expenses. In case of a Joint venture related to oil and gas business, expenditure related to and incurred during theexploration period are included under “Capital work-in-progress” and in case of discovery, the same will be allocated/transferred to the respective producing properties. However, in case there is no discovery, expenditure incurred for theexploration work will be charged to revenue.c) Build, Operate and Transfer Project Expenditure - Project Roads pertains to the costs incurred by the Group for construction ofroads under the concession agreement entered into between the Group and the respective Authority. These agreementsencompass the construction, operation and maintenance of the highway on a Build, Operate and Transfer basis.d) Intangible assets are carried at cost, net off accumulated amortization and impairment loss, if any.Borrowing costsBorrowing costs attributable to the acquisition or construction of qualifying assets are capitalized as part of cost of such assets. Allother borrowing costs are charged to revenue.Impairment of tangible and intangible assetsAt each balance sheet date, the Group reviews the carrying amount of tangible and intangible assets to determine whether there isany indication of impairment loss. If any such indication exists, the recoverable amount of the assets is estimated in order todetermine the extent of impairment loss. The recoverable amount is higher of the net selling price and the value in use, determinedby discounting the estimated future cash flows expected from the continuing use of the asset to their present value.Depreciation/Amortization on tangible and intangible assetsa) Depreciation on tangible assets is provided on straight line method at the rates prescribed in Schedule XIV to the CompaniesAct, 1956 except for certain Plant and Machinery which are depreciated on the basis of estimated useful lives of 13 – 15 years.The Group has adopted a policy of depreciating both computers and mobile phones based on the useful life of the assets i.e.4 years and 3 years respectively. The rates of depreciation derived from these estimated useful lives are higher than thoseprescribed in Schedule XIV to the Companies Act, 1956.b) For determining the appropriate rate of depreciation on Plant and Machinery, continuous process plant has been identified onthe basis of technical opinion taken by the Group / Expert.c) "Intangible assets are amortized on a straight-line basis over its expected useful life as estimated by the management.Intangible Assets i.e. BOT Cost (Toll Collection right) is amortized over the period of concession, using revenue basedamortization. Under this methodology, the Carrying value is amortized in the proportion of actual toll revenue for the year toprojected revenue for the balance toll period, to reflect the pattern in which the assets’ economic benefits will be consumed. Ateach Balance sheet date, the projected revenue for the balance toll period is reviewed by the management. If there is anychange in the projected revenue from previous estimates, the amortization of toll collection rights is changed prospectively toreflect any change in the estimates."d) Leasehold improvements are amortized over the period of lease.e) In case of revalued assets, depreciation will be provided over the residual life of the assets and the difference between thedepreciation on revalued amount and the depreciation with respect to historical cost will be recouped out of revaluationreserve.110
Notes forming part of the Consolidated Financial StatementsVIf) Goodwill arising out of acquisition is amortized over a period of three years from the year of acquisition. Goodwill onconsolidation is not amortized. However, the same is tested for impairment as at reporting date.InvestmentsInvestments, which are readily realisable and are intended to be held for not more than one year from the date on which suchinvestments are made, are classified as current investments. All other investments are classified as long-term investments.Long-term investments are valued at cost less provision for diminution other than temporary, in the value of such investments.Current investments are valued at lower of cost and fair value.VII Revenue Recognitiona) Sale of goods is recognized on transfer of significant risks and rewards of ownership to the customers. Export sales arerecognised on the basis of date of bill of lading. Gross sales include excise duty and adjustments for price variations, excludesales tax/value added tax.b) Export benefits: Duty Entitlement Pass Book (DEPB), Focus Market and Focus Product Scheme are recognised on accrual basis.Target plus /Duty Free Entitlement Certificate scheme of EXIM policy are recognized when utilized.c) Revenue from services is recognized when on completion of service.d) Dividend income is recognized when the right to receive the dividend is established.e) Interest income is recognized at the agreed rate on time proportion basis.f) Revenue recognition-Infrastructure businessA) Revenue from Engineering, Procurement and Construction (EPC) Contractsi) When the outcome of the construction contract can be estimated reliably contract revenue and contract cost associatedwith the construction contract are recognised as revenue and expense respectively by reference to the stage of completionof the contract activity at the reporting date. The stage of completion of the contract is the proportion that the contractcost incurred for the work performed up to the reporting date bears to the estimated total contract cost. An expected losson a construction contract is recognised as an expense immediately.ii)iii)iv)Determination of revenue under the percentage of completion method necessarily involves making estimates by theGroup, some of which are of a technical nature, concerning, where relevant, the percentages of completion, costs tocompletion, the expected revenues from the project/activity and the foreseeable losses to completion.A variation is included in contract revenue when it is probable that the customer will approve the variation and amount canbe measured reliably.A claim is included in contract revenue when negotiations with customer have reached an advance stage such that it isprobable that the customer will accept the claim and amount can be measured reliably.v) Unbilled costs are carried as construction work in progress which includes installation at sites and enabling works and isvalued at cost.B) Revenue from toll collectionToll revenue from operations of project toll roads is recognised on the basis of actual toll collection.C) Advances and progress payments and retentioni) Advances received from customers in respect of contracts are treated as liabilities and adjusted against progress billing asper terms of the contract.ii)iii)VIII InventoriesProgress payments received are adjusted against receivables from customers in respect of the contract work performed.Amounts retained by the customers until the satisfactory completion of the contracts are recognized as receivables. Wheresuch retention has been released by the customers against submission of bank guarantee the amount so released isadjusted against receivables from the customers and the value of bank guarantees is disclosed as contingent liability.Inventories are valued at lower of cost and net realizable value. The basis of determining cost for various categories of inventories isas follows:a) Steel products businessi) Raw materials, stores and spares – Moving weighted average basis.111
Notes forming part of the Consolidated Financial Statementsii)iii)Goods-in-process – Cost of materials plus labour and other production overheads.Finished goods – Cost of materials plus labour, production overheads and excise duty on such goods.b) Infrastructure businessi) Raw materials is valued on First-in-First-out (FIFO) basis. [Refer Note 1, I (c)]ii) Stores and spares are written off in the year of purchase.IXXXIXIIForeign currency transactionsA) Accounting of transactionsi) Transactions foreign currency are accounted at the exchange rate prevailing on the date of such transactions. Currentmonetary assets and liabilities are translated at the exchange rate prevailing at the reporting date. Non-monetary itemsare carried at cost.ii) Gains or losses arising on remittance / translations at the year- end are credited / debited to the statement of profit andloss except treatment as per amendment to AS-11 effective till 31 March 2020 [Refer Note 31(b)].iii) Premium / discount on derivative contracts not relating to firm commitments or highly probable forecasted transactionsand not intended for trading or speculation purpose is amortized as income or expense over the life of the contract.B) Translation and exchange ratesFinancial statements of overseas non-integral operations are translated as under:i) Assets and Liabilities are translated at the exchange rate prevailing at the end of the year. Depreciation at the same rate atwhich assets are converted.ii) Revenues and expenses at yearly average rates (except inventories at opening / closing rates as the case may be). OffBalance Sheet items at year-end rates.iii) Exchange differences arising on translation of non-integral foreign operations are accumulated in the Foreign CurrencyTranslation Reserve until the disposal of such operations.C) Derivative instruments and hedge accountingThe Group uses foreign currency forward contracts to hedge its risk associated with foreign currency fluctuations relating tocertain firm commitments and forecasted transactions. The Group designates these hedging instruments as cash flow hedgesand applying the recognition and measurement principles set out in Accounting Standard 30 “Financial Instruments:Recognition and Measurement” (AS 30). The gain or loss on the effective hedges is recorded in “Hedging Reserve Account”until the transaction is complete. The gain or loss is accounted in statement of Profit and Loss upon completion of thetransaction or when the hedge instrument expires or terminates or ceases to qualify for hedge accounting.Employee benefitsa) Short-term employee benefits are recognized as an expense at the undiscounted amount in the statement of profit and loss ofthe year in which the related services are rendered.b) Post employment and other long-term benefits are recognized as an expense in the statement of profit and loss of the year inwhich the employee has rendered services. The expense is recognized at the present value of the amounts payable determinedusing actuarial valuation techniques except in case of few overseas subsidiaries, liability for leave encashment and gratuity isprovided on estimated basis. Actuarial gains and losses in respect of post employment and other long-term benefits recognizedin the statement of profit and loss. In case of three subsidiaries, the liability on account of retirement benefits is provided onestimated basis [Refer Note 1, I (c)(i)].c) Payments to defined contribution retirement benefit schemes are charged as an expense as and when they fall due.Employee stock options schemeIn respect of employee stock options granted pursuant to the Stock Option Scheme, the intrinsic value of the options (excess ofmarket price of the share over the exercise price of the option) is treated as discount and accounted as employee compensation costover the vesting period.Accounting for taxes on incomea) Current income tax is calculated on the results of individual companies in accordance with local tax regulations.b) Deferred tax is recognized subject to consideration of prudence, on timing difference, being the difference between taxable112
Notes forming part of the Consolidated Financial StatementsXIII Leasesincome and accounting income that originate in one period and are capable of reversal in one or more subsequent periods andmeasured using prevailing enacted or substantively enacted tax rates.a) Finance leaseAssets acquired under finance lease are capitalised and the corresponding lease liability is recognized at lower of the fair valueof the leased assets and the present value of minimum lease payments at the inception of the lease. Initial costs directlyattributable to lease are recognized with the asset under lease.b) Operating leaseLease of assets under which all the risks and rewards of ownership are effectively retained by the lessor are classified asoperating leases. Lease payments/revenue under operating leases are recognized as an expense/income on accrual basis inaccordance with the respective lease agreements.XIV Government grants and subsidies - Infrastructure businessGrants and subsidies from the government are recognized when there is reasonable assurance that (a) the Group will comply withthe conditions attached to them, and (b) the grant/subsidy will be received.When the grant or subsidy relates to revenue, it is recognized as income on a systematic basis in the statement of profit and loss overthe periods necessary to match them with the related costs, which they are intended to compensate. Where the grant relates to anasset, it is reduced from the cost of the asset. Grants which are given as equity support are disclosed as promoter contribution underthe head Capital Reserve.XVProvisions, contingent liabilities and contingent assetsContingent liabilities are disclosed in respect of possible obligations that arise from past events but their existence will be confirmedby the occurrence or non-occurrence of one or more uncertain future events. A provision is made when it is probable that an outflowof resources embodying economic benefits will be required to settle an obligation and in respect of which a reliable estimate can bemade. Provision is not discounted and is determined based on best estimate required to settle the obligation at the year end date.Contingent assets are not recognized or disclosed in the financial statementsXVI Earnings per shareBasic earnings per share is computed and disclosed using the weighted average number of equity shares outstanding during theyear. Dilutive earnings per share is computed and disclosed using the weighted average number of equity and dilutive equityequivalent shares outstanding during the year, except when the results would be anti-dilutive.2. Share capitalAuthorised( ` in million)2013 2012304,000,000 (304,000,000) Equity Shares of ` 5/- each 1,520.00 1,520.0098,000,000 (98,000,000) Preference Shares of ` 10/- each 980.00 980.00Issued, subscribed and paid upTotal 2,500.00 2,500.00262,948,299 (227,781,035) Equity Shares of ` 5/- each fully paid up 1,314.74 1,138.91Total 1,314.74 1,138.91113
Notes forming part of the Consolidated Financial Statementsa) Reconciliation of the number of shares outstandingAt the beginning of the year 227,781,035 1,138.91 204,668,910 1,023.34– By way of Global Depository Receipts (GDR) – – 23,026,000 115.13– By way of Conversion of Compulsory Convertible Debentures (CCD) 35,038,889 175.19 – –– Equity shares allotted on exercise of Employees Stock Options 128,375 0.64 86,125 0.43b) Terms and rights attached to equity sharesc) Shareholders holding more than 5% shares of the company2013 2012Number of ` in million Number of ` in millionEquity SharesEquity SharesOutstanding at the end of the year 262,948,299 1,314.74 227,781,035 1,138.91The Company has only one class of equity shares having a par value of ` 5 per share. Each holder of equity shares is entitled to onevote per share, however the holders of global depository receipts (GDR's) do not have voting rights in respect of shares representedby the GDR's till the shares are held by the custodian [Refer note 2(e)]. The dividend when proposed by the Board of Directors issubject to the approval of the shareholders in the ensuing Annual General Meeting.In the event of liquidation of the company, the holders of the equity shares will be entitled to receive remaining assets of thecompany, after distribution of preferential amounts. The distribution will be in proportion to the number of equity shares held by theshareholders.2013 2012Name of Shareholders Number of Percentage Number of PercentageEquity Shares (%) Equity Shares (%)J P Morgan Chase Bank, NA ADR Account (Custodian and againstwhich GDR have been issued to Insight Solutions Limited) 23,026,000 8.76 23,026,000 10.11Granele Limited 35,038,889 13.33 – –Life Insurance Corporation of India Limited & its Schemes 19,283,580 7.33 19,277,980 8.46Welspun Wintex Limited 13,336,576 5.07 13,336,576 5.85Welspun Mercantile Limited 13,877,701 5.28 12,377,701 5.43Welspun Fintrade Limited 18,955,791 7.21 15,148,340 6.65Krishiraj Trading Limited 26,907,692 10.23 26,805,403 11.77d) Employee stock options schemeIn respect of options granted under the Welspun Employee Stock Options Scheme, in accordance with the guidelines issued bySecurities and Exchange Board of India, the value of options (based on intrinsic value of the share on the date of the grant of theoption) is accounted as deferred employee compensation, which is amortized on a straight line basis over the vesting period.Employee benefits expense include credit of `6.60 million ( `1.51 million) on account of options lapsed during the year.During the year, 128,375 equity shares of `5 each fully paid up were issued at a price of `80.00. Discount allowed aggregating to`3.43 million ( `2.27 million) in respect of shares allotted pursuant to the Employee Stock Options Scheme is credited to SecuritiesPremium Account as per guidelines of Securities and Exchange Board of India.114
Notes Forming Part Of The Consolidated Financial StatementsStock options outstanding as at the year end are as follows:Granted during Granted during2006-07 2009-10Exercise price `80.00 `66.75Date of grant 8 January 2007 20 April 2009Vesting period commences on 8 January 2008 20 April 2010Options outstanding at the beginning of the year 375,250 32,875Options exercised during the year 128,375 –Options lapsed during the year 246,875 –Options outstanding as at 31 March 2013 – 32,875e) Compulsorily Convertible Debentures (CCD)During the previous financial year, the Company has raised US$ 178.01 million (Equivalent INR 7,883.75 million) by way of issue ofunsecured CCD carrying a coupon of 5% (Five) annually until issue of Equity Shares upon conversion of the CCD. Since the holders ofCCD have not opted for conversion during the period of 18 month from the date of issue of the said CCD, the CCD got converted on18 February 2013 into 35,038,889 equity shares of `5 each fully paid up at a conversion price of `225 per share.f) Global Depository Receipts (GDR)During the previous year, the Company has raised US$ 115.00 million (Equivalent INR 5,180.85 million) by way of issue of 23,026,000equity shares of ` 5 each fully paid up at a premium of ` 220 each (equivalent 23,026 Non Voting GDR each of US$ 4,994.45 eachrepresenting 1000 equity shares of par value of ` 5 each). The entire proceeds have been invested in short-term securities as at31 March 2013.( ` in million)2013 20123. Reserves and surplusCapital reserveAs per last balance sheet 1,057.26 1,057.261,057.26 1,057.26Capital reserve on consolidation 152.90 152.90Securities premiumAs per last balance sheet 17,252.74 12,332.32Add/(Less) :Received during the year 8,053.37 5,072.08Discount on issue of shares under employees stock option scheme 3.43 2.27Premium on redemption of foreign currency convertible bonds 11.70 (45.75)Utilized towards share/debenture issue expenses (56.40) (108.17)25,264.84 17,252.74Debenture redemption reserveAs per last balance sheet 1,464.29 1,107.14Add: Appropriated during the year (321.92) 357.141,142.36 1,464.29Cash subsidy [Refer Note 30 (2)]1,265.38 –Revaluation reserve [Refer Note 43(b)]6,564.12 –Employees stock options outstanding 0.73 10.77Hedging reserve account [Refer Note 31(c)](44.84) (178.18)Foreign currency monetary item translation difference account (275.37) (322.97)Foreign currency translation reserve 680.94 363.88General ReserveAs per last balance sheet 1,696.11 1,631.11Less: Loss on dilution [Refer Note 35 (b)] (3.19) –Add: Appropriated during the year 56.27 65.001,749.20 1,696.11Surplus in the statement of Profit and LossAs per last balance sheet 18,296.99 16,466.07Profit / (Loss) for the year (703.23) 2,385.43Less: AppropriationsGeneral reserve 56.27 65.00Debenture redemption reserve (321.92) 357.14Proposed dividend on equity shares 131.47 113.89Tax on proposed dividend 22.34 18.48Dividend on equity shares of earlier year 0.20 –Total appropriations (111.63) 554.51Net surplus in the Statement of Profit and Loss 17,705.40 18,296.99Total 55,262.91 39,793.79115
Notes Forming Part Of The Consolidated Financial Statements( ` in million)Non-currentCurrent2013 2012 2013 20124. Long-term borrowingsSecuredRedeemable non-convertible debentures 13,428.00 10,000.00 – 1,700.00Non-convertible bonds - City of Little Rocks, Arkansas, 482.05 472.71 22.35 19.76Series 2007-AExternal commercial borrowings 7,188.08 5,174.13 2,721.68 2,577.38Term loans from banks 19,745.91 13,074.15 1,366.33 1,606.00Term loan from financial institution 513.96 – 65.15 –Other loans 27.73 – 6.04 –UnsecuredForeign currency convertible bonds 4,424.23 7,631.25 – –Term loans from banks – 88.08 – –Inter-corporate deposit 3,110.31 2,690.72 – –Deferred sales tax loan 610.49 583.17 16.69 16.69Total 49,530.77 39,714.21 4,198.24 5,919.83a) The debentures together with interest are secured by first charge ranking pari passu by way of mortgage/hypothecation of entireimmovable and movable fixed assets of the Company, both present and future and second/floating charge on current assets, subjectto prior charge in favour of banks for working capital facilities.No. of Debentures Face value Redemption Rate of Amount( `) date interest (p.a.) ( `in million)5000 1,000,000 September 2025 9.55% 5,0005000 1,000,000 August 2025 9.55% 5,000900 1,000,000 November 2020 11.00% 900328 1,000,000 September 2019 11.15% 3282200 1,000,000 August 2019 11.15% 2,200Total 13,428b ) External commercial borrowings (ECB) is secured by first charge ranking pari passu by way of mortgage/hypothecation of entireimmovable and movable tangible assets of the Company both present and future. Further, the ECB is also secured by exclusivecharge by way of hypothecation of Debt Service Reserve Account. The ECB comprises of USD 163.45 million (USD 140 million) andJPY 677.65 million (JPY 1015.20 million) and carries interest of LIBOR plus 1.25% to 4.50%.The ECB is repayable as follows:Repayment schedule USD Amount JPY Amount(million) ( `in million) (million) ( `in million)April 2013 46.55 2,526.97 337.55 194.71April 2014 46.90 2,545.97 340.10 196.18April 2015 2.70 146.57 – –October 2015 2.70 146.57 – –April 2016 4.00 217.14 – –October 2016 14.00 759.99 – –April 2017 4.00 217.14 – –October 2017 14.00 759.99 – –April 2018 4.00 217.14 – –October 2018 14.00 759.99 – –April 2019 5.30 287.71 – –October 2019 5.30 287.71 – –In case of Joint ventureOctober 2016 to January 2018 11.90 645.99 – –Total 175.35 9,518.87 677.65 390.89116
Notes forming part of the Consolidated Financial Statementsc) Term loan from banki) In case of Parent Company: Term loan of ` 1,614.98 million (Nil) from bank is secured by first charge ranking pari passu by wayof mortgage/hypothecation of entire movable and immovable tangible assets of the Company and second charge over theentire current assets of the company both, present and future. The loan carries interest of LIBOR plus 5.00%. The loan isrepayable in 18 equal quarterly instalments after a moratorium of 30 months from the date of first disbursement i.e.15 November 2012ii) In case of subsidiary engaged in the business of Steel Products in USA: Term loan of ` 4,737.45 million ( ` 2,195. 51 million)from bank carries interest ranging LIBOR plus 2.71 % to 4.46%. The loan is repayable from June 2014 till November 2018(Repayment due within 12 months is ` 604.46 million)iii) In case of a subsidiary engaged in the manufacturing of sponge iron: Term loan of `8,710.00 million ( `6,700.86 million) havebeen restructured w.e.f 1 June 2012 as per the restructuring scheme approved by the term lenders. As per the terms of thescheme, the Interest Liabilities on the term loans w.e.f 1 June 2012 till 30 September 2014 will be converted into FundedInterest Term Loan (FITL) of ` 797.98 million (Nil) carrying interest @ 11.00 % p.a. During this period, Interest on FITL will beserviced on a monthly basis @ 11.00 % p.a from 1 June 2012 till 30 September 2014. Subsequently, the Term loan and theFunded Interest Term Loan will be repaid in 30 Quarterly ballooning Installment commencing from 31 December 2014 till31 March 2022 alongwith Interest servicing @ BBR + 3.25 % p.a (present effective 13.75% p.a. )iv) In case of subsidiary engaged in the business of Infrastructure: Term loan of `2,250.00 million ( `2,250.00 million) from bankcarries interest of 12.31% p.a to be reset annually on April 28 every year. The entire loan is repayable in one installment atmaturity after 5 years (in April 2016) from date of drawdown. Further, term loans of `3,001.83 million ( `3,533.78 million) takenmainly for Build Operate and Transfer (BOT) Assets from bank carries interest ranging 10.40% to 14.50% p.a (Repayment duewithin 12 months is ` 761.87 million).d) Term Loan from Financial Institution:In case of subsidiary engaged in the business of Steel Products in Kingdom of Saudi Arabia : Term loan of ` 579.11 million (Nil) fromFinancial Institution. The loan is repayable from June 2013 till October 2018 (Repayment due within 12 months is ` 65.15 million).e) Foreign currency convertible bonds (FCCB)i) During the financial year 2009 - 2010, the Company had raised US$ 150 million (Equivalent INR 6,942 million) by way of issue of1500 4.5% FCCB of US$ 100,000 each. The Bond holders have an option to convert outstanding bonds (US$ 81.50 million) into13,045,433 equity shares of `5 each fully paid up at an initial conversion price of `300 per share with a fixed rate of exchange onconversion of ` 48.02 = US$ 1 at any time on or after 26 November 2009 until 10 days prior to Maturity date (i.e. 17 October2014). Unless previously converted, redeemed or repurchased and cancelled, the Bonds will be redeemed on 17 October 2014at 102.8028% of the principal amount so as to give a gross yield of 5% per annum (calculated on semi annual basis) to the Bondholders.The Company has an option to redeem the Bonds at their Early Redemption amount upon occurrence of events specified in theOffering Circular for issue of the Bonds (“Offering Circular”). Further, the Company has an option to mandatorily convert theBonds after three years as specified in the Offering Circular.ii) Premium payable on redemption of FCCB aggregating to credit of `11.70 million (debit of `45.75 million) has been adjustedagainst securities premium as per Section 78 of the Companies Act, 1956. In the event, Bond holders exercise the conversionoption, the amount of premium utilized from securities premium will be suitably adjusted in respective years.iii)iv)During the year, the company has repurchased 685 4.5% FCCB of US$ 100,000 each aggregating to US$ 68.50 million at adiscount gain of US$ 4.00 million (equivalent ` 216.70 million) arising on repurchase of FCCB is shown under "Other income".Part of the net proceeds received from the issue of FCCB has been utilized as per objects of the issue viz for funding of Plate andCoil Mill, Pipe Mill Capex Projects (Anjar and Mandya) and Investment in overseas subsidiary. Pending utilization, the balanceissue proceeds of US$ 0.55 million equivalent INR 30.09 million (US$ 17.04 million equivalent INR 866.91 million) have beeninvested in short term deposits/current account with a bank abroad and ` Nil ( ` 1.46 million) lying in current account with abank in India.117
Notes forming part of the Consolidated Financial Statements5. (a) Deferred tax liabilities (net)( ` in million)2013 2012Deferred tax liabilitiesFiscal allowance on fixed assets 7,132.83 6,264.04Others 93.63 104.797,226.47 6,368.83Deferred tax assetsEmployee benefits 18.51 16.79Other disallowances 737.27 651.41Unabsorbed fiscal allowances 568.90 664.51Fiscal allowance on fixed assets 301.87 –1,626.56 1,332.72Total 5 (a) 5,599.91 5,036.11(b) Deferred tax assets (net)Deferred tax assetsFiscal allowance on fixed assets 66.09 46.03Other disallowances 22.21 19.95Total 5 (b) 88.30 65.98( ` in million)2013 20126. Other long-term liabilitiesLiability towards claims 1,764.26 2,417.44Trade advances and deposits 479.64 987.95Other liabilities 27.10 –Total 2,271.00 3,405.39( ` in million)2013 20127. Long-term provisionsEmployee benefits 167.24 149.04Premium payable on redemption of FCCB 83.48 95.18Total 250.72 244.22( ` in million)2013 20128. Short-term borrowingsSecuredWorking capital loans from banks- Foreign currency – 992.06- Rupee 2,043.41 2,460.85Short-term loan from banks- Foreign currency – 1,119.25Short-term loan from other parties – 1,200.90UnsecuredShort-term loans from banks – 2,000.21Total 2,043.41 7,773.27118
Notes forming part of the Consolidated Financial Statements( ` in million)2013 20129. Trade payablesAcceptances 21,286.94 23,879.69Others 9,092.71 9,043.32Total 30,379.65 32,923.01( ` in million)2013 201210. Other current liabilitiesCurrent maturities of long term borrowings (Refer note 4) 4,198.24 5,919.83Interest accrued but not due on borrowings 880.64 906.56Interest accrued and due on borrowings 4.69 –Unclaimed dividend 5.30 5.20Share application money pending allotment 52.45 52.45Other payablesCreditors for- Capital goods 179.76 175.54- Expenses 1,974.32 1,183.75Trade advances and deposits 8,143.64 5,438.49Statutory dues 799.82 804.38Liability towards claims 815.22 254.38Others 316.45 144.65Total 17,370.54 14,885.24( ` in million)2013 201211. Short-term provisionsEmployee benefits 155.39 52.08Others forWarranty 1.41 –Litigation 79.79 92.65Liquidated damages 460.52 572.07Mark to market losses on derivative contracts 336.51 547.00Proposed equity dividend 131.47 113.89Tax on proposed equity dividend 22.34 18.48Taxation (Net of advances) 156.49 416.09Total 1,343.93 1,812.25119
Notes forming part of the Consolidated Financial StatementsNote 12 - Fixed assets( ` in mi ion)Gross Block Depreciation/Amortization Net BlockAs at Acquired Additions Addition Foreign Deductions Ast at Upto Acquired For the Foreign Deductions mpairment Upto As at As at01 April on Due to Currency 31 March 01 April on Year Currency upto 31 March 31 March 31 March2012 Acquisition Revaluation Fluctuations 2013 2012 Acquisition Fluctuations 31 March 2013 2013 20122013a) Tangible assetsLand - Freeho d 465 12 – 189 07 428 71 16 31 1 47 1,097 75 – – – – – – – 1,097 75 465 12Land - Leaseho d 2,195 58 – 103 67 2,568 29 77 16 – 4,944 69 202 32 – 87 08 8 96 – – 298 37 4,646 33 1,993 26Bui dings 8,695 65 14 06 1,275 16 441 86 242 14 5 39 10,663 48 910 00 4 86 330 52 18 27 2 15 – 1,261 49 9,402 00 7,785 66P ant and Machinery 52,268 50 189 13 4,821 04 5,014 77 756 14 598 51 62,451 07 10,860 32 82 22 3,443 56 130 37 332 25 105 59 14,289 82 48,160 45 41,407 33Construction Assets 237 26 – 1 81 – – 0 18 238 90 113 22 – 17 08 – – – 130 30 108 60 124 04Office and other Equipments 857 68 11 78 69 53 – 26 39 11 37 954 02 346 10 8 48 98 62 9 34 6 96 – 455 57 498 45 511 59Vehic es 377 81 5 84 24 16 – 3 53 19 23 392 11 242 51 4 87 36 79 1 64 14 73 0 51 271 58 120 53 135 31Furniture and Fixtures 213 31 0 86 40 97 – 3 46 7 67 250 93 79 97 0 60 31 22 1 59 4 07 – 109 31 141 61 133 34Leaseho d mprovements 40 23 2 39 0 08 – – 10 78 31 92 14 73 1 98 4 46 – 10 64 – 10 54 21 38 25 50Total (a) 65,351.16 224.05 6,525.49 8,453.64 1,125.12 654.59 81,024.87 12,769.17 103.00 4,049.33 170.17 370.80 106.09 16,826.97 64,197.10 52,581.13b) ntangible assetsGoodwi 153 99 – – – 9 27 – 163 26 146 84 – 3 34 9 27 – – 159 44 3 82 7 16Goodwi on Conso idation 9,887 86 – 790 91 – – 22 94 10,655 83 – – – – – – – 10,655 83 9,887 86Software 491 57 3 95 51 96 – – 1 38 546 09 217 52 3 14 97 04 – 1 10 – 316 60 229 49 274 04Bui d, Operate and 4,800 84 – 1,265 38 – – 12 21 6,054 00 309 46 – 617 22 – – – 926 67 5,127 33 4,491 38Transfer (BOT)Total (b) 15,334.26 3.95 2,108.25 – 9.27 36.53 17,419.19 673.82 3.14 717.59 9.27 1.10 – 1,402.72 16,016.47 14,660.44Total (a + b) 80,685.42 227.99 8,633.75 8,453.64 1,134.38 691.13 98,444.05 13,442.99 106.14 4,766.92 179.44 371.90 106.09 18,229.69 80,213.57 67,241.57Previous year 50,486 51 6,337 54 22,420 90 – 1,633 62 193 16 80,685 41 8,793 74 956 20 3,533 16 198 19 80 46 42 16 13,442 99 67,241 57Capital work-in-progress 5,275.84 6,190.89ntangible assets under 80.47 – 108.15 – – – 188.62 – – – – – – – 188.62 80.47developmentNotes1) Gross b ock of P ant and Machinery inc udes `63 49 mi ion ( `63 49 mi ion) in respect of expenditure on capita asset, ownership of which does not vest with the company2) Depreciation and amortisation expense for the year inc udes `5 71 mi ion ( `17 93 mi ion) transferred to Pre-operative expenses3) For detai s of exchange difference capita ized/decapita ized as per amended AS 11, refer Note 31 (b)4) Capita work-in-progress inc udes pre-operative expenses `2,616 28 mi ion ( `3,597 21 mi ion)5) Pre-operative expenses of `52 60 mi ion ( `249 45 mi ion) in respect of projects have been capita ized during the year6) Borrowing costs (net) transferred to fixed assets/capita work-in-progress is `355 91 mi ion ( `749 58 mi ion)7) n case of a subsidiary engaged in manufacturing of sponge iron, easeho d and aggregating to ` 398 41 mi ion (gross b ock) acquired under Scheme of Arrangement is yet to be transferred in the name of company8) n case of a subsidiary engaged in manufacturing of sponge iron, bui ding inc udes ` 54 43 mi ion (gross b ock) being contribution for construction of khar and bunds (structure), ownership of which vests with the state governmentauthorities9) n case of a subsidiary engaged in manufacturing of sponge iron, bui ding inc udes ` 29 47 mi ion (gross b ock) being contribution for construction of Diversion Road ,ownership of which vests with the state government authorities120
Notes forming part of the Consolidated Financial Statements( ` in million)2013 201213. Non-current investments(Valued at cost unless stated otherwise)A. Trade investments - UnquotedAssociatesRed Lebondal Limited (Extent of holding 25%)450 (450) Equity Shares of Euro 1 each 0.03 0.03Add: Accumulated Share of Profit/(Loss) 0.14 (3.04)Add: Share of Profit/(Loss) for the year – 3.18Less: Provision for diminution in value of Investment (0.17) –Welspun Energy Limited (Extent of holding 26%)60,493,342 (17,515,300) equity shares of ` 10 each 910.85 262.74Add: Goodwill – –Add: Accumulated Share of Profit/(Loss) 8.47 (2.73)Add: Share of Profit/(Loss) for the year (37.96) 11.20Welspun Captive Power Generation Limited2,938,427 (5,000) equity shares of ` 10 each 29.41 0.0516,976,573 (Nil) preference shares of ` 10 each fully paid up 169.86 –Investment in Joint Ventures 28.38 13.82B. Other investmentsi) Quoted#- Equity Shares 30.03 30.03- Depository Receipts 34.77 34.77ii) Unquoted- Equity Shares 1.64 1.61Less: Provision for diminution in the value of unquoted investments (0.85) (0.07)Investment in Government SecuritiesIndira Vikas Patra * [ ` 500 (500)] 0.00 0.00Three (Three) Bonds of ` 10,00,000 Sardar Sarovar Narmada Nigam Limited 3.00 3.00National Saving certificate 0.03 0.02Total 1,177.63 354.63(All the above shares and securities are fully paid up)*Denotes figures less than ` 10,000.# Diminution in value of Long-Term Investment of ` 16.15 million is not provided for,considering the same to be temporary in nature.Aggregate book value of quoted investments 64.80 64.80Aggregate book value of unquoted investments 1,113.85 289.89Aggregate market value of quoted investments 53.95 48.22Aggregate provision for diminution in value of unquoted investments (1.02) (0.07)121
Notes forming part of the Consolidated Financial Statements( ` in million)2013 201214. Long-term loans and advances(Unsecured considered good, unless otherwise stated)Capital advances 1,715.11 1,975.80Less: Provision for doubtful advances 2.96 2.141,712.15 1,973.66Deposits- Related Parties 309.60 351.10- Others 279.48 370.49Less: Provision for doubtful deposits 9.46 9.43579.62 712.16Loans and advances to related partiesShare application money 21.55 894.76Other loans and advances 32.69 30.6454.24 925.40Other loans and advancesAdvances recoverable in cash or Kind 1,221.03 1,024.20Prepaid expense 62.65 5.07Loan to employees 0.08 0.36Balances with government authorities- Direct tax (net) 502.63 413.28- Indirect tax 114.05 6.40Minimum alternative tax credit entitlement 205.63 71.642,106.07 1,520.95Total 4,452.08 5,132.17( ` in million)2013 201215. Other non-current assets(Unsecured considered good unless otherwise stated)Long term trade receivables (including trade receivables on deferred credit terms) 291.70 256.04Interest receivable 3.55 2.72Margin money deposits 32.23 21.93Receivable towards claim – 76.31Others 0.42 0.06Total 327.90 357.06( ` in million)2013 201216. Current Investments(Valued at lower of cost and fair value, unless stated otherwise)A. Quotedi) Bonds 15,391.02 18,891.65ii) Certificate of deposits 1,236.27 488.34iii) Mutual funds 280.97 –B. Unquotedi) Bonds 585.33 50.64Total 17,493.59 19,430.62Aggregate Book Value of Quoted Investments 16,908.26 19,379.99Aggregate Book Value of Unquoted Investments 585.33 50.64Aggregate Market Value of Quoted Investments 17,107.31 19,702.14122
Notes forming part of the Consolidated Financial Statements( ` in million)2013 201217. Inventories(As taken, valued and certified by management)Raw materials [includes Goods in transit `3,408.23 million ( `2,775.64 million)] 13,872.33 13,377.51Work/Goods in process 3,299.48 1,638.87Finished Goods 6,340.35 8,527.48Stores and Spares 2,156.66 2,088.57Total 25,668.82 25,632.42( ` in million)2013 201218. Trade receivables(Unsecured and considered good, unless otherwise stated)Over six monthsConsidered good 1,903.32 1,970.57Considered doubtful 131.50 91.51OthersConsidered good 15,710.70 13,289.35Considered doubtful 8.01 8.0117,753.53 15,359.44Less: Provision for doubtful debts 139.51 99.52Total 17,614.02 15,259.93( ` in million)2013 201219. Cash and Bank BalancesCash and Cash EquivalentsBalances with Banks- Current Accounts 5,728.51 6,651.23- Deposits having original maturity period of less than three months 376.54 1,877.80Cheques on hand 1.18 36.20Cash on hand 22.61 18.42Other bank balancesDeposits having original maturity period of more than three months but less than twelve months 143.01 687.35Deposits having original maturity period of more than twelve months – 0.18Margin money deposits 642.33 837.01Unclaimed dividend accounts 5.30 5.20Balances with banks - Current accounts* 11.48 25.56Balances with escrow account/restricted cash in banks 112.78 116.43Total 7,043.74 10,255.37*being balance in Debt Service Reserve Account, not available for use by the Group.123
Notes forming part of the Consolidated Financial Statements( ` in million)2013 201220. Short-term loans and advances(Unsecured considered good unless otherwise stated)Deposits- Related Parties 37.28 37.28- Others 89.88 101.74Inter-corporate deposits 356.37 350.00Other loans and advancesAdvances recoverable in cash or kind 1,430.01 1,868.91Balance with government authorities- Direct tax (net) 251.09 11.39- Indirect tax 3,358.39 3,482.14Prepaid expenses 213.45 114.38Loans and advances to employees 17.62 42.145,270.57 5,518.96Less: Provision for doubtful advances 253.86 198.48Total 5,500.23 5,809.50( ` in million)2013 201221. Other current assetsInterest accrued on- Current Investments 303.50 695.54- Fixed Deposits 33.61 45.79- Others 34.65 19.54Receivable towards claim 400.58 76.31Export benefits receivable 887.69 245.88Assets held for disposal 19.49 9.61Unbilled work-in-progress 2,129.32 1,114.56Unamortized ancillary borrowing costs 60.38 25.03Total 3,869.24 2,232.26( ` in million)2013 201222. Revenue from operationsRevenue fromSale of products 98,854.20 80,047.91Traded goods 62.04 19.34Sale of services 196.82 479.40Civil contracts 7,643.49 7,789.97Toll collection 728.96 693.81Other operating revenues (Refer Note 41) 6,471.26 4,416.89Revenue from operations (gross) 113,956.77 93,447.32Less: Excise duty 5,256.27 3,681.56Revenue from operations (net) 108,700.50 89,765.76124
Notes forming part of the Consolidated Financial Statements( ` in million)2013 201223. Other incomeInterest from- Current Investments 1,262.67 746.92- Fixed Deposits 250.09 330.30- Others 406.93 262.05Dividend income 277.23 445.11Profit on sale of Investments 368.00 239.87Profit on sale of tangible assets (net) 1.22 0.10Gas transportation refund 2.44 133.14Miscellaneous income 541.82 518.35Total 3,110.40 2,675.84( ` in million)2013 201224. Cost of material consumedInventory at the beginning of the year 10,601.87 6,289.95Add: On acquisitions – 3,148.66Purchases (net) 70,962.79 62,410.6481,564.66 71,849.25Less: Inventory at the end of the year 10,464.10 10,601.87Total 71,100.56 61,247.38( ` in million)2013 201225. Purchases of traded goodsPurchases of traded goods 144.06 378.37Total 144.06 378.37( ` in million)2013 201226. Changes in Inventories of finished goods, work/goods in processInventories at the end of the yearWork / goods-in-process 3,518.76 1,833.10Finished Goods 6,340.35 8,527.489,859.11 10,360.58Inventories at the beginning of the yearWork / goods-in-process 1,833.10 1,197.02Finished Goods 8,527.48 5,835.24Add: On acquisitions – 613.6710,360.58 7,645.93Total 501.46 (2,714.65)( ` in million)2013 201227. Employee benefit expensesSalaries, Wages and Bonus 5,584.13 4,508.41Contribution to Provident and other funds 187.16 130.20Employee compensation expenses (6.60) (1.51)Staff Welfare Expenses 310.10 238.59Total 6,074.79 4,875.68125
Notes forming part of the Consolidated Financial Statements( ` in million)2013 201228. Other expensesStore and spares consumed 2,522.97 2,375.99Coating and other job charges 4,313.66 1,440.32Power, fuel and water charges 2,382.29 1,923.68Freight, material handling and transportation 5,615.26 3,504.95Excise duty on (increase)/decrease on stock 270.09 (9.25)Construction costs- Sub-contract costs 1,105.02 1,234.42- Plant hire costs 729.42 560.70- Tools and equipment 141.64 80.61- Temporary site installations 54.48 160.14- Labour charges 181.38 170.97Rent 564.32 397.43Rates and taxes 743.99 689.62Repairs and maintenance- Plant and machinery 274.37 342.89- Buildings 40.75 48.10- Others 253.85 169.21Travelling and conveyance expenses 458.14 370.26Communication expenses 59.96 40.15Professional and consultancy fees 560.47 540.81Insurance 328.91 242.71Directors' sitting fees 1.91 1.11Printing and stationery 45.99 32.78Security charges 49.45 34.66Membership and subscription 29.97 19.37Vehicle expenses 24.84 20.34Exchange difference (net) 1,272.90 1,247.66Provision for diminution in value of investment 0.94 –Loss on sale / discard of tangible assets 19.83 12.12Provision for impairment of tangible assets 106.09 –Auditors remuneration 8.89 7.36Product compensation and claims 3.29 649.39Sales promotion expenses 91.88 50.25Liquidated damages 73.21 192.97Commission and discounts on sales 740.79 426.64Provision for doubtful debts and advances (net) 101.07 96.68Bad debts and advances written off 183.04 1.46Miscellaneous expenses 345.93 331.93Total 23,701.00 17,408.42126
Notes forming part of the Consolidated Financial Statements29. Finance costsInterest expense( ` in million)2013 2012- Term loans 1,556.25 1,157.19- Debentures/bonds 1,999.76 1,602.62- Working capital 186.57 268.65- Others 81.76 43.41Other borrowing costs 1,106.42 657.72Exchange difference (net) – 269.6430 Infratech Business - Build, Operate and Transfer (BOT) AssetsTotal 4,930.77 3,999.241) The Group has undertaken various projects on Build, Operate and Transfer - BOT basis as per concession agreements with theGovernment authorities. In respect of such projects, the construction costs including interest incurred during the year has beenrecognized as an intangible asset, in accordance with Accounting Standard (AS-26) -“Intangible Assets”. The details of BOTAssets are as under :( ` in million)Build, Operate and Transfer Contract Ownership Concessional Period Amortization-BOT Project 2013 2012Jalandhar Bus Terminal Punjab Infrastructure 8 Years, 5 Months 27.99 24.14Project Development Board and 2 daysLudhiana Bus Terminal Punjab Infrastructure 10 Years, 3 Months 21.92 17.92ProjectDevelopment BoardHoshangabad–Harda– Madhya Pradesh Road 15 years 316.71 24.02Khandwa Road Project#Development AuthorityRaisen–Rahatgarh Madhya Pradesh Road 15 years 163.29 17.35Road ProjectDevelopment AuthorityKim Mandvi Corridor Gujarat State Road 20 Years 15.44 9.83Project#Development Corporation LimitedHimmatnagar bypass Project Gujarat State Road Development 15 years 5.68 6.72CorporationDewas Bhopal Corridor Madhya Pradesh Road 25 Years 59.15 41.71ProjectDevelopment AuthorityKon-Sawle-Turade Road Public Works Department, 15 Years 7.04 7.15ProjectMaharashtra# Hitherto up to 31st March 2012 expenditure incurred on above Build, Operate & Transfer projects, was amortized / written off after reducing the “CashSubsidy” received from the total cost on the basis of projected toll revenue over the period of concession. Based on the expert opinion received , theGroup has changed the policy and the said BOT Expenditure is amortized / written off without deducting the Cash Subsidy received retrospectively, Hadthere been no change in the method of amortization, the amount of amortization and loss for the year would have been lower by ` 423.81 million andreserves and surplus would have been higher to that extent.2) Cash Subsidy of `1,265.38 Million received in the earlier years from Madhya Pradesh Road Development Corporation andGujarat State Road Development Corporation for the Build, Operate and Transfer (BOT) Project has been shown as CapitalReserve under ‘Reserves and Surplus’ in respect of subsidiary in the business of infrastructure. Till previous year this has beenmatter of qualification in its audit report. However in light of expert opinion obtained by the said subsidiary and change inaccounting policy on amortization, it has complied with Accounting Standard 12 (Accounting for Government Grants) andSchedule XIV and the subsidy being in nature of promoter contribution is disclosed as capital receipt under reserve and surplus.31 Foreign exchange differencesa) Loss on account of difference in foreign exchange on realignment/realization and on cancellation of derivative instrumentsamounting to ` 1,272.90 million ( ` 1,247.66 million) and ` Nil ( ` 269.64 million) is accounted in other expenses and financecosts respectively other than (b) below.127
Notes forming part of the Consolidated Financial Statementsb) The Companies (Accounting Standards) Amendment Rules 2011 has amended the provision of AS-11 related to "The effects ofchanges in Foreign Exchange Rates" vide notification dated 11 May 2011 (as amended on 29 December 2011 and furtherclarification dated 9 August 2012) issued by the Ministry of Corporate Affairs. Accordingly, the Company has adjusted exchangedifference loss amounting to ` 361.90 million ( ` 695.83 million) to the cost of fixed assets and capital work in progress andexchange difference loss of `648.88 million ( ` 612.53 million) is transferred to "Foreign Currency Monetary Item TranslationDifference Account" to be amortized over the balance period of such long term liabilities. Out of the above, loss of ` 373.50million ( `289.56 million) has been adjusted in the current year and loss of `275.37 million ( `322.97 million) has been carriedover and disclosed in shareholders funds.c) The Group has early adopted AS-30 and accordingly loss of ` 44.84 million ( ` 178.18 million) related to foreign exchangedifference on Cash Flow Hedges for certain firm commitments and forecasted transactions is recognized in Shareholders’ Fundsand shown as Hedging Reserve Account.32 Operating leasei) The Group leases office, residential facilities, equipment etc. under operating lease agreements that are renewable on aperiodic basis at the option of both the lessor and the lessee. The initial tenure of lease is generally for eleven months.ii)( ` in million)2013 2012Lease rental charges for the year 564.32 397.43Future lease rental obligations payable (under non-cancellable leases)Not later than one year 164.03 138.55Later than one year but not later than five years 299.74 394.83Later than five years 24.25 5.34In case of a subsidiary engaged in the manufacturing of sponge iron, provides mini bulk carriers and barges on hire basisregularly. Income from hire charges is ` 149.58 million ( ` 77.75 million).33 a) Contingent liabilities not provided for( ` in million)2013 2012Performance guarantees/Bid bond given by banks to Group’s customers / government 22,681.74 25,383.00authorities etc. #Corporate guarantees given by the Group 3,580.76 4,352.28Bills discounted 681.54 886.74Letters of credit outstanding (net of liability provided) for Group’s sourcing 4,439.96 8,612.76Claims against the Group not acknowledged as debts#2,096.47 539.39Custom duty on pending export obligation against import of Raw Materials and Machineries 1,387.25 961.18Disputed direct taxes #* 4,065.53 –Disputed indirect taxes#^1,324.51 1,191.43# include share of joint ventures (Refer note 39)*Income tax demands mainly include appeals filed by the Group before appellate authorities against disallowances i.e.depreciation/claims/deductions. The management is of the opinion that its tax disputes will be decided in its favour and no material tax liability is likelyto be sustained, hence no provision is considered necessary.i) ^Demand notice received during the year for duty evasion of ` 8,609.82 million on account of alleged wrong classification of imported rawmaterials along with penalty of ` 8,609.82 million and penalty of ` 205 million on directors and officers of the company. In the opinion ofmanagement, without prejudice to overall merits, in any case ` 6,706.60 million is cenvatable duty which is revenue neutral and may not resultinto recoverable demand and accordingly relevant amount of penalty may not sustain. The matter is under dispute with appellate authority andthus whole amount of duty and penalty referred above is not considered as contingent liability.ii) In the case of a subsidiary engaged in the manufacturing of sponge iron, show cause notices amounting to ` 2,913.78 million ( ` 2,203.03 million)are received alleging wrong availment of custom duty and utilization of input credit on import of raw material. The said subsidiary has replied to allthese notices and does not expect any monetary liability on the basis of opinion obtained. However this duty is cenvatable, hence revenue neutraland not shown above under contingent liability.b) In case of a subsidiary engaged in the manufacturing of sponge iron, the lenders have the right to recompense the reliefs /sacrifices / waivers extended by the respective lenders as per the prevailing RBI guidelines.128
Notes forming part of the Consolidated Financial Statementsc) Capital and other commitments34 Taxationi) Estimated amount of contracts remaining to be executed on capital account (net of advances) is ` 1,187.95 million( ` 12,557.84 million).ii) Other long-term commitments is `5,345.75 million ( `3,562.26 million).iii) The Group has committed to provide continued financial support to subsidiaries/associates based on the requirementfrom time to time.iv) In case of a subsidiary engaged in the manufacturing of sponge iron, long term contract for purchase of raw materials toensure uninterrupted supply of raw material, however does not have any financial commitmentv) In case of a subsidiary engaged in the manufacturing of sponge iron, as per the terms of the restructuring package, theGroup is also liable to issue Zero Coupon Optionally Convertible Debentures (ZCOCD) to the term lenders to the extent ofpresent value of sacrifice amount outstanding as at 31 March 2013 i.e. ` 145.88 Million in favour of the term loans lenders.i) Current income tax is calculated on the results of individual companies in accordance with local tax regulations.ii) In case of a subsidiary engaged in the manufacturing of sponge iron, there was Search and Seizure action by Income TaxDepartment on 13 October 2010. Later, on the basis of records and enquiries from officers/staff, the said subsidiary throughaffidavit of directors disowned the income offered in the statement u/s 132(4) of the Income Tax Act, 1961 pertaining to incomeof ` 320 million for the financial year ended 31 March 2010 and capital expenses of ` 50 million during the period ended30 September 2011. Hence the relevant declaration u/s 132 (4) of income has not been given effect in its books of account.However, required provision for tax considering the declaration of income u/s. 132 (4) is made in the relevant year and theabove referred income is offered to tax and assessed during the year.iii)#include share of joint ventures (Refer note 39)#The international transactions with Associated Enterprises (AE's) are at arm's length price as per the independent accountantsreport for the year ended 31 March 2012. Further, the Finance Bill, 2012 had sought to bring in certain class of indian domestictransactions in the ambit of the transfer pricing regulations with effect from 1 April 2012. The Management is of the opinionthat its international transactions with AE's and the specified domestic transactions for the year are at arm's length price andwill not have any impact on the amount of tax expense and provision of taxation in these financials.35 Exceptional itemsa. Adani Welspun Exploration Ltd, a Joint venture company has charged off ` 1,547.70 million ( ` Nil) being the expenditure onabortive exploration activities on the relinquishment of Thailand Blocks being geologically impracticable and technoeconomically not feasible. In view of the above the Group has charged off its share (representing 35%) of `541.70 million ( `Nil)funded on Thailand project.b. In case of subsidiary in the business of Infrastructure, `55.18 Million is charged to statement of profit and loss and `3.19 millionadjusted in general reserve on dilution of stake in one of its joint venture.c. In case of subsidiary in the business of sponge iron, the expansion of the existing Sponge Iron facility, setting up Integrated SteelMelting Shop and Captive Power Plant are temporarily put on hold due to regulatory approvals from Maharashtra Coastal Zoneand non availability of Natural Gas (key Raw Material). Accordingly, ` 493.99 million being project related expenses have beencharged off in the financials.36 Segment reportingThe Group follows AS 17- Segment Reporting relating to the reporting of financial and descriptive information about their operatingsegments in financial statements.The Group’s reportable operating segments have been determined in accordance with the internal management structure which isorganized based on the operating business segments as described below:Steel products which principally consist of manufacture and sale of steel pipes, plates and coils and Gas based Sponge Iron (DirectReduced Iron - DRI and Hot Briquetted Iron - HBI).Infrastructure comprises development, operations and maintenance basic infrastructure projects, toll collection, development ofurban infrastructure and providing related advisory services.Others include Oil and Gas, Energy business and development of Jetty Project (upto 20 March 2013).129
Notes forming part of the Consolidated Financial Statementsa) Primary segments (business segments):( ` in million)2013 2013 2013 2013Steel Products Infrastructure Others TotalNet sales/income from operationsSegment revenue 99,788.45 9,229.68 – 109,018.13Less: Inter segment revenue 317.63 – – 317.63Total external revenue 99,470.83 9,229.68 – 108,700.50Segment results before exceptional items 2,510.52 (92.26) (0.83) 2,417.43Exceptional Items 493.99 55.18 541.70 1,090.87Segment results after exceptional items 2,016.53 (147.44) (542.53) 1,326.56Finance costs 4,930.77Unallocated Income net of unallocated (expenditure) 3,110.40Profit / (Loss) before tax (PBT) (493.81)Tax expense 390.31Profit / (Loss) after taxes (PAT) before minority interest andshare of profit / (loss) from associates (884.12)Share of profit/ (loss) from associates (37.96)Minority interest (218.85)Profit / (Loss) after tax (PAT) (703.23)Other informationSegment assetsUnallocated corporate assetsTotal assetsSegment liabilitiesUnallocated corporate liabilitiesTotal liabilitiesCapital expenditure (including capital advances)Depreciation / amortization (included in segment expenses)120,209.2441,021.184,229.893,898.1320,227.295,035.522,904.37863.052,458.60165.27431.080.04142,895.1426,018.45168,913.5946,221.9666,113.98112,335.947,565.334,761.21( ` in million)2012 2012 2012 2012Steel Products Infrastructure Others TotalNet sales/income from operationsSegment revenue 80,847.97 8,969.95 89,817.92Less: Inter segment revenue 52.16 – 52.16Total external revenue 80,795.81 8,969.9589,765.76Segment results 4,299.88 762.18 (6.73) 5,055.33Finance costs 3,999.24Unallocated income net of unallocated (expenditure) 2,675.84Profit before tax (PBT) 3,731.92Tax expense 1,502.77Profit after taxes (PAT) before minority interest andshare of profit / (Loss) from associates 2,229.15Share of profit/ (loss) from associates 14.38Minority interest 141.90Profit after tax (PAT) 2,385.43130
Notes forming part of the Consolidated Financial StatementsOther informationSegment assets 108,321.57 16,890.92 1,956.60Unallocated corporate assetsTotal assetsSegment liabilities 41,369.65 4,424.52 102.20Unallocated corporate liabilitiesTotal liabilitiesCapital expenditure (including capital advances) 10,692.74 1,426.82 461.27Depreciation / amortization (included in segment expenses) 3,130.54 384.66 0.03b) Secondary segments (geographical segments):( ` in million)2012 2012 2012 2012Steel Products Infrastructure Others Total127,169.0930,873.77158,042.8645,896.3771,213.80117,110.1712,580.823,515.23( ` in million)2013 2012India Outside Total India Outside TotalIndiaIndiaRevenue from operations 39,611.05 69,089.47 108,700.50 43,626.40 46,139.36 89,765.76Carrying amount of segment assets 127,049.48 41,864.10 168,913.59 127,482.13 30,560.73 158,042.86Capital expenditure 2,692.21 4,873.13 7,565.33 10,621.59 1,959.24 12,580.8237 Related Party Disclosuresa) List of Parties where control exists: The list of Subsidiaries is disclosed in Note 1, I (d) above.b)c)d)Joint VenturesThe list of joint ventures is disclosed in note 1 I(f) aboveAssociatesRed Lebondal Limited, Welspun Energy Limited and Welspun Captive Power Generation LimitedOther related parties with whom transactions have taken place during the year and balances outstanding as on the last dayof the year.Welspun India Limited, Welspun Steel Limited, Welspun Retail Limited, Welspun Anjar SEZ Limited, Welspun Foundation forHealth and Knowledge, Welspun Syntex Limited, Vipuna Trading Limited, Welspun Logistics Limited, Welspun Realty PrivateLimited, Welspun Enterprises (Cyprus) Limited, Remi Metals Gujarat Limited, Welspun Global Brands Limited,Welspun UKLimited, Welspun Marine Logistics Private Limited, Welspun Developers and Infrastructure Private Limited,Welspun InfraDevelopment and Management Private Limited, Welspun Wintex Private limited,Welspun Fin Trade Private Limited,WelspunMercantile Limited.Directors / Key Management PersonnelNameNature of RelationshipB. K. Goenka Chairman^R. R. Mandawewala Director*Braja MishraManaging Director**^Executive Chairman upto 13 August 2012*Managing Director upto 26 April 2012**Appointed w.e.f. 26 April 2012131
Notes forming part of the Consolidated Financial StatementsTransactions with related parties for the year ended 31 March 2013Sale of goods, services and recoveriesSale of fixed assetsOther incomePurchase of goods and servicesRent and license fees paidDonationsReimbursement of expenses (net)Directors remunerationLoans, advances and deposits givenLoans, advances and deposits receivedLoans, advances and deposits received repaidInvestment in sharesSale of equity sharesShare application money givenShare application money repaid / adjustedBalances with related parties for the year ended 31 March 2013( ` in million)Joint Associates Other Key TotalVenture^ Related ManagementParties Personnel– 425.47 1,846.60 – 2,272.0796.50 2.90 3,058.41 – 3,157.81– – 4.84 – 4.84– – 0.48 – 0.48– – 11.98 – 11.98– – 17.98 – 17.98– 241.23 236.28 – 477.51– – 325.00 – 325.00– – 85.48 – 85.48– – 76.12 – 76.12– – 80.75 – 80.75– – 22.65 – 22.65– 0.01 69.41 – 69.42– – 51.68 – 51.68– – – 156.22 156.22– – – 33.55 33.55– – – – –– – 72.91 – 72.91– – 13.50 – 13.50– – 10.29 – 10.29– – 9.87 – 9.87– – 58.95 – 58.95– 799.56 0.10 – 799.66– 260.01 – – 260.01– – 0.16 – 0.16– – 0.13 – 0.13– 8.00 – – 8.00– 2,594.77 215.00 – 2,809.77– 881.21 – – 881.212,003.40 150.78 – 2,154.18( ` in million)Joint Associates Other Key TotalVenture^ Related ManagementParties PersonnelLoans and advances, deposits given––––346.88391.61––346.88391.61Corporate guarantees given2,624.981,470.003,579.303,529.301.46822.97––6,205.755,822.27Investments in shares––1,110.15267.820.770.77––1,110.92268.59Share application money––21.55699.76–195.00––21.55894.76Trade receivables––67.00–67.03515.34––134.03515.34Trade payables*[ ` Nil (1187)]–0.0026.93–118.859.54––145.789.54* Denotes figures less than ` 10,000. ^ Transactions with joint venture has been reported at full value.132
Notes forming part of the Consolidated Financial StatementsDisclosure in respect of transactions which are more than 10% of the total transactions of the same type with related partiesduring the year:i) Sale of goods and recoveries - Welspun India Limited ` 1,269.28 million ( ` 1,022.46 million), Welspun Steel Limited`550.56 million ( `418.62 million), Remi Metals Gujarat Limited `22.68 million ( `696.65 million), Welspun Captive PowerGeneration Limited `418.18 million ( `902.32 million)ii) Sale of fixed assets – Welspun India Limited `4.37 million (Nil), Welspun Steel Limited `0.47 million ( `0.48 million).iii) Other income – Remi Metals Gujarat Limited `11.29 million ( `17.98 million).iv) Purchase of goods and services - Welspun Steel Limited ` 165.80 million ( ` 261.96 million), Welspun Logistics Limited`61.78 million ( `56.82 million),Welspun Captive Power Generation Limited `241.23 million ( `Nil)v) Rent and license fee paid – Welspun Realty Private Limited `76.66 million ( `67.55 million), Vipuna Trading Limited `5.64million ( ` 4.42 million)vi) Donation paid – Welspun Foundation for Health and Knowledge ` 80.75 million ( ` 22.65 million) (meant for corporatesocial responsibility activities).vii) Reimbursement of expenses (net) - Welspun India Limited ` 51.37 ( ` 42.66 million), Welspun Steel Limited ` Nil( `7.63 million), Welspun Syntex Limited `13.10 million ( `Nil).viii) Loans, advances and deposits given - Welspun Captive Power Generation Limited ` Nil ( ` 22.76 million), Welspun SteelLimited `Nil ( `43.04 million).ix) Loans and advances received from Welspun India Limited `13.50 million ( `9 million), Welspun Captive Power GenerationLimited `Nil ( `1.29 million).x) Loans and advances received repaid to Welspun India Limited ` 9.87 million ( ` 23.95 million), Welspun Captive PowerGeneration Limited `Nil ( `35 million).xi) Investment in equity shares of – Welspun Energy Limited ` 648.11 million ( ` 260.01 million),Welspun Captive PowerGeneration Limited `151.45 million ( `Nil).xii) Sale of investments - Welspun Constructions Private Limited `Nil ( `0.13 million) and Dahej Infrastructure Private Limited`0.06 million ( `Nil) to other related parties, Welspun Infra Development and Management Private Limited ` 0.10 million( ` Nil) to other related parties.xiii) Share application money given to Welspun Energy Limited `Nil ( `2,594.77 million), Welspun Captive power GenerationLimited `8 million ( `215 million).xiv) Share application money given includes repaid / adjusted by Welspun Energy Limited `699.76 million ( `2,003.40 million),Welspun Captive Power Generation Limited `181.45 million ( `150 million).xv) Details of remuneration paid to key management personnels are disclosed at note 45 below.Closing balances as at 31 March 2013i) Loans, advances and deposits given- Welspun Realty Private Limited `284.48 million ( `320.48 million), Welspun LogisticsLimited `52.40 million ( `52.40 million).ii) Guarantees and collaterals given – Welspun Captive Power Generation Limited `600 million ( `600 million), Welspun UrjaGujarat Private Limited `1,709.30 million ( `1,709.30 million), Welspun Energy Limited `1,270 million ( `1,270 million),Northwest Energy Private Limited ` Nil ( ` 550 million), Adani Welspun Exploration Limited ` 2,624.98 million( ` 1,470 million)iii) Investments held – Welspun Enterprises (Cyprus) Limited ` 0.77 million ( ` 0.77 million),Welspun Energy Limited`910.85 million ( `262.74 million), Welspun Captive Power Generation Limited `199.27 million ( `0.05 million)iv) Advances outstanding - Welspun India Limited `Nil ( `3.24 million).v) Share application money outstanding – Welspun Energy limited ` Nil ( ` 699.76 million), Welspun Captive powerGeneration Limited `21.55 million ( `195 million).vi) Trade receivables – Remi Metals Gujarat Limited ` 11.23 million ( ` 380.49 million), Welspun Captive Power GenerationLimited ` 67 million ( ` 119.82 million), Welspun India Limited ` 15.24 million ( ` 15.04 million), Welspun Steel Limited`40.15 million ( `Nil).vii) Trade payables – Welspun Retail Limited ` 0.47 million ( ` 2.57 million), Welspun Steel Limited ` 21.19 million( `6.96 million), Welspun Captive Power Generation Limited `26.93 million ( `Nil),Welspun India Limited `41.62 million( `Nil), Welspun Anjar SEZ Limited `50.18 million ( `Nil).133
Notes forming part of the Consolidated Financial Statements38 Disclosure in accordance with Accounting Standard 7 (Revised) ‘Construction Contracts’39 The Group has the following joint ventures as on 31 March 2013 and its percentage holding is given below( ` in million)2013 2012Contract revenue 33,371.07 26,738.12Contract cost Incurred 28,297.11 22,615.01Recognized Profit/Loss 5,073.95 4,640.33Advances received 994.11 883.63Retention money 632.74 572.12Gross amount due from customers for contract work 1,391.88 1,471.92Name of the Joint VenturesDirect Joint VenturePercentage (%) Holding2013 2012Dahej Infrastructure Private Limited (upto 20 March 2013) – 50.00%Through Welspun Natural Resources Private LimitedAdani Welspun Exploration Limited 35.00% 35.00%Through Welspun Projects LimitedDewas Bhopal Corridor Limited 50.00% 50.00%BUL MSK Infrastructure Private Limited 50.00% 50.00%Through Welspun Infratech LimitedLeighton Welspun Contractors Private Limited(increased from 35% to 39.88% w.e.f. 28 March 2013) 39.88% 35.00%The proportionate share of assets, liabilities, income, expenditure, contingent liabilities, other commitments and capitalcommitment of the joint ventures companies included in the consolidated financial statements are given below:( ` in million)2013 2012AssetsNet block (including capital work-in-progress) 5,085.46 4,351.85Non-current investments 28.43 13.84Deferred tax assets (Net) 127.43 82.41Long-term loans and advances 1,243.43 684.41Other non-current assets 327.50 280.71Inventories 93.51 68.25Trade receivables 1,146.22 867.24Cash and bank balances 423.20 927.69Short-term loans and advances 573.61 496.30Other current assets 2,079.12 920.33( ` in million)2013 2012LiabilitiesReserves and surplus 2,180.30 631.32Long-term borrowings 2,232.81 1,927.14Long-term provisions 36.81 506.19Deferred tax liabilities (net) – 35.04Short-term borrowings 121.57 815.71Trade payables 2,714.12 1,706.63Other current liabilities 1,796.69 836.85Short-term provisions 125.96 47.15134
Notes forming part of the Consolidated Financial Statements( ` in million)2013 2012RevenueRevenue 5,863.16 5,963.40Other income 191.83 69.56ExpenditureCost of materials consumed 1.56 10.62Employee benefits expense 762.30 706.32Other expenses 4,630.42 4,395.23Profit before finance costs, depreciation/amortization and tax 660.71 920.79Finance costs 298.30 313.47Depreciation and amortization expense 245.10 203.36Profit/(Loss) before exceptional item and tax 117.31 403.96Exceptional item 541.70 –Profit / (Loss) before tax (424.39) 403.96Tax expense 45.09 128.88Profit / (Loss) after tax (469.48) 275.09Contingent liabilities 6,165.43 5,104.64Other commitments 95.75 312.26Capital commitments 93.17 76.4840 Earnings Per Share (EPS)( ` in million)2013 2012I) Profit computation for Basic and Diluted EPSProfit after tax ( ` in million) (703.23) 2,385.43Add: Interest on Foreign Currency Convertible Bonds (net of tax) ( ` in million) – 149.98Add: Interest on Compulsorily Convertible Debentures (net of tax) ( ` in million) – 165.61Net profit for Diluted EPS ( ` in million) (703.23) 2,701.02II) Weighted average number of equity shares for EPS computationa) For Basic EPS (Nos.) 231,836,824 219,028,187b) For Diluted EPS (Nos.) 231,836,824 278,200,370III) EPS on Face Value of ` 5/- eachBasic ( `) (3.03) 10.89Diluted ( `) (3.03) 9.71*For the current year, foreign currency convertible bonds, Compulsory convertible debentures and Employee stock options plan are anti dilutive and ignoredin the calculation of diluted earnings per share.41 Other operating revenues( ` in million)2013 2012Scrap sales 1,458.61 1,672.44Value added tax incentive 1,359.68 670.30Export benefits 981.78 483.77Insurance claim 1,273.04 –Income from transfer of business#648.07 –Excess provisions written back – 1,135.91Others 750.08 454.46Total 6,471.26 4,416.89# During the year, the subsidiary in the business of Infrastructure namely Welspun Projects Limited (WPL) has transferred its indentified EPC work related toRoad Projects and Water division to Leighton Welspun Contractors Private Limited (LWIN) for composite consideration of ` 1150.35 million. In respectthereof, WPL has received 1,15,03,485 equity shares in the LWIN, of the face value of `10/ each fully paid up at a premium of `90/ per share aggregatingconsideration of `1,150.35 million. Gain of `648.07 million (after inter group elimination of `431.18 million) arising in respect of the said transfers has beenshown as 'income from transfer of business' under the head “Other Operating Revenue”.135
Notes forming part of the Consolidated Financial Statements42 The Group had collected VAT of ` 368.75 million on sales in earlier years which was not paid to VAT authorities and shown asliabilities, claiming it within VAT incentive limit and VAT authorities disputed the sanctioned claim. During the year, claim of theGroup is accepted in assessment order of earlier years by VAT authorities; hence the VAT collected is accounted as income andreported under other operating revenues.43 In the case of a subsidiary engaged in manufacturing of sponge iron:(a) The production and profitability has suffered due to the decreased availability of gas from the gas suppliers at economic ratesfrom May 2011, and eventually become Nil. The problem further compounded by the reduction in natural gas supply from thegas suppliers also and will continue to have impact untill the required gas supply is restored. The special leave petition (SLP) filedby the said subsidiary along with other affected parties in the Supreme Court of India against Government of India forrestoration of supply of Gas is still pending. In order to reduce the cost, the Company has initiated project for alternate source ofgas supply by installing the Coal Gasifiers, the cost thereof will be significantly lower than present market price of RLNG. Alsodependency on RLNG will reduce substantially.(b) The Group has revalued its Land, Building, Plant and Machinery and Capital Work-in-progress and Gross block as at 31 March2013 based on the valuation report issued by a registered valuer and restated the net book value by adding therein the additionof ` 6,564.12 million to fixed assets.(c) Capital advances include ` 1,476 million given for capital project which is temporary put on hold as supplies not taken. TheSupplier terminated contract and matter was referred to arbitrator who has awarded for forfeiture of advance of ` 1,476 millionand other claims of ` 57.15 million. The Group is exploring various options, subject to legal opinion, to challenge award and noadjustments have been made in these financials in respect thereof.44 Acquisition of 7.5% stake in Leighton Welspun Contractors Private Limited ("LWIN") by Welspun Projects Limited ("WPL")against assignment of EPC rightsDuring the current year, LWIN has purchased from WPL the EPC business of the Water Division as a going concern by way of a slumpsale along with the right to undertake Road Projects. In consideration of the aforesaid transfer, LWIN allotted and issued to WPL11,503,485 equity shares of ` 10 each, fully paid (comprising of 7.5% stake) amounting to ` 1,150.35 Million. As a result stake ofGroup in LWIN is increased to 39.88%.Goodwill arising on consolidation is ` 790.91 Million.As per consolidation policy of the Group,unrealized margin to ` 431.18 Million has been eliminated.45 Managerial remuneration( ` in million)Name Relation 2013 2012B. K. Goenka1Chairman 17.38 14.28R. R. Mandawewala Director* 0.83 10.00Braja Mishra Managing Director** 138.01^ –M. L. Mittal Executive Director Finance^^ – 5.60Asim Chakraborty#Whole Time Director – 3.67Total 156.22 33.551Executive Chairman upto 13 August 2012; *Managing Director upto 26 April 2012 **Appointed w.e.f. 26 April 2012#^^Resigned w.e.f 30 September 2011 Resigned from Directorship w.e.f. 4 October 2011^Remuneration paid to Managing Director has turned out to be in excess of the limits specified u/s 198 read with Schedule XIII of the Companies Act,1956 by `78.67 million ( `Nil) due to inadequate profit during the year. The approval of Company's application to the Central Government for excessremuneration is awaited.46 ComparativesPrevious years figures have been regrouped, reclassified wherever necessary to correspond with current year's classification /disclosures. The CFS is not comparable, in view of subsidiaries incorporated/acquired/divested during the current and previous year.As per our attached report of even dateFor and on behalf of the BoardFor MGB & Co. B.K.Goenka Braja MishraChartered Accountants Chairman Managing DirectorFirm Registration Number 101169WJeenendra Bhandari B.R.Jaju Pradeep JoshiPartner Chief Financial Officer Company SecretaryMembership Number 105077Mumbai, 30 May 2013136
Consolidated Cash Flow Statement for the year ended 31 March( ` in million)2013 2012A) Cash flow from operating activitiesProfit / (Loss) before tax (after exceptional item) (493.81) 3,731.92Adjustments for:Depreciation and amortization expense 4,761.21 3,515.23Interest expense 3,824.34 3,071.88Interest income (1,919.69) (1,339.27)Loss on sale/discard of fixed assets (net) 18.61 12.02Impairment of fixed assets 106.09Profit on sale of investments (368.00) (239.87)Dividend income (277.23) (445.11)Income from transfer of business (refer note 41) (650.15)Dilution of stake in joint venture (refer note 35 (b)) 55.18Provision for doubtful debts and advances (net) 96.22 96.68Provision for diminution in value of non current investments 0.94Employee compensation expenses (net) (6.60) (1.51)Exchange adjustments (net) (825.51) 412.13Operating profit before working capital changes 4,321.60 8,814.10Adjustments for:Trade and other receivables (3,895.57) 4,656.09Inventories (36.40) (3,360.04)Trade and other payables 863.48 5,628.96Cash generated from operations 1,253.11 15,739.11Direct taxes paid (net of refunds) (172.80) (1,452.64)Net cash from operating activities (A) 1,080.31 14,286.48B) Cash flow from investing activitiesPurchase of fixed assets (including capital work in progress) (6,878.34) (4,985.26)Sale of fixed assets 300.62 88.16Investment in Subsidiaries (8,119.90)Investment in Joint Venture and Associates 36.32 (5,112.40)Divestment of stake in Subsidiary 0.13Divestment of stake in Joint Venture 0.06Sale/(Purchase) of current investments (net) 2,304.98 (4,788.93)(Increase)/decrease in share application money given (21.55) (412.29)Dividend received 277.23 445.11Interest received 2,308.80 831.45Net cash used in investing activities (B) (1,671.88) (22,053.94)C) Cash flow from financing activitiesProceeds from issue of equity shares (including securities premium) (Refer note 2) 10.27 5,079.47Proceeds from issue of debentures 3,371.60 7,883.75Redemption of debentures (1,700.00)Prepayment of Foreign currency convertible bonds (3,484.94)Proceeds from long term borrowings (net) 11,926.46 2,250.00Repayment of long term borrowings (net) (5,048.43) (4,700.48)Increase/(Decrease) in short term borrowings (net) (3,744.73) 1,152.09Payment from minority shareholders 1,000.00Dividend paid (including corporate dividend tax) (132.47) (475.07)Interest paid (3,845.57) (2,555.54)Net cash from financing activities (C) (2,647.82) 9,634.21Net changes in cash and bank balances (A+B+C) (3,239.40) 1,866.75Cash and bank balances at the beginning of the year 10,255.37 7,508.49Cash and bank balances taken over on acquisition of subsidiaries and joint venture 27.77 880.13Cash and bank balances at the end of the year 7,043.74 10,255.37Notes: 1. Cash and bank balances at end of year includes unrealised Loss of `8.76 million (Unrealised profit of `29.11 million) which is on account of realignmentof current account/fixed deposits held in foreign currency.2. During the year, conversion of Compulsory Convertible Debentures of ` 7883.75 million into equity shares and allotment of equity shares against shareapplication money of ` 894.76 million by associates is not considered in the above statement being non cash transaction.3. Cash and Bank balances include `771.89 million ( `984.20 million) which is not available for use by the Group.4. Previous year's figures have been regrouped/recast wherever necessary.As per our attached report of even dateFor and on behalf of the BoardFor MGB & Co. B.K.Goenka Braja MishraChartered Accountants Chairman Managing DirectorFirm Registration Number 101169WJeenendra Bhandari B.R.Jaju Pradeep JoshiPartner Chief Financial Officer Company SecretaryMembership Number 105077Mumbai, 30 May 2013137
#Statement pursuant to general exemption under Section 212 (8) of the Companies Act,1956, relating to Subsidiary Companies( ` in mi ion)Sr. Name of the Subsidiary Company Reporting Capital Reserves Total Gross Total Gross Investment Turnover Profit/Loss Provision Profit/Loss Proposed CountryNo. Currency and Share Assets Liabilities other thanbefore for after DividendApplication Investment Taxation Taxation TaxationMoney inPending SubsidiaryAllotment1 We spun Natura Resources INR 18.75 167.71 1,895.93 1,709.47 – – 0.22 0.36 (0.14) – Ind aPr vate L m ted2 We spun P ast cs L m ted INR 11.29 38.03 85.03 35.71 – – (0.02) – (0.02) – Ind a3 We spun Maxstee L m ted INR 1,338.22 5,694.80 19,940.23 12,937.11 29.91 8,948.37 (2,308.44) (301.87) (2,006.58) – Ind a4 We spun P pes Inc US$ 0.54 168.32 2,598.84 7,438.86 5,008.88 – 25.13 – 25.13 – De aware(U.S)5 We spun Tubu ar LLC US$ – 5,880.44 21,574.52 15,694.08 – 18,699.19 509.03 232.35 276.68 – De aware(U.S)6 We spun G oba Trade LLC US$ – (42.62) 208.55 251.18 – 162.75 9.72 – 9.72 – De aware(U.S)###7 We spun P pes L m ted INR 557.14 – 629.42 72.28 – – – – – – Ind a8 We spun Trad ngs L m ted INR 50.13 313.95 6,786.01 6,421.92 – 27,470.75 97.62 33.65 63.97 – Ind a9 We spun Infratech L m ted INR 486.50 1,434.45 6,251.54 4,330.59 – – – – – – Ind a10 We psun Road Projects INR 0.10 – 0.82 0.72 – – – – – – Ind aPr vate L m ted11 We spun Projects L m ted INR 400.00 4,451.50 6,015.27 2,856.03 1,692.26 3,751.64 45.72 (8.91) 54.63 – Ind a12 MSK Projects H mmatnagar INR 2.42 37.14 56.87 17.31 – 26.43 3.86 0.73 3.12 – Ind aByepass Pr vate L m ted13 MSK Projects K m Mandav INR 67.30 35.47 513.12 410.35 – 34.84 (5.83) – (5.83) – Ind aCorr dor Pr vate L m ted14 We psun Infra Projects INR 101.16 2,412.00 546.36 2,820.81 4,787.60 – – – – – Ind aPr vate L m ted15 We psun Energy Transportat on INR 0.10 – 0.12 0.02 – – – – – – Ind aPr vate L m ted16 We spun Water Infrastructure INR 0.10 – 0.11 0.01 – – – – – – Ind aPr vate L m ted17 ARSS Bus Term na Pr vate L m ted INR 238.68 – 257.73 19.06 – – – – – – Ind a18 We spun BOT Projects INR 0.10 – 0.12 0.02 – – – – – – Ind aPr vate L m ted19 Anjar Road Pr vate L m ted INR 0.10 (0.02) 0.10 0.02 – – – – – – Ind a20 We spun Maur t us Ho d ngs US$ 4,403.79 (197.51) 4,209.74 3.47 – – (257.49) 3.08 (260.57) – Maurt usL m ted #21 We psun M dd e East DMCC US$ 3.37 (23.85) 2.57 23.06 – – (10.20) – (10.20) – Duba22 We psun M dd e East P pes SAR 488.85 (13.49) 2,828.76 2,353.40 – 1,516.30 0.55 0.10 0.45 – SaudCoat ng Company LLC Arab a23 We psun M dd e East P pes SAR 1,100.99 456.77 11,634.40 10,076.64 – 9,727.18 237.94 36.89 201.05 – SaudCompany LLC Arab a24 We spun Infra Enterpr ses L m ted INR 0.50 – 0.51 0.01 – – – – – – Ind a###the f nanc a statements of the fore gn subs d ar es have been converted nto nd an Rupees at the 31st March 2013 exchange rate (1 US$ = 54 285)`138
FAQ SectionPIPE SEGMENT1. What is the current capacity of Pipes in India, US & Saudi? Whether the company is looking for any further expansion?The current pipe manufacturing capacity is 2.425 million MTPA as explained on page no. 43. This includes the US HSAW capacity of0.35 million MTPA and the newly commissioned HFIW capacity of 0.175 million MTPA as well as Saudi HSAW capacity of 0.30 millionMTPA. The India capacity is 1.60 million MTPA across all plant locations.During the year, the Company has added 0.175 million MTPA of HFIW in US and the plant has also received the API certification. The0.05 million MTPA of HSAW capacity extension of the Mandya plant has also been commissioned in FY13. These additions have takenthe total worldwide manufacturing capacity to 2.425 million MTPA.The company is not looking further for any major capacity expansion projects as of now.2. What is the current utilization level for the Company in India and US and Saudi pipe plants?The combined utilization levels in India, US, and Saudi facilities was ~ 45% for FY13. The capacity utilization depends on the diameterand thickness of the pipes. The new HFIW facility was commissioned in Q4 FY13, so utilization has been calculated taking that intoeffect. The plant would take 2-3 years to ramp up and reach optimal utilization level.3. What is the production and sales volume in pipes for FY 13?The production of welded pipes was 1,010K MT in FY13 and the sales volume of pipes was 1,018K MT in FY13. This is the first time inthe history of the company that it has achieved the 1 mn MT mark in a year.4. How much was the US Production and Sales during the year? What was the Sales from the US Plant during the year?During the year, the US plant has produced 205 K MT of spiral welded pipes and small quantity of HFIW pipes post commissioning inthe last quarter of FY 13. The utilization level was 58% in spiral pipes , despite fire in the US plant with loss of production ofapproximately 3 months in the second quarter of FY 13. The sales was 217 KMT of pipes in FY 13. Revenue from the US Plant wasRs. 20,014 million for FY 13.5. How much was the Saudi Production and Sales during the year? What was the Sales from the Saudi Plant during the year?The Saudi Plant has produced 175 K MT of spiral welded pipes in FY13 which was 28% higher than the previous year. The Sales was165 K MT in FY 13. Revenue from the Saudi Plant is Rs. 10,692 million during the year.PLATE CUM COIL MILL SEGMENT6. What is the production in the Plate and Coil Mill? What is the total sale of plates during the year (External and Internal)?The company produced 470 K MT of plates and coils during FY13. The total plate sale during the year was 464 K MT, out of which343 K MT is external sale and 121 K MT is internal consumption. The company has taken a temporary shutdown at the end of FY 13 due totough market conditions. The Company will be producing and selling plates on the short run basis if the margins are good on that order.INFRASTRUCTURE SEGMENT7. What is the outlook on the infra segment? What is the total Sales in Infra added to WCL during the year?Welspun’s infrastructure business (Welspun Projects Limited & Leighton Welspun Contractors Private Limited) has shown positiveEBITDA. As far as the development of the business is concerned, the opportunity size continues to be strong, with Welspun having itsfootprints across all the core infrastructure sectors. The total Infra business sales for FY13 are ~ Rs. 9,229 million after accounting for139
the consolidation of Welspun Projects Limited and Leighton Welspun Contractors Private Limited (LWIN). During the year, WelspunProjects Ltd has transferred significant portion of EPC business to LWIN as a strategic move and will be concentrating mainly on thedevelopment business. LWIN will be bidding and executing EPC projects across sectors.ORDER BOOK POSITION8. What is the current Order Book Position in Pipes and Plates by Value? What is the percentage export and domestic breakup byvolume?The outstanding pipe order book position of the company is Rs. 52,140 million (US$ 955 million) as of 29th May 2013. 80% of pipeorders are from international markets like Americas, Middle East and North Africa, and South East Asia.9. What are the key export markets for the company?The key export markets for the company are the markets in North America, Middle East, South East Asia, Africa, and Europe. Thecompany has a well established sales network across the globe with marketing offices in Mumbai and Delhi (India), Dammam (SaudiArabia), Dubai (UAE), and Houston (USA).10. What are the new markets in pipes sector, the company is looking at?With growing popularity of natural gas and major investments taking place, under-exploited regions like Iraq in Middle East andNigeria, Ghana, Angola, Algeria and Tanzania in Africa provide a significant opportunity to the company for focusing on and securingsizeable market share for line pipes in these regions.On the Latin America side, we are seeing three markets which are fairly active - Venezuela, Columbia and Argentina. We are alsoseeing some demand emerging in Mexico which will add further value to the US mill.The Company has a reasonable existing business in the Far East but we are looking to reinforce our presence and gather more marketshare in this market.11. What is the company’s view on the domestic Pipe market?The domestic market is expected to grow at a reasonable pace. Based on the existing pipeline projects, the domestic pipelinerequirements is expected to improve in the next few years with significant expenditure plans from major oil & gas pipeline playerslike GAIL (Gas Authority of India Limited), RGTIL (Reliance Gas Transportation India Limited) and GSPL (Gujarat State PetronetLimited). GAIL plans to invest majorly over the next 2–3 years in expanding its pipeline network to connect consumption centers, asthe company looks to expand its gas network in North India.DEBT / INVENTORY POSITION12. What is the Net Debt to Networth ratio for the company?The Net Debt of the Company stands at Rs. 31,235 million, while the Net Worth of the Company is Rs. 56,578 million as on 31st March2013. The Net Debt to Networth ratio for the company for FY13 stands at 0.55 : 1 indicating a strong Balance Sheet.13. What is the current gross and net debt position as at 31st March 2013?The gross debt (secured & unsecured) is Rs. 55,772 comprising of long term borrowings of Rs. 49,531 million, current portion of longterm borrowings of Rs. 4,198 million, and short term borrowings of Rs. 2,043 million as of 31st March 2013. The Net Debt Positionfor the company is Rs. 31,235 million after taking into account Cash and Liquid Investments of Rs. 24,537 million as on 31st March 2013.14. What is the Inventory level of the Company? What is the Inventory turnover for the company during the year?The overall inventory increased marginally by Rs. 36 million to Rs. 25,669 million. The key changes in inventory were increase in rawmaterials of Rs. 495 million, WIP stock of Rs. 1,660 million and Stores and spares of Rs. 68 million as against decrease in finished goods ofRs. 2,187 million. The inventory turnover days have decreased from 105 days of Net Sales in FY12 to 86 days of Net Sales in FY13.140
OTHERS15. What is the Outlook in terms of business opportunity?Based on the existing pipeline projects, the global pipeline demand has seen an increase in 2013 in the regions of North America,Latin America and Africa as compared to 2012. The global pipeline demand as per Simdex for the projects starting from 2013 to 2017is about 673 projects resulting in an opportunity for supplies of more than US$ 356 billion across geographies where US constitutes~$69 billion. Canada and Iraq provide significant potential in terms of pipe demand in the next few years.Shale gas provides a huge potential for increase in pipeline demand for the coming years, especially small diameter pipe and isexpected to play an important role in shaping North American, European, Australian, and Asian natural oil and gas demand. Pipelinesfrom shale gas fields are being connected to the main trunk lines, thus creating demand potential for pipes in a consistent manner.16. What is the planned CAPEX for the company for the further expansion plans?There are no major expansion plans for the company after the 175,000 tons HFIW plant in Little Rock, US for US$ 80 million which isnow already commissioned this year. There would be regular maintenance and need based capex during FY14.17. What are the strategic initiatives taken by the company?In FY 13 the Company took a strategic decision and has announced the re-organization of the Company to create business focus andenhance shareholder value. The Board of Directors of Welspun Corp Limited in its meeting held on 30th May 2013 decided andapproved a reorganization of its business into two distinct and focused listed companies (subject to regulatory necessary approvals):1) Existing Company (“Welspun Corp Ltd” or “WCL”) to focus solely on the Pipes and Plates business in India and globally; and2) Demerged or new Company (“Welspun Infra Enterprises Ltd” – being renamed as Welspun Enterprises Ltd (“WEPL”)) focusedon DRI (Steel) business, Infrastructure, Oil & Gas exploration and Energy businesses.The rationale behind this re-organization of business is that each business has a different market perception and return expectationsamong investors and stakeholders. Historically, stakeholders have expressed concern regarding the complexity of the WCL corporatestructure and the challenges of co-mingling what are relatively new long gestation businesses with a well-established, dynamic anddiverse pipes business. Historic data also shows that specialized companies with balance sheets tailored to respective businesscycles have easier access to capital markets, are better understood by a wider investor and creditor base and have produced highershareholder returns over the longer run. This move will enhance management focus on the two companies independently andproviding each company with greater flexibility to pursue strategic objectives. It will allow both companies to adopt independentcapital structures and financial policies appropriate for their operational requirements and strategic objectives. It will providegreater investment choice for shareholders, with direct participation in the future performance of the relatively nascentinfrastructure, energy and DRI (Steel) businesses; and will also allow closer alignment between business performance andmanagement incentive plans for each business – driving accountability and management engagement.141
Glossary of Terms2B5LAPIBOTbnCAGRCARECISCRISILCTCGDCCDCapExEBITDAECBERWEPSEIAEPCEEPCFCCBFDIFSUGAILGSPLGSPCGDPGDRGmBHHFIWHRCHSAWIACCINRISOIEAJPYLIBORLLCLSAWmnMTMTPAMTOEMMSCMDNELPOCTGOECDOHSASONGCQQIPRGTILRBISAWTPAUKUSUS$VAIVATWCLWEPLTubularLineAmerican Petroleum InstituteBuild Operate & TransferBillionCompounded Annual Growth RateCredit Analysis and Research LimitedCommonwealth of Independent StatesCredit Rating Information Services of India LimitedCasing and TubularCity Gas DistributionCompulsorily Convertible DebenturesCapital ExpenditureEarnings Before Interest Tax Depreciation and AmortizationExternal Commercial BorrowingElectric Resistant WeldedEarnings per ShareEnergy Information AdministrationEngineering, Procurement & ConstructionEngineering Export Promotion CouncilForeign Currency Convertible BondsForeign Direct InvestmentFormer Soviet UnionGas Authority of India LimitedGujarat State Petroleum LimitedGujarat State Petroleum CorporationGross Domestic ProductGlobal Depository ReceiptsGesellschaft mit beschränkter HaftungHigh Frequency Induction WeldedHot Rolling CoilHelical Submerged Arc WeldedIndo American Chamber of CommerceIndian Rupee (Rs.)International Organization for StandardizationInternational Energy AgencyJapanese YenLondon Interbank Offered RateLimited Liability CompanyLongitudinal Submerged Arc WeldedMillionMetric TonnesMetric Tonnes Per AnnumMillion Tonnes of Oil EquivalentMillion Metric Standard Cubic Meter Per DayNew Exploratory Licensing policyOil Country Tubular GoodsOrganisation for Economic Co-operation and DevelopmentOccupational Health and Safety Advisory ServicesOil and Natural Gas CorporationQuarterQualified Institutional PlacementsReliance Gas Transportation Infrastructure LimitedReserve Bank of IndiaSubmerged Arc WeldedTonnes Per AnnumUnited KingdomUnited States of AmericaUS DollarVoest Alpine IndustriesValue added TaxWelspun Corp LimitedWelspun Enterprises Limited142
YEARAWARD/RECOGNITIONBESTOWED BY20112011Top Export for the Year 2010-11- Gold TrophyStar PerformerEEPCGAIL (India) Ltd.2011Best Indian Manufacturing Company in the US IACC 2011201020102009200820082008Star Performer Award for the year 2008-09– All India Export Excellence AwardsTop Indian Company under Metal PipesNational Awards for Export Excellence- Silver TrophyMost Valuable Company in Metal PipesEmerging Company of the Year2nd Largest Steel Pipe Producer inthe World (Large Diameter)EEPC 2010Dun & BradstreetEngineering ExportPromotion Council- IndiaDun & BradstreetEconomic TimesCorporateExcellence AwardFinancial Times (UK)
C rp Ltdwww.welspuncorp.comWelspun House, 5th Floor, Kamala Mills Compound, Senapati Bapat Marg, Lower Parel, Mumbai 400 013, IndiaTel: +91 22 66136000 / 24908000 Fax: +91 22 24908020 / 24908021 Website: www.welspuncorp.com