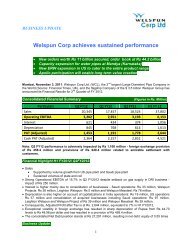
Welspun India Ltd
Welspun India Ltd
Welspun India Ltd
- No tags were found...

Create successful ePaper yourself
Turn your PDF publications into a flip-book with our unique Google optimized e-Paper software.
<strong>Welspun</strong> Group | Textiles4WIL – Strong positive OutlookIndustry factors• <strong>India</strong>’s Location advantage• Surplus cotton• Cheap labour andfavourable demographics• High-growth domesticmarket• De-risking from China,Pakistan & Bangladesh• Proposed FTA with Europe• Favourable governmentpoliciesWIL specific factors• Unification of WIL and WGBL todeliver synergy benefits includinglower cost and better control• Completed exit from loss makingsubsidiaries; Continuing businesshas always been robust• Increasing contribution frominnovation: now at ~30% of sales• Increasing backward integration:now at ~35%; expected to rise to70-75% in a yearStrongsustainablegrowth andprofitability
<strong>Welspun</strong> Group | TextilesWIL - Initiatives To Overcome Structural ChallengesConsolidation of Textile Business under single umbrella to re-create unified stronger entityMerger with <strong>Welspun</strong> Global Brands <strong>Ltd</strong> (WGBL) brings in synergy benefitsThe two entities intertwined for manufacturing, marketing and brandingFinancial inter-linkages for debtors, creditors, loans & advances, guarantees etcBusiness re-strategizingAcknowledgement of the ineffectiveness of earlier decisions; concentrated efforts for a unified structure for a profitable HomeTextile businessNon performing international manufacturing and marketing setups closed down Resultant one time losses booked in FY12 resultsRetail: Preference given to shop-in-shop concept with no capex and low risk rather than handling own retail outletsSimplified structure with better controlAll textile operations under one entity – WILControl on administrative and other distribution costsStreamlining of administrative and compliance procedureValue for all the stakeholdersShareholder value under single listed entity which is completely integrated with manufacturing by parent and marketing througha wholly-owned subsidiaryVertical Integration of ~75% will contribute to improve the profitability of WIL significantly.Recently commissioned an 80 MW power plant, which will further reduce power costs.Competitive environment presenting opportunities to increase market share globally5
<strong>Welspun</strong> Group | Textiles6Strong Textile Industry Fundamentals – Global and <strong>India</strong>Global Textile: Supply-demand balance improving Increase in textiles and clothing global trade from US$ 355 bn in 2000 toUS$ 602 bn in 2010 Expected to reach US$ 1 trillion by 2020, CAGR of 5% pa. Post dismantling of quota regime, global capacities had increaseddramatically. But with closure of some of these capacities in the last fewyears, supply demand balance is being restored Emerging markets in Asia and Middle East expected to drive strongdemand growth while established markets (North America, WesternEurope) continue to show traction<strong>India</strong>n Textile : Well placed for strong growth Estimated size of US$ 89 bn in 2011 (domestic + exports), projected toreach US$ 223 bn by 2021, CAGR of ~10% Second largest producer of cotton, textiles & garments and only majortextile exporting country with a net cotton surplus 12% of <strong>India</strong>’s exports and 4% of <strong>India</strong>’s GDP attained through Textileindustry Third largest exporter of textiles, with a share of ~4% US and EU account for about two-third of <strong>India</strong>’s textile exportsGlobal Textile Market on a Significant UptrendProjected <strong>India</strong>n Textile Industry – Domestic + Exports (US$ bn)US$ billion1,2001,0008006004002000355529 586 6125106028001,000TextileApparelTotal3002502001501005008958311439350223141822011 2016(P) 2021(P)P= Projections; Source: Technopak June 2012,OtexaDomesticExport
<strong>Welspun</strong> Group | TextilesHome Textile LandscapeGlobal Home Textiles2011 Global Home Textiles Market: US$ 70 billion<strong>India</strong>n Home Textiles <strong>India</strong>’s share in global home textile trade at 7%with 2/3 rd of exports going to US and EUUS and Europe account for ~ 70% of market size US home textile market: US$26 bn in 2011<strong>India</strong>n domestic home textile market currently at~US$ 4bnProjected to exceed US$ 8 bn by 2021 withan expected CAGR of ~8%US home textile industry: US$ 26bnProjected <strong>India</strong>n Home Textile Market (US$ Billion)Kitchen anddining7%Window14%108643.75.58.220Bath25%Bedding54%2011 2016(P) 2021(P)Total Domestic Home Textile MarketSource: TechnopakSource: NPD7
<strong>Welspun</strong> Group | TextilesAdvantage <strong>India</strong> – Better placed than key competitors… <strong>India</strong> better placed than key competitors – China and Pakistan – in textiles, particularly home textiles Cotton : <strong>India</strong>, a net exporter of cotton, while China and Pakistan are net importers leading to lower costs and betteravailability in <strong>India</strong><strong>India</strong> – only major textile supplier which is “Net Exporter” of cottonMn. tonnesCountry Production Consumption Exports ImportsChina 6,400 9,600 30 2,610<strong>India</strong> 5,770 4,550 1,170 85Pakistan 1,910 2,200 130 310USA 3,940 850 3,130 -Brazil 1,960 990 435 150Turkey 450 1,250 - 750Others 4,440 5,020 2,705 3,695World 24,870 24,460 7,600 7,600<strong>India</strong>’s Share 23% 19%Source: Cotlook Labour : <strong>India</strong>n costs lower than/comparable to China. Average wage in China growing at 18-20% p.a. Power : Costs for large <strong>India</strong>n producers having own captive plants comparable to China and Pakistan. Pakistan facinghuge power shortages leading to production disruptions Dyes and chemicals: <strong>India</strong>n costs lower than/comparable to China and Pakistan8
<strong>Welspun</strong> Group | Textiles9…leading to market share gains <strong>India</strong>’s market share gain most prominent in home textiles, especially in the US market <strong>India</strong>, Pakistan and China account for more than 85% of the total exports to USA in home textiles Of these three, <strong>India</strong>’s share has been steadily increasing while the other two have maintained or lost shareTowels (Cotton)30% 31%27%23% 24%22% 23%20%35%25%24%16%36%26%22%15%2009 2010 2011 2012<strong>India</strong> China Pakistan ROWSheets (Cotton)45%27%33%29% 30%26%18%38%24%21% 22%22%18%16% 16% 15%2009 2010 2011 2012<strong>India</strong> China Pakistan ROWSource: Otexa
<strong>Welspun</strong> Group | Textiles<strong>India</strong> – Robust growth expected to continue Huge opportunity in Europe Proposed <strong>India</strong> - EU FTA, which is in the final stages of discussion, to remove 5-10% of import duties on <strong>India</strong>ntextiles. This will make <strong>India</strong> more competitive and lead to market share gains in the region Customers continuing to de-risk from China, Pakistan and Bangladesh With China's rising per capita income and transition to a developed country, domestic consumption hasincreased. This has impacted China's ability to export Currency appreciation of yuan coupled with rising labour and power costs leading to higher costs making Chinaless competitive Pakistan’s geopolitical situation and power shortages prompting clients to look for other sources Bangladesh facing scrutiny over workers’ safety Significant growth opportunity in the <strong>India</strong>n market Increasing retail penetration in the <strong>India</strong>n market – Share of Textiles and Clothing Retail ~ 40% of organizedretailing in <strong>India</strong>; Organized Retailing expected to increase from ~5% in 2005 to ~24% by 2020 Higher disposable income & Favourable demographic profile in the <strong>India</strong>n market - Rising per capita incomeleading to an increase in consumption of Textiles. The % of earning population (15-60 years) in the totalpopulation is rising FDI in retail to boost textile consumption Favourable government policies Interest and capital subsidies for new capex from central and various state governments TUFS scheme of central government providing 4-5% of interest rebate on loans for new capex Gujarat state government providing 5-7% of interest rebate on new capex loans in addition to TUFS rebate10
<strong>Welspun</strong> Group | Textiles11WIL - Global Manufacturing Scale & Integrated FacilitiesTerry TowelsBed LinenProductsRugs• Capacity: 43,800 MT/Year• Location: Anjar/Vapi• Cap. Utilization : 90%• Capacity: 52 million Mtr/Year• Location: Anjar• Cap. Utilization: 96%• Capacity: 10,151 MT/Year• Location: Vapi• Cap. Utilization: 59%<strong>India</strong> LocationaladvantageVertically Integrated Facilities Across The Manufacturing Chain withCurrent Integration at 35% in spinning and weaving; capex planned to increase it to ~70-75%CottonYarnCaptive yarngenerationSpinning Weaving Processing Cut & Sew Packing & LogisticsPower generation - thermal all captive
<strong>Welspun</strong> Group | Textiles12Marquee Retailing Giants as Valued Customers Bed Bath & Beyond Macy’s Wal Mart J C Penney Target Kohl’s K Mart- Sears Sam’s Club CostCo Burlington Coat Factory Ross Stores Bon Ton Belk, Inc. Anna’s Linen Ikea Carrefour JYSK El Corte Ingles Vincenzo Zucchi S.p.A Bassetti Auchan Rewe Tom Tailor Descamps Casino Christy Tesco Marks & Spencer Debenhams House of Frazer John Lewis Sainsbury ASDA T J Hughes T K Maxx Fenwicks• Spaces- Home & Beyond
<strong>Welspun</strong> Group | TextilesInnovative Products as Significant ContributorBed TechnologiesBath TechnologiesSleep SolutionsRugs• Flexifit (exclusivelicensee)• Eversmooth• Cotton Touch• Smart Bedskirt• Perfect Sheet• Hygro Comfort• Bleach safe• Hygro cotton• Quick Dry• Bleach safe• Eucalyptus• Silk• Bamboo• Aerospun• Spot Stop• Earth Pillow• Sneeze eezzz• Hygrofil• My Favorite Pillow• Bleach safe• Eucalyptus• Drylon• Hygro• Quick Dry• Aerofil• Hygro cottonInnovative products, mainly in Towels and Sheets, accounted for more than30% of turnover in FY 1313
<strong>Welspun</strong> Group | TextilesWIL – Increasing market share in the USWIL contributed 46% of <strong>India</strong>’s Towel Exports to the US in 2012Towels - 2011 Towels – 2012US$Total US Towel Imports – 1,427 mnTotal US Towel Imports – 1,460 mnUS$Total US Towel Imports from <strong>India</strong>495 mn <strong>Welspun</strong>'s Towel Exports to US195 mn ~ 39% of <strong>India</strong> ExportsTotal US Towel Imports from <strong>India</strong>531 mn <strong>Welspun</strong>'s Towel Exports to US243 mn ~ 46% of <strong>India</strong> ExportsWIL contributed 25% of <strong>India</strong>’s Bed sheet Exports to the US in 2012Bed sheets - 2011 Bed sheets – 2012US$Total US Bed sheet Imports - 1,740 mnTotal US Bed sheet Imports 1,756mnUS$Total US Bed sheet Imports from <strong>India</strong>665 mn <strong>Welspun</strong>'s Bed sheet Exports to US146 mn ~ 22% of <strong>India</strong> ExportsTotal US Bed sheet Imports from <strong>India</strong>795 mn <strong>Welspun</strong>'s Bed sheet Exports to US199 mn ~ 25% of <strong>India</strong> ExportsSource: OTEXA.14
<strong>Welspun</strong> Group | Textiles15Pricing power on account of long-term relationship with clients <strong>Welspun</strong> has developed strong relationships with clients over the years, which gives it betterpricing power Most clients on an index-based pricing Price varies up or down with changes in major input costs This reduces volatility in marginsContact price – Sample contract with one of our clients for a particular productIndex (Jan 10 = 100)1801601401201008060
<strong>Welspun</strong> Group | TextilesFinancial Snapshot – In <strong>India</strong>n Rupees(All figures except ratios in Rs. Million)Balance Sheet Extract – With merger impactParticulars FY10 FY11 FY12 FY13Net Worth 6,135 7,461 7,428 9,902Gross Debt 18,392 20,102 19,621 20,244Cash, Cash Eqnts & Inv. 1,115 2,590 3,041 2,798Net Debt 17,276 17,512 16,580 17,446Net Fixed Assets (incl CWIP) 17,188 17,979 17,995 18,615Net Current Assets** 8,023 9,033 6,290 8,221** NCA do not include Cash & Cash EquivalentsProfitability Extract – Continuing businessParticulars FY10 FY11 FY12 FY13Sales revenue 23,483 24,471 29,329 36,473EBITDA 4,414 3,994 5,960 6,438EBITDA Margin 18.8% 16.3% 20.3% 17.7%PBT 1,998 1,463 2,811 3,013PAT 1,290 951 1,986 2,248PAT Margin 5.5% 3.9% 6.8% 6.2%Cash PAT 2,730 2,441 3,586 4,178Key Ratios – On continuing basisSolvency ratios FY10 FY11 FY12 FY13Fixed assets/Long term debt 1.25 1.44 1.47 1.68Gross debt/Equity 3.00 2.69 2.64 2.04Net debt/Equity 2.82 2.35 2.23 1.76Long term debt/Equity 2.24 1.67 1.65 1.12Net debt/EBITDA 4.34 4.84 2.98 2.71Operational ratiosAsset turnover 0.89 0.83 1.02 1.13Inventory days 86 98 83 82Debtor days 28 28 28 28Payable days 58 66 59 50Cash conversion cycle 56 60 52 60Return ratiosROE 21.0% 12.7% 26.7% 22.7%ROCE 8.7% 6.9% 12.2% 11.4%16
<strong>Welspun</strong> Group | Textiles17Financial Snapshot – In USD(All figures in USD Million)Balance Sheet Extract – With merger impactParticulars FY10 FY11 FY12 FY13Net Worth 137 167 146 182Gross Debt 410 451 386 373Cash, Cash Eqnts & Inv. 25 58 60 52Net Debt 385 393 326 321Net Fixed Assets 383 403 354 343Net Current Assets** 179 203 124 151** NCA do not include Cash & Cash EquivalentsProfitability Extract – Continuing businessParticulars FY10 FY11 FY12 FY13Sales revenue 495 537 612 670EBITDA 93 88 124 118EBITDA Margin 18.8% 16.3% 20.3% 17.7%PBT 42 32 59 55PAT 27 21 41 41PAT Margin 5.5% 3.9% 6.8% 6.2%Cash PAT 57 54 75 77Exchange RatesRates FY10 FY11 FY12 FY13Avg 47.47 45.53 47.95 54.40Period ending 44.90 44.60 50.87 54.31
<strong>Welspun</strong> Group | Textiles18WIL - Way Ahead New unified structure to will help lower costs, give better control on manufacturing andbranding Focus on stringent cost controls, foray into new markets and consolidation andstreamlining of operations to maximize ROI Continued emphasis on innovation Strong focus on the high growth domestic market through Shop-in-shop in large retail stores which entail no capex and low risk Wholesale distributors Institutional clients such as hotels E-commerce Gaining traction in new markets like Canada, South Africa, Japan, Korea and Australia Capex to be focused on backward integration and modernization in <strong>India</strong>WIL well placed with high end global scale capacity, skilled workforce, product knowledgeexpertise and coordinated marketing approach to capitalize on growth opportunities
<strong>Welspun</strong> Group | Textiles19CSR and Environmental LeadershipWhen Industry Cares…. The Community SmilesCOREFOCUSEducationCSR InitiativesEmpowerment &HealthImplementation MediumsEnvironmentOUTREACH<strong>Welspun</strong> ProgramsTie-ups with Non GovernmentalOrganizations / DevelopmentalAgencies/ InstitutionsFacilitatingGovernment Initiatives
<strong>Welspun</strong> Group | Textiles20Recent Awards and Recognitions in 2012-13Performance AwardsMost Preferred Furnishing Brand - MAGPPIEGold Supplier Award – TESCOInnovation Award for Eco-Dry towels - Golden PeacockBest Product Award- WilkinsonFive Star Award – Macy’sVendor of the Year Award - Sears / K-MartPartners in Business Transformation award - Sears / K-MartSustainability awards Responsibility Award for Excellence – Walmart Global CSR Excellence & Leadership - Bluedart
<strong>Welspun</strong> Group | Textiles21Thank YouFor further details, please contact:Akhil JindalDirector – Group Strategy and FinanceEmail: akhil_jindal@welspun.comHarish VenkateswaranGM - Group Strategy and FinanceEmail: harish_venkateswaran@welspun.comCompany Website: www.welspunindia.com