Welspun India Ltd
Welspun India Ltd
Welspun India Ltd
- No tags were found...

You also want an ePaper? Increase the reach of your titles
YUMPU automatically turns print PDFs into web optimized ePapers that Google loves.
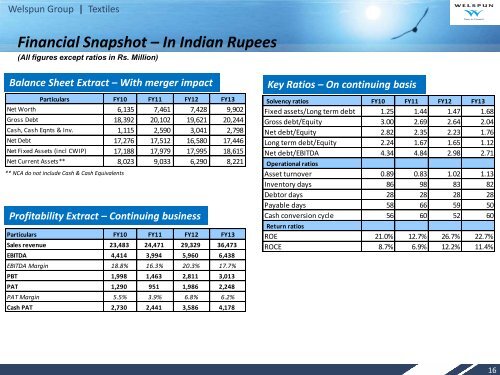
<strong>Welspun</strong> Group | TextilesFinancial Snapshot – In <strong>India</strong>n Rupees(All figures except ratios in Rs. Million)Balance Sheet Extract – With merger impactParticulars FY10 FY11 FY12 FY13Net Worth 6,135 7,461 7,428 9,902Gross Debt 18,392 20,102 19,621 20,244Cash, Cash Eqnts & Inv. 1,115 2,590 3,041 2,798Net Debt 17,276 17,512 16,580 17,446Net Fixed Assets (incl CWIP) 17,188 17,979 17,995 18,615Net Current Assets** 8,023 9,033 6,290 8,221** NCA do not include Cash & Cash EquivalentsProfitability Extract – Continuing businessParticulars FY10 FY11 FY12 FY13Sales revenue 23,483 24,471 29,329 36,473EBITDA 4,414 3,994 5,960 6,438EBITDA Margin 18.8% 16.3% 20.3% 17.7%PBT 1,998 1,463 2,811 3,013PAT 1,290 951 1,986 2,248PAT Margin 5.5% 3.9% 6.8% 6.2%Cash PAT 2,730 2,441 3,586 4,178Key Ratios – On continuing basisSolvency ratios FY10 FY11 FY12 FY13Fixed assets/Long term debt 1.25 1.44 1.47 1.68Gross debt/Equity 3.00 2.69 2.64 2.04Net debt/Equity 2.82 2.35 2.23 1.76Long term debt/Equity 2.24 1.67 1.65 1.12Net debt/EBITDA 4.34 4.84 2.98 2.71Operational ratiosAsset turnover 0.89 0.83 1.02 1.13Inventory days 86 98 83 82Debtor days 28 28 28 28Payable days 58 66 59 50Cash conversion cycle 56 60 52 60Return ratiosROE 21.0% 12.7% 26.7% 22.7%ROCE 8.7% 6.9% 12.2% 11.4%16