
Create successful ePaper yourself
Turn your PDF publications into a flip-book with our unique Google optimized e-Paper software.
15 th<strong>Annual</strong> <strong>Report</strong><strong>2009</strong>-<strong>10</strong>C rp LtdFormerly known as<strong>Welspun</strong> Gujarat Stahl Rohren Ltd.You must be theCHANGE you wish to see in the World- Mahatma Gandhi
th15 <strong>Annual</strong> <strong>Report</strong> <strong>2009</strong>-<strong>10</strong>FINANCIALS AT A GLANCE(Rs. in Million)ParticularsYear ended 31 March (Consolidated)20<strong>10</strong> <strong>2009</strong> 2008 2007Income Statement DataIncome from Operations 73,503 57,395 39,945 26,834Operating Expenses (COGS, Mfg and Other Expenses) 60,317 51,048 33,389 23,552EBITDA 13,186** 6,348* 6,555 3,283Depriciation 2,061 1,433 609 476Gross Profit {EBITDA - Interest Expenses (Net)} 11,115 4,581 5,737 2,545EBIT 11,126 4,915 5,946 2,807Interest Expenses (Net) 2,071 1,766 818 738PAT 6,<strong>10</strong>4** 2,135* 3,408 1,425Balance Sheet DataCurrent Assets 51,471 45,848 26,121 16,354Current Liabilties 33,5<strong>10</strong> 39,555 18,092 <strong>10</strong>,558Net Current Assets 17,961 6,293 8,029 5,796Fixed Assets*** 38,283 37,190 26,807 16,493Investments 1,596 1,140 3,250 256Gross Debt 25,476 26,538 20,677 15,146Cash and Bank Balance 17,028 9,470 2,703 3,573Net Debt 8,448 17,068 17,974 11,573Shareholders Fund 29,011 15,597 15,672 6,535Deffered Tax Liability 3,352 2,488 1,738 794Capital Employed 57,839 44,623 38,087 22,475Cash Flow DataNet Cash Flows by Operating Activities 3,821 13,195 2,855 (265)Net Cash Flows by Investing Activities (3,863) (7,438) (14,998) (6,503)Net Cash Flows by Financing Activities 2,767 1,0<strong>10</strong> 11,273 7,274Financial RatiosEPS - Basic (Rs/share) 31.7 11.5 20.9 <strong>10</strong>.7EPS - Diluted (Rs/share) 28.4 11.4 18.3 8.7EBITDA Margin (%) 17.94% 11.06% 16.41% 12.23%PAT Margin (%) 8.30% 3.72% 8.53% 5.31%Net Debt to Shareholders Fund 0.29 1.09 1.15 1.77Net Debt to EBITDA 0.64 2.69 2.74 3.53Return on Shareholders Fund 21.04% 13.69% 21.74% 21.81%ROCE [EBIT/ (Capital Employed - Cash)] 27.26% 13.98% 16.81% 14.85%* <strong>FY</strong> 2008-09 :EBITDA would have been higher at Rs.8,167 million which was impacted by Forex provision at Rs.1,256 millionProvision on ECB of Rs.178 million and Inventory write down of Rs. 385 million during the year and Net Income would have been higher at Rs.3,336 million.** <strong>FY</strong> <strong>2009</strong>-<strong>10</strong> : Forex Provisioning made in the previous year were recovered during the year** *includes Capital Work-In-Progress, Misc. Expenditure (to the extent not written off) and Foreign Currency Monetary item transalation difference account4
C rp LtdFINANCIALS AT A GLANCEParticularsIncome Statement DataIncome from OperationsOperating Expenses (COGS, Mfg and Other Expenses)EBITDADepriciationGross Profit {EBITDA - Interest Expenses (Net)}EBITInterest Expenses (Net)PATBalance Sheet DataCurrent AssetsCurrent LiabiltiesNet Current AssetsFixed Assets***InvestmentsGross DebtCash and Bank BalanceNet DebtShareholders FundDeffered Tax LiabilityCapital EmployedCash Flow DataNet Cash Flows by Operating ActivitiesNet Cash Flows by Investing ActivitiesNet Cash Flows by Financing Activities(USD in Million)Year ended 31 March (Consolidated)20<strong>10</strong> <strong>2009</strong> 2008 20071,548 1,250 992 5931,271 1,112 829 520278** 138* 163 7243 31 15 11234 <strong>10</strong>0 142 56235 <strong>10</strong>7 148 6244 38 20 16129** 47* 85 311,146 904 652 375746 780 451 242400 124 200 133853 733 669 37836 22 81 6567 523 516 347379 187 67 82188 337 448 265646 308 391 15075 49 43 181,288 880 950 51680 287 71 (6)(81) (162) (372) (144)58 22 280 161Financial RatiosEPS - Basic (US $/share)0.670.250.520.24EPS - Diluted (US $/share)0.600.250.450.19EBITDA Margin (%)17.94%11.06%16.41%12.23%PAT Margin (%)8.30%3.72%8.53%5.31%Net Debt to Shareholders Fund0.291.091.151.77Net Debt to EBITDA0.642.692.743.53Return on Shareholders Fund21.04%13.69%21.74%21.81%ROCE [EBIT/ (Capital Employed - Cash)]27.26%13.98%16.81%14.85%* <strong>FY</strong> 2008-09:EBITDA would have been higher at US $ 177.89 million which was impacted by Forex provision at US $ 27.35 millionProvision on ECB of US $ 3.51 million and Inventory write down of US $ 7.59 million during the year and Net Income would have been higher at US $ 72.66 million.**<strong>FY</strong> <strong>2009</strong>-<strong>10</strong> : Forex Provisioning made in the previous year were recovered during the year***includes Capital Work-In-Progress, Misc. Expenditure (to the extent not written off) and Foreign Currency Monetary item transalation difference accountExchange rates used for Balance Sheet Items is Closing rate as on 31 March44.9050.7240.0843.59Exchange rates used for Profit & Loss Items is Average rate for the year47.4745.9140.2945.295
th15 <strong>Annual</strong> <strong>Report</strong> <strong>2009</strong>-<strong>10</strong>Message from Chairman and Managing DirectorMy dear fellow stakeholders,What an eventful year this has been! When we began the year, the World was at its lowest ebb. Continuous slidein commodity markets and stock markets worldwide was causing nervousness all around us, people werebehaving as if there was no tomorrow. I remember my theme of last year's message was 'TRUST'. I hadmentioned, “In these testing times, we believe that only 'Trust' can take the world out of this financial maize”. Ialso said, “'Trust' is the nucleus of earnest hope and we at <strong>Welspun</strong> will come out much stronger and bettercorporate out of this challenging period”.Chartering New TerritoriesDear Friends, I am happy that we have completely outperformed ourselves on all counts. As regards to customertrust, we bagged multiple orders mostly from our renowned Oil & Gas customers enabling us to finish this year ata healthy order book of Rs. 6400 Crore no mean achievement - considering the fact that in the first 6 monthsthere were hardly any orders. I believe that the recovery in the commodity prices, particularly oil which is nowhovering around $80 a barrel will lead to flurry of new orders for the high-end pipes that we specialize in. We arearguably one of the largest line pipe company in the world and I always get motivated by this leadership positionfor an Indian Company which is global in all respect.Global ReachOur U.S. plant got commissioned last year with a motivating message of Mr. Mike Beebe, Governor, State ofArkansas, who said, “The commitment that <strong>Welspun</strong> made to Arkansas has not only been met, its beenexceeded. They have actually invested more money and hired more people than they had committed to do andwe are very very grateful to them”. This facility is truly an American Corporation hiring local people (almostaround 600), using local transportation for its inward and outward movement, paying local taxes and thusenabling all-round socio-economic growth of the State of Arkansas. The facility has clearly shown its mettle in itsfirst year of operations itself, with remarkable contribution in top-line and bottom-line.New initiatives - Our Growth driversOur better-than-expected performance of the U.S. plant has cemented our belief that <strong>Welspun</strong> need to providelocal solutions from its global experience. To cater to the very large Middle-East and North-African market,<strong>Welspun</strong> signed a landmark agreement - wherein <strong>Welspun</strong> will own over 50 percent equity in a state-of-the artSpiral Pipe and Coating Mill with full operational control - Another step in our journey to become a GlobalCompany with regional production facilities.The year also witnessed another significant development in the form of our foray into the 'World ofInfrastructure'. Our subsidiary <strong>Welspun</strong> Infratech Ltd. acquired a majority stake in MSK Projects India Ltd. (MSK).This acquisition will enable <strong>Welspun</strong> to move a step forward towards complete integration by being a one-stopsolution- from Manufacturing of Plate & Coil to Line Pipe and finally to Pipe laying. The Vadodara (Gujarat, India)based MSK has three decades of rich experience in working with some of the large PSU's mostly from Oil & Gasindustry. MSK's business model includes EPC projects in roads, industrial construction, PPP (Public PrivatePartnership) and ownership of several BOOT (Build Own Operate Transfer). We truly believe that our Company isnow a 'Pipe Infrastructure Company' with a vision to not only supply pipes but also lay them and wherevereconomically viable, own and operate them.6
C rp LtdFinancial ScorecardAn exceptional year against all odds where our revenue increased by 28% but more importantly EBITDAbecame almost twice and significantly net profit almost three times with respect to last year, a mirrorreflection of our profitable growth.Human CapitalI take this opportunity to compliment our human resources who withstood the difficult times and all our extraordinaryresults had not been possible without this hardworking and dedicated team. To strengthen ourmanagement, we have inducted a new CEO, Mr. Lauri Antero Malkki. This is another step to make ourmanagement band much more wider and ready to transcend our Company to the next level.Our new lookAll the above would have been incomplete without my mention of 'CHANGE', the theme of this <strong>Annual</strong> <strong>Report</strong>.To reflect our multitude businesses, our magnitude of operations across multiple locations, we adopted a newname and a new logo. As someone rightly said, “Only change is constant”, I believe this new identity will reflectour new positioning in the global arena.Friends, finally my sincere thanks to all the stakeholders for trusting us and for their earnest support whichenabled us to achieve so much in such a short period of time.We promise to make <strong>Welspun</strong> Corp one of the most respected Companies in the World! And for that, I humblysolicit your continued support and well wishes.“<strong>Welspun</strong> has beenmetamorphosingitself from a smallPipe Company in1997 to a full serviceGlobal Company in20<strong>10</strong>.”Yours sincerely,B. K. GoenkaChairman & Managing Director7
th15 <strong>Annual</strong> <strong>Report</strong> <strong>2009</strong>-<strong>10</strong>With single step ....Steel pipes
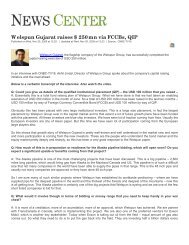
...the journey continuesInfrastructurePlate & CoilCoatingBendingWITH A SINGLE STEP ...THE JOURNEY CONTINUESWhat began as a HSAW pipemanufacturer in 1995, has todayresulted in <strong>Welspun</strong> providing a onestopsolution to international Oil & Gasmajors. Today we have the world wideexperience to produce the best ofLSAW, HSAW, ERW, Coating, Bends,Double jointing and now also Pipelaying.
th15 <strong>Annual</strong> <strong>Report</strong> <strong>2009</strong>-<strong>10</strong>DIRECTORS' REPORTTo,The Members,<strong>Welspun</strong> Corp LimitedthYour directors have pleasure in presenting the 15 <strong>Annual</strong> <strong>Report</strong> of your Company along with Audited Financial Statement for thefinancial year ended 31st March, 20<strong>10</strong>.FINANCIAL RESULTSParticularsIncome from operations & other income (Total Income)Profit before interest, depreciation & taxLess : Interest / Finance costsGross Profit / ( Loss)Less: DepreciationProfit before tax for the yearLess : Provision for current taxationProvision for deferred taxationFringe benefit taxProfit after tax for the year (“PAT”)Add : balance brought forward from previous yearProfit available for appropriationTransfer to General ReserveTransfer to Debenture Redemption ReserveProposed Dividend on equity shares & taxEquity dividend & tax of earlier yearsBalance carried forward to next yearFor the year ended(Rs. in million)31.03.20<strong>10</strong> 31.03.<strong>2009</strong>66,267.09 58,961.9311,226.14 6,525.231,661.70 1,734.969,564.44 4,790.271,479.20 1,254.198,085.24 3,536.082,216.24 439.47467.05 749.75- 11.185,401.96 2,335.686,795.96 5,305.6012,197.92 7,641.28540.00 234.00<strong>10</strong>6.25 268.75476.51 327.280.26 15.2811,074.89 6,795.96PERFORMANCEDuring the year under report, your Company produced 686,226 MT of pipes as compared to 734,352 MT in the preceding year whichwas slightly lower compared to the preceding year due to change in the product mix. In the Plate cum Coil Mill, the Company registeredalmost <strong>10</strong>0% growth in Plate production to 383,577 MT as compared to 192,569 MT in the preceding year showing stabilization ofproduction throughout the year whereas, the coil mill which commenced production at the end of the year under report, recordedproduction of 2,691 MT. On the coating side, the Company registered manifold growth of 7.5 times to 5,036K sqm as compared to 688Ksqm in the preceding year mainly due to higher ratio of coated pipes to bare pipes. On the revenue side, the Company achieved growthof 12.38% in the Total Income mainly due to higher realization.DIVIDENDThe Board recommends a dividend @40% for the year ended 31st March 20<strong>10</strong> i.e. Rs.2/- per Equity Share of Rs.5/- each. In respect ofdividend declared for the previous financial years Rs.3.11 million remained unclaimed as on 31st March 20<strong>10</strong>.EXPANSION STATUS• Pipe Mill in USAThe pipe manufacturing and coating facilities in the US are working in full swing.• Pipe Mill in AnjarThe Board considered that it would be appropriate to have the new LSAW pipe manufacturing facilities, earlier planned in SpecialEconomic Zone (“SEZ”) by the Company's wholly owned subsidiary, to be taken outside the SEZ to enable flexibility to supplypipes in domestic market as well.• Spiral Pipe Project in Southern India for water applicationConsidering the increased need for water transportation in Southern India, your directors foresee that the demand for pipesfor transportation of water from reservoir to end user would increase in the years to come. To tap this opportunity, yourdirectors decided to set up a Spiral Pipe Plant for water application in Southern India. The Project is planned to be completedby September 20<strong>10</strong>.<strong>10</strong>
C rp Ltd• Spiral Pipe (API Grade) Project in Central IndiaConsidering the demand for pipes in the domestic market, your company is also initiating to set up a Spiral Pipe Mill in CentralIndia.The total capacity after completion of the above mentioned projects, has been mentioned in the Management Discussionand Analysis which forms a part of this <strong>Report</strong>.WITHDRAWAL OF PETITION FOR TRANSFER OF PLATE & COIL MILL DIVISIONDue to change in the circumstances since when the Board of your Company had initially approved the Scheme of Arrangement in thenature of demerger and transfer of Plate and Coil Mill Division of the Company to its then wholly owned subsidiary viz. <strong>Welspun</strong> SteelPlates and Coil Mills Pvt. Ltd. (the “Scheme”), your directors opined that going ahead with the Scheme would not be in the overallinterest of the Company. Hence, your directors decided not to pursue the Scheme and it was accordingly withdrawn.FUNDS UTILIZATIONDuring the year under report the Company has issued Foreign Currency Convertible Bonds and equity shares to QIB’s on privateplacement basis. Status of application of the funds is as under:• Proceeds from FCCB's of US$150 mn (<strong>2009</strong>-<strong>10</strong>) were utilized partly for meeting capital expenditure on Plate Cum Coil Mill at Anjar(US$23.73 mn), Spiral Pipe Project in Southern India (US$0.59 mn) and LSAW Project at Anjar (US$1.62 mn) and pendingutilization, the issue proceeds of US$122.35 mn have been invested in short term deposits with banks abroad. The entireamount of FCCB is outstanding as at the end of the year under <strong>Report</strong>.• Proceeds from QIP Issue of US$<strong>10</strong>0 mn (<strong>2009</strong>-<strong>10</strong>) were utilized for general corporate purpose.DIRECTORSSince the last <strong>Annual</strong> <strong>Report</strong> of the Company no change in the directors of the Company took place except resignation of Mr. Braja K.Mishra w.e.f. 03.<strong>10</strong>.<strong>2009</strong>.In accordance with the provisions of the Companies Act, 1956 and the Articles of Association of the Company, Mr. M.L.Mittal,Mr. K.H.Viswanathan and Mr. Rajkumar Jain retire by rotation at the forthcoming <strong>Annual</strong> General Meeting and being eligible, have beenrecommended for re-appointment.Details about these directors are given in the Notice of the ensuing <strong>Annual</strong> General Meeting being sent to the shareholders along withthe <strong>Annual</strong> <strong>Report</strong>CHANGE OF NAME OF THE COMPANYWith effect from 27th April 20<strong>10</strong>, the name of the Company has been changed from <strong>Welspun</strong>-Gujarat Stahl Rohren Limited to <strong>Welspun</strong>Corp Limited.DIRECTORS' RESPONSIBILITY STATEMENTPursuant to Section 217(2AA) of the Companies Act, 1956, your directors hereby confirm that:i) in the preparation of the accounts for the financial year ended 31st March, 20<strong>10</strong>, the applicable accounting standards havebeen followed along with proper explanation relating to material departures;ii)iii)iv)they have selected such accounting policies and applied them consistently and made judgments and estimates that arereasonable and prudent so as to give a true and fair view of the state of affairs of the Company at the end of the financial yearand of the profit of the Company for the year under review;they have taken proper and sufficient care for the maintenance of adequate accounting records in accordance with theprovisions of the Companies Act, 1956 for safeguarding the assets of the Company and for preventing and detecting fraudand other irregularities;they have prepared the accounts for the financial year ended 31st March, 20<strong>10</strong> on a going concern basis.AUDITORSYour Company's Auditors M/s. MGB & Co., Chartered Accountants, retire at the ensuing <strong>Annual</strong> General Meeting and being eligible,have given their consent to act as the Auditors of the Company for the forthcoming tenure. Members are requested to consider theirre-appointment as the Auditors of the Company and to fix their remuneration by passing an ordinary resolution under Section 224 ofthe Companies Act, 1956.11
th15 <strong>Annual</strong> <strong>Report</strong> <strong>2009</strong>-<strong>10</strong>AUDITORS' REPORTThe Auditors' observation read with Notes to Accounts are self-explanatory and therefore do not call for any comments.EMPLOYEE STOCK OPTION SCHEMEThe Company has granted Stock Options to eligible directors and employees of the Company and its subsidiary companies.The particulars required to be disclosed pursuant to Clause 12 of SEBI (ESOS and ESPS) Guidelines 1999 are given below:Difference in employees compensation cost based on intrinsic value and fair value:The Company has adopted intrinsic value method for valuation and accounting of the aforesaid Stock Options as per SEBIguidelines, and accordingly has accounted Rs. 13.06 mn as employee compensation for the year ended 31st March 20<strong>10</strong>.Had the Company valued and accounted the aforesaid Stock Options as per the Black Scholes Model, the net profit for the yearwould have been lower by Rs. <strong>10</strong>.12 mn and the diluted earnings per share would have been Rs. 25.13 instead of Rs. 25.18 pershare.Black Scholes Model captures all the variables with their respective appropriateness which influences the fair value of stockoptions. The significant assumptions to estimate the fair value of options as per Black Scholes Model are as under:VariablesStock Price (Rs.)VolatilityRisk Free RateExercise Price (Rs.)Time to MaturityDividend YieldOption Fair Value (Rs.)Weighted Average Option Fair Value (Rs.)Grant Date 20 th April <strong>2009</strong>Vest 1 Vest 2 Vest 320 th April 20<strong>10</strong> 20 th April 2011 20 th April 201230%89.8571.15%4.26%66.752.500.75%47.2935%89.8565.42%5.08%66.753.500.75%50.6651.0335%89.8564.07%5.75%66.754.500.75%54.61Details of Stock Options as required to be disclosed pursuant to Clause 12 of SEBI (ESOS and ESPS) Guidelines, 1999 are givenbelow:abcdefghijOptions grantedOptions vested (excluding vested portion of lapsed Options)Options exercisedTotal number of equity shares arising as a result of exercise ofOptionsOptions lapsedTotal number of Options in forceMoney realized by exercise of OptionsThe pricing formulaVariation of terms and conditionsEmployee wise Whole Time Directorsdetails ofMr. M.L.Mittaloptions granted Mr. Asim ChakrabortytoEmployee who received a grant in anyone year of option amounting to 5% ormore of option granted during that yearEmployees, who were granted option,during one year, equal to or exceeding1% of the issued capital (excluding o/swarrants & conversions) :k Diluted EPS Rs. 25.18 as compared to Rs. 12.50 of last year47,500 Options : during the year2,160,6251,136,5001,136,500195,250944,500Rs. 90,920,000Exercise price is to be at 25% discount to the latest availableclosing market price of the equity shares of the Company,prior to the date of grant.N.A.o 150,000o 50,000o Nilo NilTHE COMPANIES (DISCLOSURE OF PARTICULARS IN THE REPORT OF BOARD OF DIRECTORS) RULES, 1988In terms of the above Rules, your Directors are pleased to give the particulars as prescribed therein in the Annexure, which forms apart of the Directors' <strong>Report</strong>.12
C rp LtdPARTICULARS OF EMPLOYEESAs required by the provisions of Section 217(2A) of the Companies Act, 1956 read with the Companies (Particulars of Employees)Rule, 1975 as amended, the names and other particulars of the employees are set out in the Annexure to the Directors' <strong>Report</strong>.However, as per the provisions of Section 219(1)(b)(iv) of the Companies Act, 1956, the <strong>Report</strong> and Accounts are being sent to allthe shareholders of the Company excluding the aforesaid information. Any shareholder interested in obtaining such particularsmay write to the Asst. Company Secretary at the Registered Office of the Company.ENERGY, TECHNOLOGY AND FOREIGN EXCHANGEInformation in accordance with the provisions of Section 217(1)(e) of the Companies Act, 1956, regarding conservation of energy,technology absorption and foreign exchange earnings and outgo is given in the Annexure forming part of the Directors' <strong>Report</strong>.SUBSIDIARY COMPANIESThe Company has applied for exemption from attaching a copy of Balance Sheet, Profit and Loss Account and other documents ofits subsidiary companies as required to be attached under Section 212 of the Companies Act, 1956 to the Balance Sheet of theCompany. Therefore, upon receipt of the exemption, the said documents of the subsidiary companies viz. (1) <strong>Welspun</strong> TradingsLtd. (2) <strong>Welspun</strong> Natural Resources Pvt. Ltd. (3) <strong>Welspun</strong> Pipes Ltd. (4) <strong>Welspun</strong> Plastics Private Ltd. (5) <strong>Welspun</strong> Infratech Limited(6) <strong>Welspun</strong> Pipes Inc. USA (7)<strong>Welspun</strong> Tubular LLC, USA and (8) <strong>Welspun</strong> Global Trade LLC, USA will not be attached to the <strong>Annual</strong><strong>Report</strong>. However, the aforesaid documents relating to the subsidiary companies and the related detailed information will bemade available upon request by any member or investor of the Company. Further, the <strong>Annual</strong> Accounts of the subsidiarycompanies will be kept open for inspection by a member or an investor at the Registered Office of the Company or the respectivesubsidiary company.As may be required under the exemption, a statement containing the requisite information for each subsidiary will be attachedwith the <strong>Annual</strong> <strong>Report</strong>.FIXED DEPOSITSThe Company has not accepted any public deposit within the meaning of the Companies (Acceptance of Deposit) Rules, 1975 and,as such, no amount on account of principal or interest on public deposit was outstanding on the date of the Balance Sheet.LISTING WITH STOCK EXCHANGESThe Company's equity shares are listed on the Bombay Stock Exchange Ltd., (BSE) and the National Stock Exchange of India Ltd.(NSE). The Foreign Currency Convertible Bonds are listed at Singapore Securities Trading Limited (SGX-ST).<strong>Annual</strong> listing fees for the year 20<strong>10</strong>-11 have been paid to BSE, NSE and SGX-STCORPORATE GOVERNANCEA separate report on Corporate Governance is annexed hereto as a part of this <strong>Report</strong>. A certificate from the Company Secretary inPractice regarding compliance of conditions of Corporate Governance as prescribed under Clause 49 of the Listing Agreement isattached to this <strong>Report</strong>. A separate report on Management Discussion & Analysis is enclosed as a part of the <strong>Annual</strong> <strong>Report</strong>.CONSOLIDATED FINANCIAL STATEMENTSAs stipulated by Clause 32 of the Listing Agreement with the Stock Exchanges, the Consolidated Financial Statements have beenprepared by the Company in accordance with the applicable Accounting Standards issued by The ICAI. The Audited ConsolidatedFinancial Statements together with Auditors' <strong>Report</strong> thereon forms a part of the <strong>Report</strong>.ACKNOWLEDGEMENTYour Directors expresses and place on records their gratitude for the faith reposed in, and co-operation extended to, and interestshown in operations of, the Company by the Financial Institutions, Banks, Government Authorities, Customers, Suppliers andShareholders of the Company. Your Directors also wish to place on record their sincere appreciation of the dedicated services ofthe employees of the Company at all levels but for whose hard work, solidarity and profuse support your Company's achievementwould not have been possible.For and on behalf of the BoardPlace: MumbaiB.K.GoenkaDate: 27th April 20<strong>10</strong> Chairman and Managing Director13
th15 <strong>Annual</strong> <strong>Report</strong> <strong>2009</strong>-<strong>10</strong>A. POWER AND FUEL CONSUMPTION1 ELECTRICITY(A)(B)2PurchasedUnit (In '000s) MWHTotal Amount (Rs. In Lacs)Rate/Unit (Rs)Own Generation(I)(II)COALThrough D.G. Set (CPP)Generated Unit (In '000s) MWHForm – A(See Rule 2)FORM FOR DISCLOSURE OF PARTICULARS WITH RESPECT TO CONSERVATION OF ENERGYUnits Generated Per Unit Of FuelCost/Unit (Rs)Through Steam Turbine / GeneratorGenerated Unit (In ’000) MWHTotal Amount (Rs. in Lacs)Rate / Unit (Rs.)Unit (In ’000) Kg.Total Amount (Rs. in Lacs)Rate (Rs./Kg.)OTHER – LIGNITE & LIME STONEUnit (In ’000) Kg.Total Amount (Rs. in Lacs)Rate (Rs./Kg.)<strong>2009</strong>-20<strong>10</strong>3,417.21 6,137.42290.24 687.088.49 11.1921,258.46 18,903.79*5.122008-<strong>2009</strong>*4.21305,462.00 286,867.008,249.05 9,616.852.70 3.35218,839.40 239,969.007,401.57 9,844.503.38 4.<strong>10</strong>89,740.85 31,620.001,659.88 590.811.85 1.873 FURNACE OILQuantity (K. Ltrs.)Total Amount (Rs. in Lacs)Rate (Rs./Ltr.)4 OTHERS/INTERNAL GENERATIONB. CONSUMPTION PER UNIT OF PRODUCTIONPRODUCTSName of Product - Welded PipesElectricity- (KWH)Name of Product – M.S. Pipes (ERW)Electricity- (KWH)Name of Product – PowerElectricity- (KWH)Name of Product – M.S.PlatesElectricity- (KWH)Furnace Oil (K.Ltrs.)Name of Product – H.R.CoilsElectricity- (KWH)LPG (MT)FURNACE OIL (K.LTRS)STANDARD--------23,218.69 14,760.234,788.93 3,304.1520.63 22.39Nil<strong>2009</strong>-20<strong>10</strong>150.3498.914.49220.6860.53185.4918.9360.53Nil2008-<strong>2009</strong>149.381<strong>10</strong>.094.38255.0077.00---* The Captive Power Plant (CPP) is dual fuel operated and diesel is used as pilot and gas as main fuel. Consumption ratio varies according to load. Thereforeindividual output fuel wise can not be worked out.14
01 Specific areas in which R&D is carried out by theCompanyFORM B(See Rule 2)Form for disclosure of particulars with respect to absorption.Research and Development (R&D)C rp LtdBharuch Pipe Mill:During the year the company carried out R&D activities in the area of productdevelopment including developing API X-70 & X -80 sour service and it’s higherwall thick sour service pipe.Anjar Pipe/Plate Mill:During the year, the Company carried out R&D activities in the area of:(i) Designing of lean chemistry slab, for IS 2062 Grade rolling by controllingmill process parameters.(ii) Executed API-X-70 grade order in 18.31X3261 mm from lean chemistry.(iii) Introduced coil as additional product range.02 Benefits derived as a result of the above R&D.03 Future plan of action04Expenditure on R&D(a) Capital(b) Recurring(c) Total(d) Total R&D expenditure as a percentage of totalturnovers.Bharuch & Anjar Pipe Mill:The R&D activity resulted in increase product range available.Anjar Plate Mill:The R&D activity resulted in reducing the raw material cost .Bharuch & Anjar Pipe Mill:The Company has an ongoing program for carrying out research anddevelopment which helps the Company to improve production processes andto innovate higher grade products. The Company seeks to enhance itsposition as a leading pipe manufacturing company by further developing andimproving its products for oil, gas and other applications with a specialemphasis on LSAW and HSAW pipes and pipe coating.Anjar Plate Mill:The Company has an ongoing program for carrying out research anddevelopment which helps the Company to improve production processes andto innovate higher grade products.Development for grade API –X-80 and sour gas application.Rs. NIL mnRs. 3.12 mnRs. 3.12 mn0.004%Technology absorption, adaptation and innovation.01 Efforts, in brief, made towards technology absorption, -adaptation and innovation.02 Benefits derived as a result of the above efforts, etc.Product improvement, cost reduction, productdevelopment, import substitution, etc.03 In case of imported technology (imported during thelast 5 years reckoned from the beginning of thefinancial year), following information may be furnished:--(a)Technology imported(b) Year of import(c) Has technology been fully absorbed?(d) If not fully absorbed, areas where this has nottaken place, reasons therefore and future plans ofaction.Foreign exchange earnings and outgo :Activities relating to exports;Initiatives taken to increase exports;Development of new Markets like Mexico; Australia, Czech Republic, Yemen etc.More then 20 Clients visited, audited and approved the mill for future jobsespecially clients approving the Plate & Coil mill Division. Names include TOTAL,SHELL, ADCO, KPO, NGC, Saudi Aramco (for Spiral Mill), Air Product, Acergy.Development of new export markets for products andservices and export plans;Total foreign exchange used and earned.Development of products for higher strength sour service requirements.Used : Rs. 27.<strong>10</strong> bnEarned : Rs. 23.06 bn15
th15 <strong>Annual</strong> <strong>Report</strong> <strong>2009</strong>-<strong>10</strong>With our people ...... towards the journey of excellence
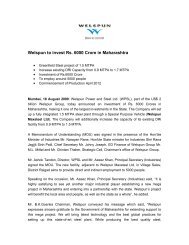
WELSPUNSupplier of....Deepest Pipeline (Gulf of Mexico)Heaviest Pipeline (Middle East)Longest Pipeline (U.S.)Highest Pipeline (Peru)
th15 <strong>Annual</strong> <strong>Report</strong> <strong>2009</strong>-<strong>10</strong>Key Management TeamMr. B.K. GoenkaChairman & Managing DirectorMr. R.R. MandawewalaDirectorMr. M.L. MittalExecutive Director (Finance)Mr. Lauri MalkkiChief Executive OfficerMr. B.R. JajuDirector & Chief Financial OfficerMr. Prashant MukherjeeDirector, Welded PipesMr. L. T. HotwaniDirector, Supply Chain ManagementMr. Asim ChakrabortyDirector (Whole time)Mr. Akhil JindalDirector, Corporate AffairsMr. Vipul MathurSenior Vice President,Plate & Coil Mill18
C rp LtdCORPORATE GOVERNANCE REPORTI. PHILOSOPHY ON CORPORATE GOVERNANCE.The Board of Directors of the Company acts as a trustee and assumes fiduciary responsibility of protecting the interests of theshareholders and other stakeholders of the Company. The Board supports the broad principles of Corporate Governance. In orderto attain the highest-level good Corporate Governance practice, Board lays strong emphasis on transparency, accountability andintegrity.II.BOARD OF DIRECTORS.The Company's Board comprises individuals with considerable experience and expertise across a range of field such as finance &accounts, general management and business strategy.Composition and category of directors; attendance of each director at the board meetings and the last AGM; number of othercompanies on the Board or Committees of which, a director is a Director, Member or Chairperson; and number of board meetings,dates on which held, are as under:Name of the Director(01 ) Mr. B.K.Goenka -Chairman & Managing Director(02) Mr. Braja K.Mishra -Director$(03) Mr. M.L.Mittal – Executive Director-Finance(04) Mr. R.R.Mandawewala(05 ) Mr. K.H.Viswanathan(06) Mr. Rajkumar Jain(07) Mr. Ram Gopal Sharma(08) Mr. Nirmal Gangwal(09) Mr. N.Shankar -Nominee EXIM Bank(<strong>10</strong>) Mr. Asim Chakraborty - Whole timeCategoryBoardMeetingAttendedduring theYear <strong>2009</strong>-<strong>10</strong>Attendanceat the LastAGMP, E 7 NoNE, NI 1 NoE 8 NoP, NE 5 NoNE, I 8 NoNE, I 8 YesNE, I 8 NoNE, I 6 NoNE, I, L 4 NoE, NI 3 YesNo. of other Directorship(as last declared to theCompany)Pub. Pvt Other14 5 4- 1 -11 3 313 2 162 3 -2 2 -4 - -3 2 -1 - -- 1 -Member /Chairperson inNo. of BoardCommitteesincluding otherCompanies ( aslast declared tothe Company)!6M-5M1C, 4M4C, 1M3C, 1M1C, 3M4M1M-! Chairmanship/membership of the Audit Committee and the Shareholders' Grievance Committee alone considered$ Ceased to be a director due to resignation w.e.f. 3rd October <strong>2009</strong>.Abbreviations:P = Promoter, I = Independent, NI = Non Independent, E = Executive Director, NE = Non-Executive Director, L = Lenders, C=Chairperson,M=Member.8 meetings of the Board of Directors were held during the financial year <strong>2009</strong>-<strong>10</strong> on the following dates: 20th April <strong>2009</strong>, 29th May <strong>2009</strong>, 16th July <strong>2009</strong>,3rd October <strong>2009</strong>, 26th October, <strong>2009</strong>, 31st December <strong>2009</strong>, 21st January 20<strong>10</strong> and 18th March 20<strong>10</strong>.III.AUDIT COMMITTEEa) Terms of reference: The terms of reference stipulated by the Board of Directors to the Audit Committee are as containedunder clause 49 of the Listing Agreement.b) CompositionThe Audit Committee was constituted by the Board of Directors at its meeting held on 23rd August, 1997 and was reconstitutedfrom time to time. The Committee comprises 4 non-executive independent directors. The Chairman of theCommittee is an independent director. The composition of the Committee and attendance of the members is givenhereunder:Name of the Member Member/ Chairman Number of Meetings AttendedMr. Rajkumar JainChairman 8Mr. K.H.ViswanathanMember 8Mr. Ram Gopal SharmaMr. N. ShankarMemberMember838 meetings of the Audit Committee of the Board of Directors were held during the financial year <strong>2009</strong>-<strong>10</strong> on following dates: 29th May<strong>2009</strong>, 16th July <strong>2009</strong>, 20th July <strong>2009</strong>, 26th October, <strong>2009</strong>, 5th November <strong>2009</strong>, 17th November <strong>2009</strong>, 21st January 20<strong>10</strong> and 1st February 20<strong>10</strong>.19
th15 <strong>Annual</strong> <strong>Report</strong> <strong>2009</strong>-<strong>10</strong>IV.REMUNERATION COMMITTEEThe Company has duly constituted Remuneration Committee consisting of independent, non-executive directors. During the yearunder review, 1 meeting of the Committee was held on 20th April <strong>2009</strong>. Terms of Reference, composition, remuneration paid toexecutive and non-executive directors are as under:a) Terms of referenceTo recommend appointment of, and remuneration to, Managerial Personnel and review thereof from time to time.b) Composition of the committeeThe Committee comprises of 3 independent and non-executive directors as on date of this <strong>Report</strong> viz. Mr. Rajkumar Jain,Mr. K.H. Viswanathan and Mr.Ramgopal Sharma.c) Remuneration policy:Particulars of pecuniary relationship or transaction of the Non-Executive Directors vis-à-vis the Company and remunerationto Executive Directors including the details of remuneration and sitting fees paid/ payable to the directors for the financialyear <strong>2009</strong>-<strong>10</strong> are as under:Name of the Director(01)Mr. B.K.GoenkaChairman & ManagingDirector(02) Mr. M.L.MittalExecutive Director-FinanceSalary &AllowanceRs.5. 50millionRs.9.0million(03) Mr. Asim Chakraborty Rs.5.74Director (Whole time) millionPerquisites Commission ServiceContract/TenureNil 1%commissionon profits ascomputedu/s. 349 &350 of theAct.Yes / 5yearsending 30 thJune 2012Nil Nil Yes/ 5yearsending 30 thRs.0 .76millionJune 2013Nil Yes/ 5yearsending 19 thApril 2014NoticePeriod1month1month1monthSeveranceFeesStockOptionSittingFeesNil Nil NilNil 150,000 NilNil 50,000 NilNo remuneration, perquisite or sitting fees was paid to, no service contract was entered in to with, and no stock options havebeen granted to Mr. R. R. Mandawewala.No remuneration or perquisite was paid to, and no service contract was entered into with, but the sitting fees were paid to thefollowing directors/ nominating institutions for attending meetings of Board / Committees.Name of the Director(01) Mr. K.H.Viswanathan(02) Mr. Rajkumar Jain(03) Mr. Ram Gopal Sharma(04) Mr. Nirmal Gangwal(05) Mr. N.Shankar (Nominee EXIM Bank)(06) Mr. Braja K.MishraSitting FeesRs.<strong>10</strong>9,000Rs.178,000Rs.<strong>10</strong>9,000Rs.48,000Rs.47,000Rs.8,000None of the directors had any transaction with the Company. However, transactions have taken place with some of thecompanies in which a director holds directorship. These transactions took place at the prevailing market value as normalcommercial transaction and the same were disclosed to the Board.V. SHARE TRANSFER AND INVESTOR'S GRIEVANCE COMMITTEEa) CompositionThe Share Transfer and Investor Grievance Committee was constituted in accordance with the Clause 49 of the ListingAgreement. The Chairman of the Committee is a non-executive director. The composition of the Committee is givenhereunder:Name of the Member Member/ ChairmanMr. K.H.ViswanathanChairmanMr. B.K.GoenkaMemberMr. R.R.MandawewalaMemberMr. M.L.MittalMemberCompliance Officer: Mr. Pradeep Joshi - Company Secretary20
) Number of Shareholders complaints / requests received during the yearC rp LtdDuring the year under review, total 121 investor's complaints / requests were received. Break-up and number of complaints /requests received under different category is given hereunder:1. Payment of Dividend : 782. Non-Transfer / delay in transfer / split etc. of Shares : 193. Non receipt of <strong>Annual</strong> <strong>Report</strong> : <strong>10</strong>4. Non receipt of Duplicate / Exchange Share Certificates : 55. Others : 9All the complaints / requests received during the year under report were resolved within the time to the satisfaction of theinvestors/shareholders and no complaints were pending as on 31st March 20<strong>10</strong> for more than 30 days. All the shares receivedfor transfer / transmission have been transferred / transmitted and no transfer is pending as on 31st March 20<strong>10</strong>.VI.GENERAL BODY MEETINGSThe details of <strong>Annual</strong> General Meetings held in the last three years are given hereunder:Meeting12 th <strong>Annual</strong> General Meeting13 th <strong>Annual</strong> General Meeting14 th <strong>Annual</strong> General MeetingDay & Date of Meeting TimeWednesday,29 th August 2007Thursday,4 th September 2008Friday,4 th September <strong>2009</strong>12.30 pm12.30 pm11.30 amDuring the year under report, the following resolutions were passed as a special resolution:- Resolution dated 4th September <strong>2009</strong> u/s 198, 269, 309, 3<strong>10</strong> and Schedule XIII of the Companies Act, 1956 for appointmentof, and fixing of remuneration to Mr. Asim Chakraborty as the Director (whole time); and- Resolution dated 25th June <strong>2009</strong> u/s 81(1A) of the Companies Act, 1956 authorizing issue of further capital to persons otherthan existing shareholders of the Company.PlaceRegistered Office: Village Jolva andVadadla, Near Dahej, Taluka Vagra, Dist.Bharuch, Gujarat – 392 130Same as aboveRegistered Office : <strong>Welspun</strong> City, VillageVersamedi, Taluka Anjar, Dist. Kutch,Gujarat – 3701<strong>10</strong>VII. MANAGEMENTa) Management Discussion and AnalysisManagement Discussion and Analysis of various businesses of the Company is separately given in the <strong>Annual</strong> <strong>Report</strong>.b) Disclosures by management to the BoardAll details relating to financial and commercial transactions where directors may have a pecuniary interest are provided tothe Board, and the interested directors neither participate in the discussion, nor do they vote on such matters.VIII. DISCLOSUREa) Related Party TransactionsFor related party transactions, refer Note No. 18 of Notes to Accounts annexed to the Balance Sheet and Profit & LossAccount.b) Non-ComplianceThere were no non-compliance by the Company during the year under report and hence no penalties and stricture wereimposed on the Company by the Stock Exchange or SEBI or any authority on any matter related to capital market during last 3years.c) Whistle Blower PolicyThe Company has a Whistle Blower Policy and no personnel have been denied access to the Audit Committee.d) Code of ConductThe Company has Code of Conduct for Board members and senior management personnel. A copy of the Code has been puton the Company's website for information of all the members of the Board and management personnel.All Board members and senior management personnel have affirmed compliance of the same.21
th15 <strong>Annual</strong> <strong>Report</strong> <strong>2009</strong>-<strong>10</strong>A declaration signed by the Managing Director of the Company is given below:“I hereby confirmed that all Board members and senior management personnel have affirmed compliance with the Code ofConduct of the Company.”B. K. GoenkaChairman & Managing Directore) Certification by Chief Financial OfficerA certificate obtained from Chief Financial Officer on the Financial Statements of the Company in terms of Clause 49 of theListing Agreement was placed before the Board, who took note of it and took the same on record.f) Secretarial AuditA qualified practicing Company Secretary carried out the Secretarial Audit on quarterly basis to reconcile the share capitalwith National Securities Depository Services Ltd. (“NSDL”) and Central Depository Services Ltd. (“CDSL”) and the total issuedand listed capital. The audit confirms that the total issued / paid-up capital is in agreement with total number of shares inphysical forms and total number of demat shares held with NSDL and CDSL.g) Brief resume of Director being appointed / re-appointed.A brief resume, nature of expertise in specific functional areas, names of companies in which the person already holdsdirectorship and membership of committees of the Board and his shareholdings in the Company forms part of the Notice ofthe <strong>Annual</strong> General Meeting, annexed to this <strong>Annual</strong> <strong>Report</strong>.h) Accounting StandardsThe Accounting Standards laid down by the Institute of Chartered Accountants of India and applicable to the Company werefollowed by the Company in preparation of accounts of the Company.i) Details (in aggregate) of shares in the suspense account including freeze on their voting rights:There are no unclaimed shares and hence no suspense account is required to be opened and credited with such shares andalso there is no freeze on voting rights of any shares.IX.MEANS OF COMMUNICATIONThe quarterly, half-yearly and yearly financial results of the Company are sent out to the Stock Exchanges immediately after theyare approved by the Board. The Company published its un-audited / audited financial results in Western Times (English andGujarati editions), Financial Express (English Edition).These results are simultaneously posted on the website of the Company at www.welspunpipes.com and the website of Securitiesand Exchange Board of India at www.sebiedifar.nic.in. The official press release is also available on the website of the Company.X. GENERAL SHAREHOLDER INFORMATION.1. <strong>Annual</strong> General Meeting shall be held on Tuesday, 31st August 20<strong>10</strong> at <strong>10</strong>:00 a.m. at the Registered Office of the Company at“<strong>Welspun</strong> City”, Village Versamedi, Taluka Anjar, Dist. Kutch, Gujarat - 3701<strong>10</strong>.2. Financial Year of the Company is 1st April to 31st March.3. Date of Book Closure: Friday, 7th May 20<strong>10</strong> to Tuesday, 11th May 20<strong>10</strong> (both days inclusive).4. Dividend payment date: Friday, 3rd September 20<strong>10</strong>.5. Listing on Stock Exchanges: National Stock Exchange of India Ltd. (NSE) and Bombay Stock Exchange Ltd., Mumbai (BSE),Singapore Securities Trading Ltd. (SGX-ST)<strong>Annual</strong> listing fees for the year 20<strong>10</strong>-11 have been paid to BSE, NSE and SGX-ST.Stock Code /Symbol:Bombay Stock Exchange Ltd. : 532144National Stock Exchange of India Ltd.ISIN No. (For dematerialized shares): WELCORP; Series: EQ: INE 191B0<strong>10</strong>2522
C rp Ltd6. Stock Market price data, high & low price of equity shares on Bombay Stock Exchange Ltd. and the National StockExchange of India Ltd. are as under:BSENSEMonth High (Rs.) Low (Rs.)High (Rs.)Low (Rs.)April-<strong>2009</strong> <strong>10</strong>8.85 74.15 <strong>10</strong>8.70 74.<strong>10</strong>May-<strong>2009</strong> 175.00 99.85 175.75 99.65June-<strong>2009</strong> 243.70 171.30 240.90 170.00July-<strong>2009</strong> 239.50 170.05 239.95 170.00August-<strong>2009</strong> 249.90 200.20 249.80 200.00September-<strong>2009</strong> 278.00 226.00 278.00 225.55October-<strong>2009</strong> 289.50 251.50 289.90 251.00November-<strong>2009</strong> 296.35 244.00 296.30 243.50December-<strong>2009</strong> 283.90 255.50 282.90 255.30January-20<strong>10</strong> 286.95 250.00 286.85 249.00February-20<strong>10</strong> 269.90 229.15 270.00 228.15March-20<strong>10</strong> 284.35 241.60 284.90 241.507. Performance in comparison to broad-based indices i.e. BSE- Sensex and NSE- S&P Nifty is as under:MonthBSE Index(Sensex)Closing price of Shares(Rs.)NSE(S&P Nifty)April-<strong>2009</strong>11,403.25 <strong>10</strong>0.60 3473.95May-<strong>2009</strong>14,625.25 168.85 4448.95June-<strong>2009</strong>14,493.84 192.65 4291.<strong>10</strong>July-<strong>2009</strong>15,670.31 226.80 4636.45August-<strong>2009</strong>15,666.64 234.35 4662.<strong>10</strong>September-<strong>2009</strong>17,126.84 260.00 5083.95October-<strong>2009</strong>15,896.28 256.20 4711.70November-<strong>2009</strong>16,926.22 276.60 5032.70December-<strong>2009</strong>17,464.81 270.05 5201.05January-20<strong>10</strong>16,357.96 262.70 4882.05February-20<strong>10</strong>16,429.55 240.90 4922.30March-20<strong>10</strong> 17,527.77 273.25 5249.<strong>10</strong>Closing price ofShares (Rs.)<strong>10</strong>0.60169.00192.65226.95234.40260.05257.20277.45270.05262.45240.30272.208. Registrar and Transfer Agent: The Company has appointed Registrar and Transfer Agent to handle the share /debenturetransfer work and to resolve the complaints of shareholders/ debenture holders. Name, Address and telephone number ofRegistrar and Transfer Agent is given hereunder:M/s. Link Intime India Pvt. Ltd.Unit : <strong>Welspun</strong> Corp Limited(Formerly known as : <strong>Welspun</strong>-Gujarat Stahl Rohren Ltd.)C-13, Pannalal Silk Mills Compound,LBS Marg, Bhandup (West),Mumbai 400 078Email : rnt.helpdesk@linkintime.co.inTele. No.: +91-022-25946970Fax No. : +91-022-259469699. Debentures and Debenture TrusteeThe Secured Non Convertible Debentures issued by the Company are listed on BSE with the following identification numbers:BSE Scrip CodeISIN Nos.945649 INE 191B07030945650 INE 191B07048945651 INE 191B07055945652 INE 191B0706323
th15 <strong>Annual</strong> <strong>Report</strong> <strong>2009</strong>-<strong>10</strong>Debenture Trustee:IDBI Trusteeship Services Ltd.,Asian Building, Ground floor,17, R. Kamani Marg, Ballard Estate,Near Custom House, Mumbai-400 023<strong>10</strong>. Share / Debenture Transfer System: Our Registrar and Transfer Agent registers shares sent for transfer in physical form within15 days from the receipt of the documents, if the same are found in order. Shares under objection are returned within twoweeks.11. Distribution of Shareholding:Shareholding Pattern as on 31st March, 20<strong>10</strong>Number of SharesNo. of shareholdersPercentage ofShareholdersNo. of SharesUpto – 50068,514 92.44 6,801,513501-1,0002,896 3.91 2,260,4<strong>10</strong>1,001-2,0001,201 1.62 1,815,0672,001-3,000448 0.60 1,144,2443,001-4,000222 0.30 793,7514,001-5,000155 0.01 733,3665,001-<strong>10</strong>,000250 0.34 1,847,777<strong>10</strong>,001 and above433 0.58 188,926,282Total 74,119 <strong>10</strong>0.00 204,322,4<strong>10</strong>Percentage ofShares held3.331.1<strong>10</strong>.890.560.390.360.9092.47<strong>10</strong>0.0012. Shareholding of the Directors of the Company as on 31st March, 20<strong>10</strong>Name of the Director No of shares %Mr. B.K.Goenka140 0.00Mr. R.R.Mandawewala140 0.00Mr. Asim Chakraborty50,700 0.02Besides above, the following directors of the Company have been granted Stock Options pursuant to Employees Stock OptionScheme entitling to subscribe for equity shares in the Company:Name of the DirectorMr. Braja K. Mishra (net of Options exercised)Mr. M.L.MittalMr. Asim Chakraborty* Lapsed due to resignation.No of Options195,000 *150,000 #50,000 ## Entire Options exercised during financial year <strong>2009</strong>-<strong>10</strong>.Apart from the above, none of the directors hold any share or convertible securities in the Company.13. De-materialization of shares and liquidity: As on 31st March 20<strong>10</strong>, 92.95% shares have been dematerialized and havereasonable liquidity on Bombay Stock Exchange Ltd. and National Stock Exchange of India Ltd.14. Outstanding Employee Stock Options, Convertible Bonds conversion date and likely impact on equity share capital is asunder:Outstanding as on 31.03.20<strong>10</strong>897,000 Options vested but not exercised representingequal number of equity shares to be exercised during08.01.2008 – 08.01.20<strong>10</strong>47,500 Options not vested and not exercised representingequal number of equity shares to be exercised during20.04.20<strong>10</strong> – 20.04.20121,500 Foreign Currency Convertible Bonds of US$<strong>10</strong>0,000each convertible in to 24,0<strong>10</strong>,000 equity shares during27.11.<strong>2009</strong> -17.<strong>10</strong>.2014Impact on equity share capitalIncrease in equity capital by 897,000 equity shares ofRs.5/-each at a premium of Rs. 75.00 per shareIncrease in equity capital by 47,500 equity shares ofRs.5/-each at a premium of Rs. 61.75 per shareIncrease in equity capital by 24,0<strong>10</strong>,000 equity sharesof Rs.5/-each at a premium of Rs. 295 per share15. Disclosure of Shares held in suspense account under Clause 5A of the Listing Agreement.Disclosure under Clause 5A of the Listing Agreement is not applicable as none of the shares of the Company are lying undersuspense account.24
C rp Ltd16. Plant locationsi) Village Versamedi, Tal-Anjar, Dist.-Kutch, Gujarat 3701<strong>10</strong>ii) Village Jolva and Vadadla, Near Dahej, Tal: Vagra, Dist: Bharuch, Gujarat 392130iii) KIADB Industrial Area, Gejjalagere, Taluka Maddur, Dist. Mandya, Karnataka -571428iv)9301, Frazier Pike, Little Rock, Arkansas 72205 USA (Subsidiary's plant)17. Address for correspondenceThe Company Secretary,<strong>Welspun</strong> Corp Limited(Formerly Known as <strong>Welspun</strong>-Gujarat Stahl Rohren Ltd.),5th Floor, <strong>Welspun</strong> House,Kamala Mills Compound,Senapati Bapat Marg, Lower Parel,Mumbai - 400 013.Tel: +91-22-66136000; +91-22-24908000, Fax: +91-22-24908020 /21e-mail: companysecretary_wgsrl@welspun.comCertificate of Practicing Company Secretary on Corporate Governance <strong>Report</strong>To the Members of<strong>Welspun</strong> Corp Limited(Formerly Known as <strong>Welspun</strong>-Gujarat Stahl Rohren Limited),We have examined the compliance of conditions of Corporate Governance by <strong>Welspun</strong> Corp Limited (Formerly known as <strong>Welspun</strong>-Gujarat Stahl Rohren Ltd.), for the year ended on 31st March 20<strong>10</strong>, as stipulated in Clause 49 of the Listing Agreement of the saidCompany with stock exchange.The compliance of conditions of Corporate Governance is the responsibility of the management. Our examination was limited toprocedures and implementation thereof, adopted by the Company for ensuring the compliance of the conditions of the CorporateGovernance. It is neither an audit nor an expression of opinion on the financial statements of the Company.In our opinion and to the best of our information and according to the explanation given to us, we certify that the Company hascomplied with the conditions of Corporate Governance as stipulated in the above-mentioned Listing Agreement.We state that in respect of investor grievances received during the year ended 31st March 20<strong>10</strong>, the Registrars of the Company havecertified that as at 31st March 20<strong>10</strong>, there were no investor grievances remaining unattended/pending for more than 30 days.We further state that such compliance is neither an assurance as to the future viability of the Company nor the efficiency oreffectiveness with which the management has conducted the affairs of the Company.For S.S.Risbud & Co.Company SecretariesSanjay RisbudProprietorCertificate of Practice No. 5117Mumbai27th April 20<strong>10</strong>25
th15 <strong>Annual</strong> <strong>Report</strong> <strong>2009</strong>-<strong>10</strong>From local expertise ...
C rp Ltd...To global reachFROM LOCAL EXPERTISE - TO GLOBAL REACHIt all began fifteen years back at Dahej, Gujarat, India. The first Line Pipe facility wascommissioned, marking the beginning of a journey which today capitulates and caters toclients across 35 countries worldwide. These clients are the who's who of the Oil and Gasindustries across the globe and <strong>Welspun</strong> is “Making India Proud” by offering the best in -class products to its customers.
th15 <strong>Annual</strong> <strong>Report</strong> <strong>2009</strong>-<strong>10</strong>Management Discussion and AnalysisThe Management Discussion and Analysis (MD&A) should be read in conjunction with the Audited Consolidated Financial Statement of<strong>Welspun</strong> Corp Limited (formerly known as <strong>Welspun</strong>-Gujarat Stahl Rohren Limited) (”<strong>Welspun</strong>” or the “Company”), and the notesthereto for the year ended 31 March, 20<strong>10</strong>. This MD&A covers <strong>Welspun</strong>'s financial position and operations for the year ended 31March, 20<strong>10</strong>. Amounts are stated in Indian Rupees unless otherwise indicated. Abbreviations and acronyms used in this MD&A areidentified in the Glossary of Terms in <strong>Welspun</strong>'s <strong>Annual</strong> <strong>Report</strong> of 20<strong>10</strong>. The numbers used in the analysis are on a consolidated basis, thecorresponding number for the previous year has been regrouped and reclassified, wherever necessary.Forward-Looking StatementsThis report contains forward-looking statements, which may be identified by their use of words like 'plans', 'expects', 'will','anticipates','believes', 'intends', 'projects', 'estimates' or other words of similar meaning. All statements that address expectations or projectionsabout the future, including but not limited to statements about the Company's strategy for growth, product development, marketposition, expenditures, and financial results, are forward-looking statements. Forward-looking statements are based on certainassumptions and expectations of future events. The Company assumes no responsibility to publicly amend, modify or revise anyforward looking statements, on the basis of any subsequent developments, information or events.Company OverviewWe have developed unmatched expertise to manufacture pipes of varying qualities, grades and sizes that are used in long distancetransportation of oil & gas for critical purposes and in complex regions. We can produce pipes ranging from ½ inches to <strong>10</strong>0 inches inouter diameter and up to 40 mm wall thickness. The Company is among the few, having the capability to manufacturer high grade pipesof upto X 80. We had also supplied pipes for “The Independence Trail” project- world's deepest pipeline, laid below 8,000 ft of water.On account of these capabilities the Company has become approved supplier to over 50 major oil and gas companies across the world.These include not only Indian oil and gas companies like Reliance Industries Limited, GAIL, ONGC and Indian Oil Corporation, but alsointernational oil and gas companies like British Petroleum, Golden Pass Pipeline LP (Exxon Mobil), Enterprise, Peru LNG S.R.L. (HuntOil), Saudi Arabian Oil Company (Saudi Aramco), Ruby (Elpaso), Qatar Petro DOW and Gazprom (Stroytransgaz). In global pipelineindustry, approval from clients acts as a major entry barrier as this process can take up to 2-3 years. With a total production capacity of1.5 million MTPA, we are one of the largest pipe producers in the world and has supplied high quality pipes for critical projects fromdeep oceans to tough mountainous terrain. We are currently involved in supplying pipes for many of the ongoing projects in the U.S.This gives us an edge over a number of our peer companies, as approvals are the pre-requisite for getting short-listed for more ordersfrom customers and our oil and gas customers prefer to deal with larger entities. Today, we are one of the very few suppliers in theworld who are qualified for many of the significant pipe contracts across the globe.The state-of-the-art Plate cum Coil mill in India (Anjar) with a capacity of 1.5 million MT can produce API grade of Plates and Coils. Thisbackward integration assures high grade plate and coil availability for pipe manufacturing.In the last 12 years, we have expanded our operations to more than 30 countries, covering most of the locations where oil and gasassets are located across the World.Global EconomyGlobal Steel Pipes Industry and DemandGlobally pipeline demand is closely linked with the growth in the energy consumption and investments in the sector which in turndepends on level of economic activities in oil and gas upstream. Energy investment worldwide has plunged over past year in the face ofa tougher financing environment, weakening final demand for energy and lower cash flow. All these factors stem from the financial andeconomic crisis. Energy companies are drilling fewer oil and gas wells and cutting back spending on refineries, pipelines and powerstations. Many ongoing projects have been slowed and a number of planned projects have been either postponed or cancelled. In theoil and gas sector, most companies have announced cutbacks in capital spending, as well as project delays and cancellations, mainly asa result of lower cash flow. International Energy Agency (IEA) in its World Energy Outlook <strong>2009</strong> estimated that global upstream oil andgas investment budgets for <strong>2009</strong> have been cut by around 19% compared with 2008- a reduction of over US$ 90 billion.World primary energy demand to grow @1.5% per year between 2007 and 2030The IEA’s recent report estimates that for the first time since 1981, energy use is set to fall in <strong>2009</strong> as a result of the financial and28
C rp Ltdeconomic crisis but also says that with current liberal economic policies of governments across the world, it would quickly resume itslong term upward trend once economic recovery is underway. As per IEA estimates, world primary energy demand is projected toincrease by 1.5% per year between 2007 and 2030, from just over 12,000 million tonnes of oil equivalent (Mtoe) to 16,800 Mtoe- anover all increase of 40%. Developing Asian countries are the main drivers of this growth, followed by Middle East. The new estimatesare a decline over its last year estimates on account of the global economic meltdown, on an average, the demand declined marginallyin 2007-<strong>10</strong> by 2%. Demand growth will rebound thereafter, averaging 2.5% per year in 20<strong>10</strong>-15. The pace of demand growth slackensprogressively after 2015, as emerging economies mature and global population slows. IEA projects global oil demand at 83.2 millionbarrels per day ("mb/d") (-3.0 percent or -2.6 mb/d when compared with 2008).Over half of all energy investment worldwide is required in developing countries, where demand and production are projected toincrease fastest. Oil & natural gas are expected to remain primary sources and are expected to meet 52% of the global demand. IEAestimates that the world requires investment to the tune of $12 trillion in oil & gas sector in next 20 years, implying an annualinvestment of over $500 billion.Global Oil Demand (2007-<strong>2009</strong>)(million barrels per day)AfricaAmericaAsia/PacificEuropeFSUMiddle East1Q07 2Q07 3Q07 4Q07 2007 1Q08 2Q08 3Q08 4Q08 2008 1Q09 2Q09 3Q09 4Q09 <strong>2009</strong>3.0 3.0 3.0 3.1 3.0 3.1 3.1 3.1 3.1 3.1 3.2 3.1 3.0 3.2 3.131.1 31.0 31.3 31.2 31.2 30.5 30.5 29.8 30.0 30.2 29.2 28.8 29.2 29.0 29.125.7 25.2 24.7 25.9 25.4 26.6 25.6 24.9 25.0 25.5 25.4 25.6 24.0 24.6 24.715.9 15.6 16.1 16.3 16.0 15.9 15.5 16.0 15.9 15.8 15.4 14.7 15.3 15.3 15.24.1 3.9 4.1 4.2 4.1 4.3 4.2 4.3 4.2 4.2 3.9 3.9 4.1 4.0 4.06.3 6.4 6.6 6.3 6.4 6.6 7.0 7.4 6.8 7.0 6.7 7.3 7.7 7.1 7.2World86.0 85.0 85.8 87.2 86.0 86.9 85.8 85.4 85.0 85.8 83.8 82.3 83.4 83.3 83.2<strong>Annual</strong> Change (%)0.3 1.4 1.0 1.3 1.0 1.0 0.9 -0.5 -2.5 -0.3 -3.6 -4.0 -2.4 -1.9 -3.0<strong>Annual</strong> Change (mb/d)0.3 1.1 0.9 1.1 0.9 0.9 0.8 -0.4 -2.2 -0.2 -3.1 -3.4 -2.1 -1.7 -2.6Changes from last OMR (mb/d)-0.16 -0.02 -0.11 -0.09 -0.09 -0.05 -0.06 -0.08 -0.08 -0.07 -0.06 -0.50 -0.25 -0.23 -0.23Source: International Energy Agency/OECD; Oil Market <strong>Report</strong> May <strong>2009</strong>With the assumed resumption of global economic growth from 20<strong>10</strong>, demand for natural gas worldwide is set to resume its long-termupward trend. Low carbon content of gas relative to oil will act as a supportive factor to gas demand as world shifts more towardsgreener technologies. IEA estimates global gas demand to rise from 3.0 trillion cubic metres (tcm) in 2007 to 4.3 tcm in 2030, anaverage increase of 1.5% per year. The share of gas in the global primary energy mix is expected to increase marginally, from 20.9% in2007 to 21.2% in 2030. Over 80% of the increase in gas use between 2007 and 2030 is expected to occur in non-OECD countries, withthe biggest rise occurring in the Middle East. India and China will see the most rapid rates of increase.Global Pipe DemandAs discussed in the previous section demand for energy will continue to grow over the years and the new supply must be connected togrowing markets. Similarly, aging infrastructure must be replaced.Existing pipeline projectsBased on the existing pipeline projects, the global pipeline requirements is expected to be ~ 65 mn MT with a total of 714 projects withan opportunity of more than $78 bn across the globe for the next five years (Source: Simdex data, March 20<strong>10</strong> update) refer the tablegiven below:29
th15 <strong>Annual</strong> <strong>Report</strong> <strong>2009</strong>-<strong>10</strong>International Demand Outlook till 2015RegionNo. ofProjectsTotalLength(kms)Quantity(MMT)(1)BusinessPotential(US$ Bn)(2)North AmericaLatin AmericaEuropeAfricaMiddle EastAsiaAustralasiaTotal19344<strong>10</strong>25711515647714Note1. Conversion rate of 200 tonnes /km2. Conversion rate of $ 1,200 / ton67,22532,56143,23222,59450,06792,08516,537324,30113.456.518.654.52<strong>10</strong>.0118.423.3164.8616.137.81<strong>10</strong>.385.4212.0222.<strong>10</strong>3.9777.83Replacement of the old pipelinesAnother growth driver is the replacement of the old pipelines in USA. More than 1 mn miles of the total 1.5 mn miles of USA pipelineswere laid during the 1960's and 1970's. Since most of the pipelines have an economic life of ~ 30 years, there is a pressing need toreplace them in order to avoid systematic failure and supply disruptions. Considering that the annual production of pipes have beenover 16 - 17 mn tonnes, the replacement of even half of 1 mn miles of pipelines would take at least <strong>10</strong>-12 years to complete.New Gas is required to replace annual decline in existing gas supplies in North America, which shall enhance demand for newpipelinesThe <strong>Annual</strong> daily production in U.S and Canada of 70 Bcf/d is witnessing a decline at the rate of 20% p.a. This annual decline volume thatneeds to be replaced each year is 14.0 Bcf/d. Over the next five years a total of 70 Bcf/d of new gas needs to be brought on-stream tomaintain production at current rates.Shale GasShale gas is expected to gradually increase its share in total gas requirement over the next few years. US Shale Gas Supply is expected toreach over 14 bcf/d from nearly 5 Bcf/d in 2008. Shale gas addition to the supplies provides a huge potential for increase in pipelinesdemand over yearsBcf/d2018161412<strong>10</strong>8642HistoryForecastMarcellusWoodfor d/CaneyHaynesvilleFayettevilleBarnett02000 2005 20<strong>10</strong> 2015 2020(Source : TCPL Brochure 20<strong>10</strong>)Alaska Pipeline projectTransCanada and Exxon Mobil are working together on the Alaska Pipeline Project and cost estimates are in the range of $ 20 billion to $41 billion depending upon the option selected. The first option is a pipeline from Alaska's North Slope to Alberta, Canada, a distance ofapproximately 1,700 miles (2,737 kilometres) and shall require 48-inch diameter pipes with a capacity of 4.5 Bcf/d. The second optionwould transport natural gas from the North Slope to Valdez, Alaska, a distance of approximately 800 miles (1,287 kilometres). This scaleof project shall provide another boost to the demand for pipes.30
C rp LtdIndian Steel Pipe Demand overviewLow pipeline penetration in India provides huge potentialCurrently India is developing pipeline infrastructure, with total gas pipeline length of less than 15,000 km, which compares grimly with56,400 km in Pakistan and 18.3 lac km in USA. India has also one of the lowest pipelines spread per sq km of land at 0.003 km/sq km,compared with 1.08 km/sq for UK and 0.19 km/sq for US. This is mainly on account of lower share of natural gas in the primary energymix of the country; it contributes only 9% to the primary energy basket of the country, compared with 21% for world and 24% for OECDcountries.Natural Gas as a source of energy is growing at a rapid pace and shall grow the demand for pipelinesAt the time of independence, natural gas in India started with a negligible part in the total energy basket. Presently it has grown toabout 160 million standard cubic meters per day (MMSCMD). The major domestic producers of natural gas are Reliance IndustriesLimited, Oil & Natural Gas Corporation Limited (ONGC), Oil India Limited (OIL) and JVs of Tapti, Panna-Mukta and Ravv. Governmenthave also offered blocks under New Exploration Licensing Policy (NELP) to private and public sector companies with the right to marketgas at market determined prices. New explorations along with favorable policies of the government would increase a demand for gastransportation infrastructure.Pipeline transport is the most cost effective mode of transportation of petroleum products compared to road and railways. Despitethis, only limited quantities of the total petroleum products are transported through pipelines in India. This has been on account of lowlevel of investments in the past in laying of pipelines in India. However, this is expected to change in the coming years with large capexlined up by hydrocarbon companies and pipelines emerging as the preferred mode of transportation due to its inherent advantagessuch as lower operational cost, safety and protection against pilferage.Major Gas pipeline players have firmed plansMajor oil & gas pipeline players, GAIL, GSPL and RGTIL (Reliance Gas Transportation Infrastructure Ltd.) plan to lay around 13,066 km ofpipelines over the next 3-4 years. At a rate of 200 tonnes/km and conversion rate of US$ 1200/tonne, these three players are expectedto create a total business potential of US$ 3.2 bn. GAIL currently has total gas pipeline length of 7,220 km across India and by <strong>FY</strong>13, it isplanning to take it to 13,825 km with total capital expenditure of around US$ 2.7 bn.Domestic Demand for PipesCompanyTotal Length (kms) Quantity (KMT) (1) Business Potential (US$ in Bn) (2)GAIL6,725RGTIL3,630GSPL2,711Total 13,0661,3457265422,6131.60.90.73.2Note: (1) Conversion rate of 200 tonnes /km(2) Conversion rate of $1,200 / tonProposed pipeline of GAILPhase I by 2011 (Under Execution)Name of PipelineDahej - Vijaipur / Grep UpgradationDadri - Bawana - NangalChainsa - Jhajjhar - HissarSub TotalLength (Kms) Cost (Rs in Cr)1,<strong>10</strong>8 <strong>10</strong>,329621 2,340443 12012,172 13,870Phase II by 2012 (Approved in <strong>2009</strong>)Name of PipelineJagdishpur - HaldiaDabhol - BangaloreKochi - Mangalore - BangaloreSub TotalGrand TotalLength (Kms) Cost (Rs in Cr)2,050 7,5961,389 4,5431,114 3,0324,553 15,1716,725 29,041Source : GAIL India Investor Presentation, Nov <strong>2009</strong>31
th15 <strong>Annual</strong> <strong>Report</strong> <strong>2009</strong>-<strong>10</strong>Formation of the Petroleum & Natural Gas Regulatory Board to give boost to trunk pipelinesThe Petroleum & Natural Gas Regulatory Board (PNGRB) was formed by an Act of Parliament in 2006. The board was assigned to be thenodal agency to regulate the refining, processing, storage, transportation, distribution, marketing and sale of petroleum, petroleumproducts and natural gas excluding production of crude oil and natural gas.With the setting up of the PNGRB and new gas finds on India's eastern coast, heavy investment is being lined up for laying pipelinesacross the country. As per plans, the length of trunk pipelines is set to triple to 33,000 kms in the next 4-5 years. The PNGRB is currentlyevaluating Expression of Interests (EOI) from various companies for about 26 per cent of proposed pipe length and has already invitedEOI for around 2,500 km of the total capacity.City Gas Distribution set to take-offThe PNGRB issued a number of regulations pertaining to pipeline and CGD such as exclusivity, open access, tariffs, common carrierprincipal and approval for new projects.Once Section 16 of the PNGRB Act is notified, which is expected shortly, the board is expected to aggressively auction out licenses forCity Gas Distribution (CGD) networks in about 200 cities. This section authorizes PNRGB to issue licenses for City Gas Distribution (CGD)networks. Indraprastha Gas Ltd, which had a pre- PNGRB authorization for Compressed Natural Gas (CNG) operations in Ghaziabad,and Voice-of-India, a non-government organization, challenged PNGRB's move in the Delhi High Court. In January 20<strong>10</strong> the Court,ruled that PNGRB had no powers to issue licenses for retailing CNG and piped gas in cities as Section 16 had not been notified andauthorizations issued till then were not valid. The government now plans to notify Section 16 of the PGNRB Act which gives theregulatory board the authority to issue licenses for CGD networks which it plans to expand to more than 200 cities.In the first round of bidding, PGNRB issued licenses for CGD networks in 6 cities (Sonipat, Meerut, Kakinada, Dewas, Kota and Mathura).In the next round it was to award licenses to another 7 cities but deferred the process due to the court order. Twelve more cities will beup for bidding in the third round.Liquefied Natural Gas (LNG) terminals projects to enhance pipe demandIndia is importing LNG, which provides the energy security to the country. Players like Petronet LNG Limited, Shell and others havecreated and are creating large LNG terminals at various locations across the country (like Dahej, Hazira, Dabhol, Kochi, Ennore). Thisprovides another opportunity for pipe demand.Water Infrastructure projects: A Key driver for HSAW pipesEconomic growth, population expansion and the influx of people into cities have sharply raised India's water requirements. AsianDevelopment Bank (ADB) has doubled its investment on water from U$1.2 bn in 1999 to U$2 bn in 20<strong>10</strong> in the South and Southeast Asiaregion. In order to improve the sanitation levels as also to make available water to common man, the Government of India (GOI)launched the reform linked Jawaharlal Nehru National Urban Renewal Mission (JNNURM) along with Urban InfrastructureDevelopment Scheme for Small and Medium Towns (UIDSSMT) in December 2005. The total outlay for the Urban Infrastructure andGovernance component of JNNURM is Rs. 315 bn for the mission period 2005-2012. Water and sanitation sector which covers watersupply, sewage, solid waste management and storm water drainage accounts for about 73.4 % of the total number of projectssanctioned under JNNURM as on date and 80.8% of the total cost of projects sanctioned. In the absolute terms, the number of suchprojects sanctioned is 340 out of a total of 463 projects sanctioned under the scheme. Further under the Urban InfrastructureDevelopment Scheme for Small and Medium Towns (UIDSSMT), out of a total of 969 projects, the water and sanitation sector accountsfor 828 projects. The share of water and sanitation sector in terms of cost is around 92% i.e. Rs. 184 bn out of Rs. 198 bn. Looking at thequantum of spend under the aforesaid schemes, this provides a huge opportunity for HSAW pipe industry.32
C rp LtdSWOT Analysis of the Indian Pipe IndustryStrengths• Most economical mode of transport for liquids and gases.Logistics forms an important part of the cost for most of the oil and gas companies and the cost of transportation through pipelines is now being encouraged. Market surveys show that transportation through pipelines is significantly more cost effective incomparison to transportation by railways and roads.• Indian players are globally cost effective and competitiveThe cost of manufacturing is comparatively lower in India due to low labour and power cost as compared to the developedcountries.• Indian companies have won accreditations from major oil and gas companies across the GlobeSome of the Indian companies have won the accreditations from major oil & gas giants across the globe which gives a potentialstrength to the players to get orders.• Positive flow of orders for Indian pipe companiesThe Indian pipe companies are continuously getting orders across the globe based on its quality and timely delivery.Weaknesses• Working capital-intensive industry as projects are of long duration in terms of execution. Average execution period for anorder is about 9-12 months.• Higher dependence on government spending for pipeline network development.• The large number of unorganized players leading to tough competition.Opportunities• Low pipeline penetration in India compared to developed nations provides a huge opportunity in the domestic market.• Government thrust on infrastructure development, irrigation & water supply leading to the boom in the pipe demand.• Rising oil and gas exploration activities in difficult and distant locations provides an opportunity for pipe laying across thefinds for transporting the oil & gas to the refineries and consumers.• City gas pipe projects provide an opportunity in the domestic market.• Replacement of old pipelines in USA.Threats/ Risks• Volatility in Steel Prices• Global Economic Environment• Crude oil prices• Regulations affecting the pipe industry• Ability to acquire raw materials at reasonable costs• Foreign exchange fluctuations33
th15 <strong>Annual</strong> <strong>Report</strong> <strong>2009</strong>-<strong>10</strong><strong>Welspun</strong>'s Highlights• Expansion Plans :The increase in the global demand for pipes has led us to embark upon an expansion plan to add another 0.55 mn tonnes of linepipe to its existing capacity of 1.5 mn tonnes. The total outlay for the expansion has been marked at Rs 7 bn. Post expansion LSAWcapacity will increase to 0.70 mn tonnes from the current 0.35 mn tonnes and similarly HSAW capacity will increase to 1.1 mntonnes from the current 0.9 mn tonnes. Commercial production is expected to commence by the end of <strong>FY</strong>11. Proposedinvestment in Middle East facility with HSAW capacity of 0.27 mn tonnes. The Final capacity would be as under:(in ‘000 metric tonnes)LOCATIONDAHEJ ANJAR OTHER INDIA U.S. MIDDLE EAST TOTALPRODUCT(Proposed)LSAW (Existing) 350 350LSAW (New) 350 350LSAW(Total) 350 350 700HSAW (Existing) 50 500 350 900HSAW (New) 200 270 470HSAW(Total) 50 500 200 350 270 1,370HFIW / ERW 200 200TOTAL PIPES 400 1,050 200 350 270 2,270PLATES/COILS 1,500• Entering new markets in IndiaAs discussed above, in view of domestic opportunities, the Company is expanding it's HSAW capacity by 0.2mn tonnes bysetting up two manufacturing facilities each of 0.1 mn tonne in Bangalore and another at Central India respectively. Thefirst mill is expected to become operational by H1 <strong>FY</strong>11. The spiral plant will be located in Mandya near Bangalore in SouthernIndia and will cater largely to the needs of the water segment. The second plant is expected to become operational by the end of<strong>FY</strong>11, which will be located at Central India and will cater to the oil & gas segment. With the increased capacities, we arewell poised to tap the opportunities arising from the domestic market as well as the international market.• Strong order book positionThe order book has around 90% export orders with major part from premium market of North America. The current order bookstands at Rs. 64,300 Mn (US$ 1.3 bn) (as at 27th April 20<strong>10</strong>) which includes orders for both pipes and plates.• Enhanced visibility for new ordersAcccording to the current scenario there shall be an improvement in demand for pipes from the US, Europe and the Middle East.The Company is currently participating in several bids, both globally and domestically.• Plate cum Coil Mill:The Plate prices used to command higher premium over the slab prices over the years. During <strong>FY</strong> 09-<strong>10</strong>, the prices of the slab havemoved up but plate prices yet to see recovery as demand for plates from shipping industry and other applications (heavyconstruction, bridges, boiler plates, wind mill blade and others) is yet to recover. However, we are poised to manage the volumegrowth by bagging new orders from external clients in the domestic and international market. We have created a pool of trainedmanpower for producing API grade plates and are optimistic of improving the performance going forward. The initiative taken toopen 12 depots in major cities is helping to enhance the reach to the OEM's and trade sales. During the year we have supplied APIgrade plates to external customers, which establishes our ability in the international market.34
C rp Ltd<strong>Welspun</strong> - A SWOT analysisStrengthsWell-entrenched player in the global and domestic marketWe are, an accredited supplier to over 50 major oil and gas companies including British Petroleum, Golden Pass Pipeline LP (Exxon-Mobil), Enterprise, Peru LNG S.R.L. (Hunt Oil), Saudi Arabian Oil Company (Saudi Aramco), Ruby (Elpaso), Qatar Petro DOW andGazprom (Stroytransgaz) and having one of the largest pipe production capacities internationally. Accreditation by oil & gascompanies in most cases is the pre-requisite for getting short-listed, which in turn helps to secure orders from such customers.Today, we have become one of the few suppliers in the world who are approved as producer of pipes and plates.Cost efficiencyWe gain cost efficiencies as a result of the benefits associated with the scale. In addition, India's geographical proximity to thepotential markets of the Middle East, South East Asia and Africa gives us significant freight advantage over our competitors fromEurope, Japan and Russia. Besides, our plant facilities are located in close proximity to the major seaports on the Western coast ofIndia which minimises our inward and outward inland transportation costs making us internationally competitive. We also havean advantage over our international peers in respect of our India operations due to cheaper labor costs. We have been able tominimise importation costs of steel plates, the primary input for the manufacture of pipes, by integrating backwards with theplate and coil mill, adjacent to our pipe facility at Anjar. The plate and coil mill, is supplying wider-width and high-grade steelplates. The production of plates commenced in March 2008 whereas, the production of coils commenced in the current year.Manufacturing capabilitiesOur ability to manufacture pipes with low diameter-to-thickness (D/t) ratios and compliance with API requirements enable us toparticipate in a competitive environment and do challenging pipeline projects, such as in the Gulf of Mexico. We are one of the fewmanufacturers globally that has capacity to supply 56" diameter pipelines. Our technology and stringent quality and testingstandards allow us to produce and make us eligible to supply pipes for use in the offshore and deep-sea oil and gas applications.Strong management teamOur management team consists of individuals with strong academic backgrounds related to the industry. They hold qualificationsin engineering, architectural, business management and accounting. In a addition, our management team has considerableexperience with some members of this team having associate with the industry for over 2 decades. Members of the managementhave diverse skills which has helped us to emerge as a global player. The skill sets varies from sourcing, supply chainmanagement, cross-border and domestic capital raising and possess experience in funding expansion projects as well.Technological edgeOur thrust on continuous R&D has helped us improve production process with innovation of higher grade products and specialtyproducts for offshore as well as deep water projects. With the state-of-the-art technology, we have been able to offera complete range of pipes for all applications and solutions. Under strategic relationship with key vendors, we haveundertaken a program for developing high grade pipes for critical application. Our ability to make wide range of pipes from ½" to<strong>10</strong>0" in diameter, gives us a competitive advantage over other manufacturers. Our manufacturing facilities employ the latest J-C-Oprocess (for LSAW), a 3-stage process for pipe fabrication and Capello Tubi technology (for HSAW). Our state-of-the-art plate andcoil mill is capable of producing high quality plates and coils which are required to produce pipes.Fully integrated pipe manufacturer: Slabs to Plates and Plates & Coils to PipesThe Plate cum Coil Mill of 1.5 mn tones capacity which had become operational in March 2008 is capable of producing AmericanPetroleum Institute (API)-grade plates of width upto 4.5m and thickness up to 25 mm. The mill is capable to provide internalflexibility to take short gestation orders. The mill not only offers high end products to manufacture pipes, but also assures steelplates supply even when global market conditions are tight. Similarly, the coil mill will assure supply of coil for the manufacture ofHSAW & ERW pipes. This integration not only enhances margin but also assures constant supply of quality products which iscritical for the business.Access to Port FacilitiesAs we have access to port facilities our production facilities additionally provide strategic advantages due to their proximity tonational highways, seaports of Dahej, Kandla, Mundra and Mumbai in India; and Little Rock Port in USA through its own dedicatedjetty.35
th15 <strong>Annual</strong> <strong>Report</strong> <strong>2009</strong>-<strong>10</strong>WeaknessesHeavy reliance on export marketsWe have been exporting a major part of our production to countries like North America, South East Asia, Middle East, etc.exhibiting dependence on these markets. Nevertheless the domestic market which is growing with the recent new projectsannounced by domestic giants like GAIL and potential of newer projects shall provide larger opportunity in the domestic market.Reliance on bought-in slabs for plate productionRaw material for the products is steel slabs which is subject to market volatility in terms of price as well as availability leaving theCompany with some kind of uncertainty. The Company's policy to synchronize and book the raw material back-to-back to meetpipe production program mitigates the risk to a large extent.Opportunity• Strong Demand in Middle east and Asian MarketsWith the increase in the activity in oil & gas refineries as well as its transportation throughout the geography from the oil & gasfields, new projects are coming up in Middle East and Asian markets. This provides tremendous potential to tap these markets.• The huge replacement market in the USNorth America, which is having a huge network of pipelines which are more than 30-40 years old is a strong market for pipereplacement. As per studies, the current capacity would take about 25 years to meet replacement demand foreseen in the USalone. This with potential of new infrastructure projects excess of demand over supply in the years to come leaving greatopportunity for established suppliers to fully utilize capacity and also enhance it to achieve growth.Key US pipe projectsProject Owner/Operator Type Lenght (km) Commission date Project size(US$ bn)BisonFayetteville ExpressHorn River MainlinePalomar GasRockies ExpressSouthern LightsSunstoneNorth Central CorridorKestone Gulf CoastKeystoneNorth DakotaTexas AccessGateway pipelineTransCanadaKinder MorganTransCanadaTransCanadaKinder MorganEnbridgeTransCanadaTransCanadaTransCanadaTransCanadaEnbridgeEnbridgeEnbridgeGasGasGasGasGasGasGasGasOilOilOilOilOil Sands483299723471,0211,0789363003,1683,4371,5201,2291,15020<strong>10</strong>201120122011201220<strong>10</strong>201120<strong>10</strong>201220<strong>10</strong>20<strong>10</strong>201220141.001.300.341.306.002.202.340.927.007.000.152.601.93Source: Downstream Today, Anand Rathi Research• Large International projects planned 2011-2015Large projects are planned in various parts of the World for the period 2011-2015 which will provide various opportunities.• Backward integration into plates/coils to boost marginsOur backward integration with its state-of-the-art plate cum coil mill is adding to our margins by supplying plates internally tomanufacture the LSAW pipes and capture the value chain to boost the margins on the final product i.e. line pipes.• Better margins and capacity utilizationThe margins of the Company are improving with better capacity utilization .Threats / Risk FactorsFall in crude oil pricesInvestment in pipeline infrastructure depends on the level of E&P activities which in turn are dependent on crude oil prices. In 2008when the crude oil prices fell to US$ 35 per barrel level on account of global economic downturn, investments in building pipelineinfrastructure were deferred by global oil & gas majors leading to shrinking of order book of pipe manufacturers. But with improvingoutlook of global economy, crude oil prices have recovered significantly from their lows and we expect them to remain stronger.However, experts are of the opinion that the oil prices above US$ 60 per barrel makes most of the projects profitable and expect oilprice to be in a range of US$ 60 to US$ 80 per barrel.36
C rp LtdForex fluctuationsWith more than 80% of our revenues coming from the export market, sharp fluctuation in Rs-US$ exchange rate is a cause of concernfor the Company. But, as significant portion of current raw material requirement is fulfilled through imports, it provides a naturalhedge. Besides the company follows prudent hedging policies to substantially mitigate the risk of forex volatility in respect of openexposure. As a risk mitigation strategy, the company enters into back to back raw material supply agreements on receipt of sales orderto eliminate the impact of steel price volatility.Entry of new overseas players.The new players may impact the competitive advantage of the Indian pipe manufacturers and reduce their chances of clinching exportorders, the global markets for line pipes is sizeable enough to accommodate competition. Foreign pipe manufacturers setting up localoperations in India would also need to go through the mandatory accreditation procedures and obtain customer's approvals. Theaccreditations and approvals are likely to take around 2-3 years.Volatile raw material pricesSteel is the primary raw material used in the production of pipes. We are exposed to volatility in the price of steel, which represents thelargest component of the cost of our products. Steel prices are highly volatile and cyclical in nature. Numerous factors drive the cyclesof the steel industry and influence steel prices. Some of these factors include general economic conditions, worldwide productioncapacity, capacity-utilization rates, downturns in purchase by traditional bulk steel end users or their customers, a slowdown in basicmanufacturing industries, import duties and other trade restrictions and currency exchange rates.<strong>Welspun</strong>'s StrategyConsolidate our existing market shareWe intend to continue our focus on delivering quality products and services to our customers. We strive to obtain repeat orders fromour customers by continuing to satisfy them with consistent high-quality products and services. We currently have a significant shareof the production capacity of high-grade submerged and welded pipes in India and seek to gain a larger share of the domestic andglobal market. We believe our reputation for high quality products will enable us to grow our market share in the developing globalmarkets, and to attain a leadership position in each of our product segment. In February <strong>2009</strong>, as part of our long-standingcommitment to the North American market, which is one of our key markets, we commenced commercial production in our spiral pipeproduction facility in Little Rock, Arkansas. This facility has the capacity to produce up to approximately 350,000 MTPA of HSAW pipesand also has coating and double joining capabilities. By increasing our presence in North America and providing our customers there a'one stop purchase' facility, we will strengthen our relationship with the local customers in the US and thereby increase our marketshare. The plate cum coil mill adds to our ability to source raw material for delivery of all type of pipes.Leverage our approach and accreditations with international majorsOur technical qualifications are demonstrated by approvals from almost all the major oil and gas giants. Obtaining approvals typicallytakes 2-3 years and therefore the pre-qualification status provide us with a significant advantage over our global peers. This gives uscapability to handle projects expected to commence in the medium term and provides an edge to participate in such projects.The research and development initiatives on high grade pipes will further improve our ability to participate in the highest valuesegments of our markets. We seek to enhance its position as a leading pipe manufacturing company by:• further developing and improving its products for oil, gas and other applications with a special emphasis on LSAW and HSAW pipesand pipe coating;• providing quality support to all the existing and potential customers and offering the right solutions to them.Explore inorganic growth opportunities to increase market reachWe intend to seek opportunities across the product segments and geographies to supplement our comprehensive product portfolioand international footprint. To enhance our existing business, we intend to seek opportunities to acquire, or partner with other pipemanufacturing companies to access new markets or distribution zones that have growth potential. Pursuing selective acquisitions,partnerships, or alliances would improve our competitiveness, further broaden offerings and strengthen our market position globally.The company has taken steps to invest in Middle East pipe manufacturing facility having a capacity of 270 K MTPA for HSAW pipes.37
th15 <strong>Annual</strong> <strong>Report</strong> <strong>2009</strong>-<strong>10</strong>Further penetrate new marketsWe have received orders from new and growing markets such as Peru, Venezuela, Algeria, Middle East among others. We furtherintend to develop and maintain a continuing relationship with our existing customers and to further penetrate countries like NorthAfrica, Caribbean and Latin American regions.Growth through further integrationWe have forayed into the Infrastructure Sector and Pipe laying for oil, gas and water by way of investment in MSK Projects (India) Ltd.,through <strong>Welspun</strong> Infratech Ltd. a <strong>10</strong>0% subsidiary of the Company. This move will enable to capture the full value chain frommanufacturing of Plate & Coils to Line Pipes and Pipe laying as well.<strong>Welspun</strong> on the Path of Leadership through its:• SCALE LEADERSHIP : Scale of operations through large economical plants across the globe.• COST LEADERSHIP : Produce world class products at the least cost and maintain competitive edge.• TECHNOLOGY LEADERSHIP : Adopt and innovate cutting-edge technology to satisfy stringent requirements of customers.• QUALITY LEADERSHIP : Consistent focus on quality at all levels, be the best in satisfying customers.• PROCESS LEADERSHIP : Most efficient and effective processes to achieve the most optimal utilizations.• PEOPLE LEADERSHIP : BEST IN CLASS PEOPLE produce extraordinary results.• GLOBAL LEADERSHIP : Serve globally, act locally.OUTLOOKFrom a macro perspective, the environment has turned positive with oil prices around $80 per barrel. Investments in yester-years andin future upstream oil and gas shall continue the flow of downstream pipe demands. New markets for products with stringentspecifications, which a very few companies can offer besides <strong>Welspun</strong>.In plates business, the environment continues to pose challenges as shipping industry, one of the prime consumers of plates is still torecover. We have established our credibility as a high-end supplier to pipe manufacturers and the commercial segment supplies shallenable us to increase volume. Internal consumption of plates and coils shall increase going forward.INTERNAL CONTROL AND ADEQUACYManagement of the Company maintains its adequate internal control system, which is designed to provide reasonable assurance thatthe assets are safeguarded and transactions are rightly executed and recorded in accordance with management authorization andaccounting policies.All the records are adequately maintained for preparation of financial statements and other financial information. Apart from internalcontrols, our Company also audits the efficiency and security of its operations, its information technologies and data, in accordancewith the global standards. The Audit Committee met eight times in the financial year <strong>2009</strong>-<strong>10</strong> to review internal audit reports as well asthe internal control systems and financial disclosures.MATERIAL DEVELOPMENTS IN HUMAN RESOURCESThe Company's strategic intent is to grow at a fast pace as defined in DISHA 2012, which sets the direction and deliverables as well asthe means to achieve this growth.To achieve strategic goals and enable business success, the Company is investing in attracting, developing and retaining highest qualityof human capital. The intent is to build a high performance management culture, backed by world-class processes operating on a valueframework. The twin pillars of education and systems & processes will enable us to identify high performance & high potential peopleand build future leadership. Thus, the underlying philosophy behind the management of human capital at <strong>Welspun</strong> is to strengthen itsstrategic alignment with the business. An HR-ERP package WEL-CONNECT supported by an Oracle database is in place to manage all HRrelated activities.The key initiatives that are being driven are:• Leadership development journey for the key talent comprising of high performing members is being covered through anintegrated intervention ranging over a period of 12 - 15 months.••The intervention focuses on building a talent pool of competencies and strengths in the areas of technical, general andpeople management.<strong>Welspun</strong> has partnered with a reputed management and research institute to groom its key talent on general managementconcepts.• A combination of developmental assignments, classroom training, e-learning, coaching and participation in special project38
C rp Ltd• Succession Planning process has been initiated to review the successors in the pipeline, available for the top 3 levels of everybusiness.• Talent Development initiative is aimed at building a leadership pipeline that will make the leaders available for future.• A Balanced Scorecard based Performance Management System (PMS) is in place and operative.• The thrust of Learning & Development efforts has been for skill enhancement and capability building. A common trainingcurriculum has been designed under the Corporate University Framework, where around 30 different programs have beendesigned for employees. Technical training certification program has also been instituted.• <strong>Welspun</strong> employees are also given an opportunity to enroll themselves into the certification courses offered by All IndiaManagement Association (AIMA).• Other initiatives for employee engagement like reward and recognition programs (Excellence Awards), online libraries andemployee engagement framework for the corporate teams has been deployed.• The integration roadmap for the strategic acquisitions is another focus area for the Human Capital team.In order to build a strong middle management team over the next 5 years, the Company has decided to hire candidates from top B-Schools across the country.The Company is focused on making its people ambitious, aggressive, dynamic, flexible and resilient and with an entrepreneurial bent ofmind, the act as change agents is to catapult and fast forward on its growth trajectory.DISCUSSION OF FINANCIAL ANALYSISThe significant developments which had major impact on financial numbers were:• Sales volume of Pipes up by 17% and plate volumes (Internal +External) up by 151%. Resultant revenue growth is 28%.• Pipe plant at Little Rock (Arkansas, U.S.) is in full-swing.• Coil Mill has been commissioned.• Net Finance cost is higher due to lower interest income and comparatively lower interest capitalization.• Depreciation is higher in comparison to corresponding year on account of commissioning of Coil Mill and U.S plant.Given below are highlight of financial numbers and impact of above developments on financial performance of the Company.1. RevenueProduction in K MT (Pipes & Plates)Pipes CAGR (2006-20<strong>10</strong>): 21%900700500300<strong>10</strong>08146707175013773841932005-06 2006-07 2007-08 2008-09 <strong>2009</strong>-<strong>10</strong>PipesPlatesSales in K MT (Pipes & Plates)Pipes CAGR (2006-20<strong>10</strong>) : 22%900700500300<strong>10</strong>08166416955253713871542005-06 2006-07 2007-08 2008-09 <strong>2009</strong>-<strong>10</strong>PipesPlates39
th15 <strong>Annual</strong> <strong>Report</strong> <strong>2009</strong>-<strong>10</strong>• In <strong>FY</strong> 20<strong>10</strong>, on annualized basis, our Company achieved over 54% capacity utilization. The installed Capacity is 1.5 milliontons/annum, making our company one of the largest line pipe company in the World.• Production reached all time high of 814k tons, pipe CAGR of 21% over a period of 5 years. Plate production achieved was 384ktons.• Sales volume for pipes were 816k tons witnessing a growth of 17%, Plate division achieved an overall sale of 387 k, external salebeing 309k tons and internal sale being 78k tons.Consolidated Revenues ( Rs. in Million)CAGR (2006-20<strong>10</strong>) : 42%<strong>10</strong>0,00075,00057,39573,50350,00025,00018,29826,83439,94502005-06 2006-07 2007-08 2008-09 <strong>2009</strong>-<strong>10</strong>• Sales increased by 28% in <strong>FY</strong> <strong>10</strong> compared to the previous year with a CAGR of 42% over a period of 5 years on account of high pipevolume, plate volume and improved realization.2. Breakup of various cost items as a percentage of sales & services (“Net Sales”)Element of Cost<strong>FY</strong> <strong>2009</strong>-<strong>10</strong> <strong>FY</strong> 2008-09SalesCost of goods soldAmount(Rs Million)(%)Amount(Rs in Million)73,503 <strong>10</strong>0.0 57,395<strong>10</strong>0.047,484 64.6 40,033 69.7(%)Manufacturing & Other Expenses- Store & spares consumed- Coating & other Job charges- Power, fuel & water charges- Material handling charges- Freight expenses- Staff costOther expenses1,835 2.5 915 1.6173 0.2 2,417 4.21,682 2.3 1,332 2.31,356 1.8 1,963 3.41,317 1.8 1,898 3.32,779 3.8 1,322 2. 33,690 5.0 1,168 2. 0Total ExpensesEBITDA ( Operational)60,317 82.013,186 18.051,048 89.06,348 11.0Other IncomeFinance Cost (Net)Depreciation185 - 187 -2,071 2.8 1,766 3.12,061 2.8 1,433 2.5PBT (Profit before Tax)9,240 12.63,336 5.8Provision for TaxPAT (Profit after Tax)3,136 4.3 1,200 2.16,<strong>10</strong>4 8.3 2,135 3.740
C rp LtdCost of goods sold as a percentage to Net Sales has decreased from 69.7% to 64.6% mainly on account of efficient raw materialmanagement. Operational cost increased mainly due to rise in power and fuel charges, staff costs and other expenses. Coating andother job charges have come down due to lower job work volume. Power, Fuel and Water Charges increased mainly due to higherenergy requirement for enhanced plate mill operations and part of the energy needs were served by 43 MW Captive Power Plant.Stores and Spares cost increased on account of commissioning of pipe capacities in India, USA and higher level of Plate mill operations.Freight Charges were lower due to better negotiations with the shipping companies and also due to direct dispatches from US facility.Staff Cost is higher due to additional employees for US facility, plate mill and the effect of capitalization in the previous year.Net Finance Cost is higher due to lower interest income and effect of higher interest capitalization in the previous year.Depreciation charges also increased due to increase in fixed Assets with the capitalization of Coil Mill at Anjar, and full period effect ofcapitalization of HSAW mill at Anjar and US Spiral Mill.3. MarginsOperating Margins: The EBITDA margin showed a growth of <strong>10</strong>8% at Rs. 13,186 million compared to the previous year at Rs. 6,348million. Previous year was impacted by extraordinary items like forex provisioning of Rs. 1,256 million on asset/ liability mismatch,Inventory write-down of Rs. 385 mn and forex provisioning on ECB of Rs. 178 million. The current year benefited with the reversalof forex provisioning. The EBITDA Margin for <strong>FY</strong> <strong>10</strong> stands at 17.9% as compared to 11.0 % in <strong>FY</strong> 09.PAT Margins: Profit after tax shows a growth of 186% and stands at Rs. 6,<strong>10</strong>4 million as compared to the <strong>FY</strong> 09 at Rs. 2,135 million(excluding the extraordinary items). The PAT Margin for the <strong>FY</strong> <strong>10</strong> stands at 8.3% as compared to 3.7% in <strong>FY</strong> 09.Table: Balance Sheet (Consolidated)(Rs. in Million)Sources of Funds As at 31 March 20<strong>10</strong> As at 31 March <strong>2009</strong> ChangeShareholder’s FundsShare Capital1,022933 89Reserves27,989 14,664 13,325Total29,01115,597 13,414Foreign Currency Monetary ItemTranslation Difference A/cLoan Funds7675Secured LoansUnsecured LoansTotal 25,47626,538 (1,062)Deferred Tax Liabilities (Net)TotalApplication of Funds18,6546,8223,35257,91526,435<strong>10</strong>3 6,7192,488(7,781)86444,623 13,292Net Block & Capital Work inProgress38,33336,804 1,529InvestmentsForeign Currency Monetary ItemTranslation Difference A/c1,596 1,140 456355 (355)Current Assets, Loans andAdvancesIncome Accrued on InvestmentsInventoriesSundry DebtorsCash and Bank BalancesLoans and Advances13 113 (<strong>10</strong>0)20,32226,113(5,791)8,077 4,601 3,47617,0289,470 7,5586,031 5,552 47951,47145,849 (5,622)41
th15 <strong>Annual</strong> <strong>Report</strong> <strong>2009</strong>-<strong>10</strong>(Rs. in Million)Application of Funds As at 31 March 20<strong>10</strong> As at 31 March <strong>2009</strong> ChangeLess : Current Liabilities andProvisionsCurrent LiabilitiesProvisionsTotalNet Current Assets32,291 38,955 (6,664)1,219601 61833,5<strong>10</strong> 39,556 (6,046)17,961 6,293 11,66825 31 (6)57,915 44,623 13,292Note: Minority interest of Rs. 0.06 (0.40) million and preliminary expenses of Rs. 0.07 (0.08) million for the current year (previousyear) have not been taken in the above analysis.4. Return on Net WorthReturn on Net worth (RoNW) is 21% in the <strong>FY</strong> <strong>10</strong> as compared to 13.7% in the previous year. Investments made in the Plate & Coilmill and the US project have contributed positively during the year.5. Surplus FundsTemporary surplus are invested in mutual funds and government securities. Nevertheless, in order to achieve higher growth andvalue creation for the stakeholders, our company wish to deploy funds, for debottlenecking & up-gradations, capacityenhancement by way of organic and in-organic initiatives and stronger focus on upstream Oil and Gas businesses. In future, ourCompany also wish to enhance the dividend payout rates and retire high cost debt to improve overall profitability.6. Capital DeploymentDuring the year the capital deployment increased from Rs. 44,623 million to Rs. 57,915 million mainly due to capitalization ofCoiler Mill, capital expenditure on LSAW plant & HSAW Plant and surplus cash and cash equivalents pending utilization.Management is confident that increase in size as well as range of activities would economize operations and achieve competitiveadvantage in the ever increasing competitive market.7. Networth / Book valueThe Networth of our Company stands at Rs. 29,011 million as at 31st March 20<strong>10</strong>. The Net Worth has increased by Rs. 13,414million mainly on account of current year's profit of Rs. 5,627 million (net of dividend/dividend tax), QIP issue of Rs. 4,662 million,Positive movement of Rs 1,972 million in hedge reserve account and Foreign Currency Translation reserve of Rs. 969 million.The Book Value of equity shares stands at Rs 142 per equity share as at 31st March 20<strong>10</strong>. The details of movement in various headsof net worth are as under:a. Share CapitalDuring the year, issued and paid up equity share capital (no. of shares) increased from 186,491,192 to 204,322,4<strong>10</strong> equityshares (of Face Value of Rs. 5 each) as at 31st March 20<strong>10</strong>, on account of:• 16,694,718 Equity Shares issued to Qualified Institutional Buyers (Rs. 83.5 million)• 1,136,500 Equity shares due to exercise of option under ESOP Plans. (Rs. 5.7 million)b. Reserves and Surplusi) Capital Reserve: The balance as of 31st March 20<strong>10</strong> amounted to Rs. 1,057 million which is the same as in the previousfinancial year .ii)Securities Premium account: The addition to the Securities Premium account of Rs. 4,620 million during the year wasmainly on account of “Qualified Institutional Placement” (QIP) issue and ESOPs.iii) Debenture Redemption Reserve: Debenture Redemption Reserve has increased by Rs. <strong>10</strong>6 million during the year andstands at Rs. 643.75 million at the end of the year to provide for redemption of Secured Non Convertible Debentures ofRs.3,000 million issued during the year <strong>FY</strong> 08.iv)Hedging Reserve Account and Foreign Currency Translation Reserve: Positive movement of Rs 1,972 million in Hedge42
C rp Ltdreserve account and Foreign Currency Translation reserve of Rs. 969 million due to appreciation of rupee against dollarfrom Rs. 50.7 (31 March <strong>2009</strong>) to Rs. 44.9 (31 March 20<strong>10</strong>).v) General Reserve: General Reserve has increased by Rs. 540 million during the year and stands at Rs. 1,267 million at theend of the year.vi)Profit and Loss account: The balance retained in the Profit and Loss Account as on 31st March 20<strong>10</strong> has increased by Rs.4,981 million to Rs. 11,470 million after providing for an equity dividend of 40%.8. Loan fundsThe Gross debts stands at Rs. 25,476 million, which has come down by Rs. 1,062 million over the previous year. Major movementsduring the year includes:• Repayment of high cost term Loans of Rs. 8,137 million.• ECB has come down by Rs. 834 million due to realignment gain.• Raised unsecured loan of Rs. 6,735 million by way of Foreign Currency Convertible Bonds.• Working Capital Loans has increased by Rs. 405 million.• Loans for Joint Ventures has gone up by Rs. 867 million.The Net debts stands at Rs. 8,448 million as at 31st March 20<strong>10</strong> after reducing the cash of Rs. 17,028 million. Net debt to Networthis 0.29 indicating the strong financial position of the balance sheet.9. Fixed AssetsGross Block of Fixed Assets increased by Rs. 3,966 million to Rs. 38,8<strong>10</strong> million in <strong>FY</strong> <strong>10</strong>. This was mainly due to capitalization of CoilMill and Pipe mill. Capital Work in progress of Rs. 5,412 million largely reflects LSAW and HSAW Plant under construction.<strong>10</strong>. InventoryInventory decreased by Rs. 5,791 million to Rs. 20,322 million, despite increase in scale of operations, reflecting lower steel pricesas compared to the previous year and better inventory management. As a result, the inventory turnover days decreased from166 days of Net Sales to <strong>10</strong>1 days of Net Sales.11. DebtorsSundry Debtors increased from Rs.4,601 million to Rs. 8,077 million in the <strong>FY</strong> <strong>10</strong>. Sundry Debtors have increased to 40 days (29days in <strong>FY</strong> 09) of Net Sales during the year.12. Cash and Bank BalancesCash and Bank balances as at 31st March 20<strong>10</strong> increased to Rs.17,028 million as against Rs.9,470 million as at 31st March <strong>2009</strong>.The funds are in fixed deposits and in margin money/ current account, which facilitates effective working capital management.13. Loans and AdvancesThe loans and advances increased from Rs 5,552 million as at 31st March <strong>2009</strong> to Rs. 6,031 million as at 31st March 20<strong>10</strong> due tohigher level of business activity.14. Current LiabilitiesThe current liabilities have decreased by Rs.6,664 million to Rs. 32,291 million in <strong>FY</strong> 20<strong>10</strong>, which is mainly due to reduction in theacceptances during the year.43
th15 <strong>Annual</strong> <strong>Report</strong> <strong>2009</strong>-<strong>10</strong>Note on foreign currency hedgingPolicy: The Company has major part of its revenues and expenses in foreign currency, which provides natural hedge. The value additionis hedged through forward sale of dollars with vanila products.The long term liabilities in foreign currency are kept unhedged as theCompany is net foreign exchange earner. At any point of time the Company manages the net forex position to almost at the nil level.For the stand alone results, the Note No. 7 In this annual report on page No. 71 deals with "Disclosure of Derivative Instruments andUnhedged Foreign Currency Exposure" and the table for the current year is repoduced and explained below with the help ofsuperscripts for each numerical item.The Outstanding foreign currency derivative contracts as on 31 March, 20<strong>10</strong> in respect of hedging are as follows:a)ParticularsIn respect of Short term receivables and payablesi) In respect of Debtorsii)a) Existing as on the Balance sheet dateb) In respect of future forecasted transactionsIn respect of Creditorsa) Existing as on the Balance sheet dateb) In respect of future forecasted transactionsAmount Hedged Amount Unhedged *5,975.39 (2)3,344.69 (4)5,544.95 (5)31 March, 20<strong>10</strong>(Rs. in Million)(1)1,389.47(3)6,542.76b)In respect of Short term receivables and payables existing as on the balance sheet datei) Other short term assets or receivables-(6)6,324.36ii)Other short term liabilities or payables-(7)778.25c)In respect of Long term receivables and payables existing as on the balance sheet datei) In respect of Foreign Currency Loan receivable--ii)In respect of Foreign Currency Loan payable437.62 (8)(9)13,524.99d) Other derivative Hedge instruments4,245.00 (<strong>10</strong>)Note :The Net un-hedged short term receivable as on 31 March, 20<strong>10</strong> is Rs. 392.82 million resulting natural hedge against foreign exchangerates fluctuations.Explanation for a) in respect of Short term receivables and payablesThe above table is reproduced in the form of overall receivables and payables position and provides the net position as on 31 March,20<strong>10</strong>,with regard to foreign currency exposure and the net unhedged position.Particularsi) In respect of Trade receivables and payablesExisting as on the Balance sheet dateIn respect of future forecasted transactions based on orders in handTotal Tradeii) HedgesExisting as on the Balance sheet dateIn respect of future forecasted transactionsTotal HedgeNet unhedged Trade(Rs. in Million)31 March, 20<strong>10</strong>Receivables Payables Difference1,389.47 (1) 6,542.76 (3)27,765.07 25,992.0029,154.54 32,534.76 (3380.22)3,344.69 (4)5,975.39 (2) 5,544.95 (5)5,975.39 8,889.64 (2914.25)23,179.15 23,645.12 (465.97)Conclusion: The difference between receivables and payables after including future forcasted numbers based on orders in hand andhedges in place the net unhedged position is closer to nil level,as the Company enjoys the natural hedge.44
C rp LtdExplanation for b) in respect of Short term receivables and payables existing as on balance sheet date6.Other short term assets or receivables includes Rs. 5,493.66 million as short term fixed deposits and foreign currency account andRs. 830.70 million advance payment to vendors.7.Rs. 778.25 million is towards advance received from buyers for future shipments.Explanation for c) in respect of Long term receivables and payables existing as on balance sheet date8.Rs. 437.62 million relates to foreign currency loan payable to the bank.9.Rs. 135,24.99 : relates to foreign currency loan payable.- Rs. 6,735.00 million represents foreign currency convertible bonds.- Rs. 6,789.99 million represents external commercial borrowing.Explanation for d) in respect of other derivative Hedge instruments<strong>10</strong>.Other hedge instruments:• Interest Rate Swap: US $ 50 million swap floating to fixed (2.29%) for ECB loan for partially mitigating interest rate volatility.• Cross Currency Swap: Equivalent US $ 40.80 million conversion of long term rupee loan into foreign currency loan on notionalprincipal basis. This results into conversion of high cost rupee loan into cost effective LIBOR based foreign currency loan.Cautionary StatementSome of the statements in this Management Discussions and Analysis, describing the projections, estimates and expectations may be forward lookingstatements within the meaning of the applicable laws and regulations. Actual results may differ substantially from those expressed or implied.Important developments that could affect <strong>Welspun</strong>'s operations include a shift in the industry structure, significant changes in political and economicenvironment in India and globally, tax laws, import duties, litigations and labour relations.45
th15 <strong>Annual</strong> <strong>Report</strong> <strong>2009</strong>-<strong>10</strong>CHANGE DOES NOT CHANGE TRADITIONS ...
...IT STRENGTHENS ITCHANGE DOES NOT CHANGE TRADITIONS; ITSTRENGTHENS ITEach and every <strong>Welspun</strong>ite has a strong tradition of socialengagement. It is ingrained in our DNA. Over the years,<strong>Welspun</strong> Vidya Mandir School (Up to Standard XII) at Anjar,has provided a ray of light through education, to not onlythe children of <strong>Welspun</strong> employees, but also children fromnearby villages. Similarly, our Balwadi's (Pre-primaryschools) at <strong>Welspun</strong> colonies have been providing tiny totswith basic education for their overall development.
th15 <strong>Annual</strong> <strong>Report</strong> <strong>2009</strong>-<strong>10</strong>Corporate Social Responsibility<strong>Welspun</strong>, a large diversified conglomerate, believes that any organization is an extension of society and it does not function in isolation.Contributing to the economic development of the country through ethical business practices is a focused area. Carrying out itsoperations in diverse business verticals, <strong>Welspun</strong> Group has multi-faceted responsibilities towards its customers, employees and thecommunities at large.Our vision is to light up the world by making a difference. Moving towards transformation, we have identified that sustainablecommunity development is the very basis of empowerment. The three guiding paths for this transformation are:1. Education 2. Empowerment 3. EnvironmentInitiatives in EducationAdult EducationEducation is not a bastion for children alone, but for each individual who wants to grab an opportunity to transform his/her life.The results of a survey conducted at <strong>Welspun</strong> Grams in Anjar indicated that approximately eighty percent of the worker's wiveswere illiterate. In response to this, an Adult Education program was launched in association with the Jan Shikshan Sansthan. Theteachers were trained by the faculty at <strong>Welspun</strong> Vidya Mandir. With our CSR personnel's continued efforts, the attendance hasrisen to twenty regular participants.AnganwadiKnowledge enables us to recognize new opportunities towards a better life. The women who have enrolled in the program aremore committed towards sending their children to the <strong>Welspun</strong> Anganwadi and then to regular schools for formal education.<strong>Welspun</strong>'s Anganwadi, which was launched last year has seen a remarkable increase in the number of students. Anotherremarkable feature is that these children have enrolled themselves into school for formal education. <strong>Welspun</strong> Vidya Mandir is thefirst CBSE accredited school in the region.Employee EngagementEvery employee has a role in modeling CSR as a part of the culture within the <strong>Welspun</strong> Group. Employees are encouraged toparticipate in a mentor-mentee program involving children from slums through an NGO partnership with Akanksha.Initiatives in EmpowermentVocational TrainingEmpowering women is at the core of <strong>Welspun</strong>'s CSR efforts. Nari Shakti was launched to achieve this objective. Under this banner,vocational training has been provided to the residents of the Weslpun Grams. Training has been imparted for candle-making,stitching & cutting. Women, although hesitant in enrolling for the program, are now more keen on attending classes and taking allthe necessary steps towards becoming economically independent. Vocational training through self help groups has also beenoffered to them.MonetizationExhibitions were organized for showcasing and selling the handicraft products made by the women attending the vocationaltraining sessions. The women have also received orders from <strong>Welspun</strong> India Ltd, supporting them in marketing and retailing theirproducts.Initiatives in EnvironmentMedical SupportMedical Centres in <strong>Welspun</strong> Grams, Anjar have been established to provide basic medical care to the residents. We have tied upwith medical institutes to provide health care and medical treatment in areas where such facilities are rare. Funding for treatmentof ailments is another avenue and numerous employees have benefited through this program. Free medical check-ups forworkers and family have also been organized in Bharuch. A blood donation camp in association with Red Cross Blood Bank wasorganized in Bharuch with one hundred and fifteen employees participating.48
C rp LtdHealth Awareness WorkshopsProactive steps have been taken to provide medical knowledge and facilities to the residents and communities situated near ourmanufacturing facilities in Anjar. A tie up with Matrusparsh Hospital has ensured that a Gynaecologist and a Pediatrician visit the<strong>Welspun</strong> Grams every Saturday. Workshops for women conducted on vector - borne diseases, in <strong>Welspun</strong> Grams, Anjar hasresulted in a drastic decrease of any further outbreaks. Numerous Sanitation and health-awareness Camps with focus on Asthma,Mother & Child, Clean water Camps and Family Planning have been organized.Carbon Emission ReductionWe believe in caring for our environment. We take proactive actions towards being environment friendly. In order to decreasecarbon footprints, one of the practices we follow is converting carbon emissions into dry ice and liquid carbon dioxide. Studieshave shown a net reduction of carbon dioxide emission of 35,131 metric tons every year.AfforestationThe once barren and acrid desert land of Anjar has been covered with lush green plantations. It now boasts of approximately<strong>10</strong>0,000 plants. The residents of <strong>Welspun</strong> Grams have actively participated in planting of saplings. The women ensure that theirchildren offer protection and care to the plants.Invigorating the SpiritThe 39th National Safety Week was celebrated at <strong>Welspun</strong> India Facility, emphasizing safety in everyday work life. Competitions like “Spot the Hazard,” Safety Quiz etc were organized. A safetyawareness program and fire fighting demonstration were held in the <strong>Welspun</strong> Gramfor the families of the employees.Celebrating Events & FestivalsA plethora of festival celebrations have been organized at ourfacilities for both employees and their families. On theoccasion of Janmashtmi, chocolates weredistributed to the Balwadichildren. On a periodic basis,competitions for childrenand women are organizedby the Ladies club tobuild the <strong>Welspun</strong>family spirit.G R I S u s t a i n a b i l i t yworkshops have beenconducted on a periodicbasis for the CorporateSocial Responsibilitystaff in Anjar.049
th15 <strong>Annual</strong> <strong>Report</strong> <strong>2009</strong>-<strong>10</strong>Growth at InfinityRevenue : Rs. 73,503 mn.........................................................................................................................Revenue : Rs. 57,395 mn.Revenue : Rs. 39,945 mn.................................................................................................................................................................................................................................................Revenue : Rs. 26,834 mn.........................................................................................................................Revenue : Rs. 18,298 mn.Revenue : Rs. <strong>10</strong>,385 mn.................................................................................................................................................................................................................................................Revenue : Rs. 8,277 mn............................................................................................................................Revenue : Rs. 2,565 mn............................................................................................................................Revenue : Rs. 585 mn...............................................................................................................................Revenue : Rs. 180 mn................................................................................................................................Incorporated1995Embarked on a Growth Journey..........................................................................................Financials SectionStandalone AccountsAudit <strong>Report</strong>-Standalone Accounts 52Standalone Balance Sheet and Profit & Loss Account 56 - 57Standalone Notes to Accounts 66Standalone Cashflow Statement 82Balance Sheet Abstract & General Business Profile 83Section 212 disclosure 84
C rp LtdGrowth.................................................................................20<strong>10</strong>Foray into infra & pipe laying for O&G and water through MSK Projects India Ltd.Investment in Middle East with HSAW capacity of 270,000 MT550,000 MT pipe capacity addition under implementation in India......................................................................................................................................................................................................................................................<strong>2009</strong>20082007350,000 MT US Spiral Mill commissioned150,000 MT Spiral Mill commissionedCommissioning of Plate Mill & 43 MW Power PlantAnjar Facility, A Key Contributor..............................................................................2006Approvals from O&G majors for new facility.........................................................................2005New Capacity at Anjar, Gujarat for HSAW & Coating.................................................................2004Merger of coating J.V. with WGSRL.....................................................2001Pipe Coating in JV with EUPEC of Germany at Dahej, Gujarat.................................2000LSAW, Dahej, Gujarat.........1998HSAW, Dahej, GujaratEMBARKED ON A GROWTH JOURNEY - GROWTH AT INFINITYThe figures say it all. From a US$ 2 million Company in 1996 to a US$ 1.7 billion conglomerate in<strong>FY</strong> 09-<strong>10</strong>, the company has embarked upon a fast paced growth journey to be the mostrespected company in the world.Consolidated AccountsAudit <strong>Report</strong>-Consolidated Accounts 85Consolidated Balance Sheet and Profit & Loss Account 86 - 87Consolidated Notes to Accounts 94Consolidated Cashflow Statement <strong>10</strong>5Section 212 (8) disclosure <strong>10</strong>7
th15 <strong>Annual</strong> <strong>Report</strong> <strong>2009</strong>-<strong>10</strong>Auditors' <strong>Report</strong>To the Members of <strong>Welspun</strong> Corp Limited (Formerly <strong>Welspun</strong> Gujarat Stahl Rohren Limited)1. We have audited the attached Balance Sheet of <strong>Welspun</strong> Corp Limited (Formerly <strong>Welspun</strong> Gujarat Stahl Rohren Limited) (“theCompany”) as at 31 March 20<strong>10</strong>, and also the Profit and Loss account and the Cash Flow Statement for the year ended on thatdate, annexed thereto. These financial statements are the responsibility of the Company's management. Our responsibility is toexpress an opinion on these financial statements based on our audit.2. We conducted our audit in accordance with the auditing standards generally accepted in India. Those standards require that weplan and perform the audit to obtain reasonable assurance about whether the financial statements are free from materialmisstatement. An audit includes examining, on a test basis, evidence supporting the amounts and disclosures in the financialstatements. An audit also includes assessing the accounting principles used and significant estimates made by management, aswell as evaluating the overall financial statement presentation. We believe that our audit provides a reasonable basis for ouropinion.3. As required by the Companies (Auditors' <strong>Report</strong>) Order, 2003 issued by the Central Government of India in terms of Section227(4A) of the Companies Act, 1956 (“the Act”), and on the basis of such checks as we considered appropriate and according tothe information and explanations given to us, we annex hereto a statement on the matters specified in paragraph 4 and 5 of thesaid order.4. Further to our comments in the Annexure referred to in Paragraph (3) above, we report that:(a)(b)(c)(d)(e)(f)We have obtained all the information and explanations, which to the best of our knowledge and belief were necessary for thepurposes of our audit;In our opinion, proper books of account as required by law have been kept by the Company, so far as appears from ourexamination of those books;The Balance Sheet, the Profit and Loss account and the Cash Flow statement dealt with by this report are in agreement withthe books of account;In our opinion, the Balance Sheet, the Profit and Loss account and the Cash Flow statement dealt with by this report complywith the accounting standards referred to in Section 211 (3C) of the Act;On the basis of written representations received from the Directors and taken on record by the Board, we report that none ofthe directors is disqualified as at 31 March 20<strong>10</strong> from being appointed as a director in terms of clause (g) of sub-section (1) ofSection 274 of the Act;In our opinion and to the best of our information and according to the explanations given to us, the said accounts read withthe significant accounting policies and notes to accounts as per Schedule 18, give the information required by the Act in themanner so required and give a true and fair view in conformity with the accounting principles generally accepted in India:i) In the case of the Balance Sheet, of the state of affairs of the Company as at 31 March 20<strong>10</strong>;ii)iii)In the case of the Profit and Loss account, of the Profit for the year ended on that date; andIn the case of the Cash Flow statement, of the cash flows for the year ended on that date.For MGB & Co.Chartered AccountantsFirm Registration No.: <strong>10</strong>1169WMohan BhandariPartnerMembership No. 12912Mumbai, 27 April 20<strong>10</strong>52
C rp LtdAnnexure referred to in paragraph 3 of Auditors' <strong>Report</strong> to the members of <strong>Welspun</strong> Corp Limited (Formerly <strong>Welspun</strong> Gujarat StahlRohren Limited) on the accounts for the year ended 31 March 20<strong>10</strong>(i) (a) The Company has maintained proper records showing full particulars including quantitative details and situation of its fixedassets.(b)(c)According to the information and explanations given to us, the fixed assets have been physically verified by the managementin a phased program periodical manner at reasonable intervals, which in our opinion is reasonable having regard to the size ofthe Company and the nature of its assets. No material discrepancies were noticed on such verification.In our opinion, the Company has not disposed off a substantial part of its fixed assets during the year and the going concernstatus of the Company is not affected.(ii) (a) The inventories have been physically verified by the management during the year except stock lying with third parties inrespect of which confirmations have been obtained. In our opinion, the frequency of verification is reasonable.(b)(c)In our opinion, the procedures of physical verification of inventories followed by the management are reasonable andadequate in relation to the size of the Company and the nature of its business.As explained to us, the Company has maintained proper records of inventories and no material discrepancies were noticed onphysical verification of inventories as compared to the book records.(iii) (a)(b)According to the information and explanations given to us, the Company has not granted any loans, secured or unsecured tocompanies, firms or other parties covered in the register maintained under Section 301 of the Act.According to the information and explanations given to us, the Company has not taken any loans, secured or unsecured fromcompanies, firms or other parties covered in the register maintained under Section 301 of the Act.(iv) In our opinion and according to the information and explanations given to us, there is an adequate internal control systemcommensurate with the size of the company and the nature of its business with regard to purchase of inventory, fixed assets andfor sale of goods and services. During the course of our audit, we have not observed any major weaknesses in the internal controlsystem.(v)According to the information and explanations given to us, there are no contracts or arrangements the particulars of which arerequired to be entered into the register in pursuance of Section 301 of the Act.(vi) In our opinion and according to the information and explanations given to us, the Company has not accepted any deposits fromthe public during the year with in the meaning of section 58A and 58AA of the Act and the rules framed there under.(vii) In our opinion, the Company has an internal audit system commensurate with its size and nature of its business.(viii) On the basis of records produced, we are of the opinion that prima facie cost accounting records prescribed by the CentralGovernment under section 209 (1) (d) of the Act, in respect of products of the Company, have been maintained. However, we areneither required to carry out nor have carried out any detailed examination of such accounting records.(ix) (a)(b)According to the records of the Company, the undisputed statutory dues, including Provident Fund, Investor Education andProtection Fund, Employees State Insurance, Income Tax, Value Added Tax, Wealth Tax, Service Tax, Custom Duty, Excise Duty,Cess and any other material statutory dues to the extent applicable have been deposited regularly with the appropriateauthorities except for delays in few cases. There is no undisputed amounts payable in respect of the aforesaid duesoutstanding as at 31 March 20<strong>10</strong> for a period of more than six months from the date of becoming payable.There are no disputed dues on account of Wealth Tax, Income Tax, Custom Duty, and Cess. Dues on account of the disputedSales Tax/VAT, Service Tax and Excise Duty which have not been deposited are as under:Name of the Statute(Nature of dues)Sales Tax(VAT)Amount(Rs. in million)Period to which theamount relates2.12 2000-2001 to 2002- 2003 Sales Tax Tribunal3.61 2001-2002 and2005-2006Forum where dispute is pendingJoint Commissioner of Sales Tax(Appeals)53
th15 <strong>Annual</strong> <strong>Report</strong> <strong>2009</strong>-<strong>10</strong>Name of the Statute(Nature of dues)Sales Tax (VAT)The Central Excise Act,1944- Excise DutyAmount(Rs. in million)Period to which theamount relates214.59 <strong>2009</strong>-20<strong>10</strong> Assessment StageForum where dispute is pending0.09 2003-2004 Commissioner of Central Excise andCustoms0.08 2007-2008 Assistant Commissioner of Central Exciseand Customs- Service Tax31.20 2004-2005 and2005-2006Custom Excise and Service Tax AppellateTribunal (CESTAT)7.82 2005-2006 and2006-2007Custom Excise and Service Tax AppellateTribunal (CESTAT)45.90 2006-2007 to2008-<strong>2009</strong>26.13 2005-2006 to2008-<strong>2009</strong>0.31 2007-2008 to<strong>2009</strong>-20<strong>10</strong>Commissioner of Central Excise andCustomsCommissioner / AdditionalCommissioner of Central Excise andCustomsDeputy Commissioner of Central Exciseand Customs(x)The Company does not have any accumulated losses at the end of the financial year and has not incurred cash losses during thefinancial year covered by our audit and in the immediately preceding financial year.(xi) According to the information and explanations given to us, the Company has not defaulted in repayment of dues to financialinstitutions, banks and debenture holders.(xii) The Company has not granted any loans and advances on the basis of security by way of pledge of shares, debentures and othersecurities.(xiii) The Company is not a chit fund or a nidhi / mutual benefit fund / society.(xiv) The Company is not dealing or trading in securities, debentures and other investments.(xv) In our opinion and according to the information and explanations given to us, the terms and conditions on which the Company hasgiven guarantee for loans taken by subsidiaries and others from banks and financial institutions are prima facie not prejudicial tothe interest of the Company.(xvi) According to the information and explanations given to us and records of the Company examined by us, the Company has notraised any term loan during the year.(xvii) According to the information and explanations given to us and on an overall examination of the Balance Sheet of theCompany and related information as made available to us, we are of the opinion that there are no funds raised on short termbasis which have been used for long term investments.(xviii) During the year, the Company has made preferential allotment of shares under the ESOP scheme to the parties covered in theregister maintained under section 301 of the Companies Act, 1956. The price at which these shares were issued is not primafacieprejudicial to the interest of the Company.54
C rp Ltd(xix) The Company has created adequate security in respect of debentures issued.(xx) The Company has not raised any money by way of public issue during the year. Funds raised on issue of Foreign CurrencyConvertible Bonds (FCCB) have been utilised for the purpose for which they were raised except pending utilization have beeninvested in short term deposits with Banks as referred in Note 1(c).(xxi) Based on our audit procedures performed and according to the information and explanations given to us, no material fraud on orby the Company has been noticed or reported during the year of our audit.For MGB & Co.Chartered AccountantsFirm Registration No.: <strong>10</strong>1169WMohan BhandariPartnerMembership No. 12912Mumbai, 27 April 20<strong>10</strong>55
th15 <strong>Annual</strong> <strong>Report</strong> <strong>2009</strong>-<strong>10</strong>Balance Sheet as at 31 March 20<strong>10</strong>ParticularsSchedulesSources of FundsShareholders' Funds(Rs. in Million)As atAs at31-Mar-<strong>10</strong> 31-Mar-09Share Capital 1 1,021.61932.46Reserves and Surplus 2 26,366.00 14,865.5327,387.61 15,797.99Loan FundsSecured Loans 3 12,971.12 21,634.02Unsecured Loans 4 6,818.4619,789.58<strong>10</strong>3.4121,737.43Foreign Currency Monetary Item Translation Difference Account (Refer Note 6(b))75.42-Deferred Tax Liabilities (Net) (Refer Note 14(b)) 2,954.682,487.63Total 50,207.29 40,023.05Application of FundsFixed AssetsGross Block 5 29,691.95 26,528.82Less:Depreciation/Amortisation 5,057.643,618.48Net Block 24,634.31 22,9<strong>10</strong>.34Capital Work-In-Progress (Refer Note 12 (iv)) 4,011.1728,645.483,803.1526,713.49Investments 6 2,796.141,718.37Foreign Currency Monetary Item Translation Difference Account (Refer Note 6(b)) -354.98Current Assets, Loans and AdvancesInterest Accrued on Investments 13.4125.19Inventories 7 13,042.92 23,236.41Sundry Debtors 8 8,040.875,838.55Cash and Bank Balances 9 9,212.409,193.71Loans and Advances <strong>10</strong> 6,194.1536,503.7511,149.8149,443.67Less : Current Liabilities and ProvisionsCurrent Liabilities 11 16,603.28 37,607.18Provisions 12 1,134.8017,738.08600.2838,207.46Net Current Assets 18,765.67 11,236.21Total 50,207.29 40,023.05Significant Accounting Policies and Notes to Accounts 18As per our attached report of even dateFor and on behalf of the BoardFor MGB & Co.Chartered AccountantsB.K.GoenkaChairman and Managing DirectorM.L.MittalExecutive Director-FinanceMohan BhandariPartnerMumbai, 27 April 20<strong>10</strong>B.R.JajuChief Financial OfficerPradeep JoshiCompany Secretary56
C rp LtdProfit And Loss Account for the year ended 31 March, 20<strong>10</strong>Particulars(Rs. in Million)Schedules Year ended Year ended31-Mar-<strong>10</strong> 31-Mar-09IncomeSales and Services (Gross)Less: Excise DutySales and Services (Net)Other IncomeExpenditureCost of GoodsManufacturing and Other ExpensesFinance Expenses (Net)Depreciation/Amortisation13 68,924.32 61,096.822,784.97 2,313.6866,139.35 58,783.1414 127.74 178.79Total 66,267.09 58,961.9315 44,928.46 42,113.9216 <strong>10</strong>,112.49 <strong>10</strong>,322.7817 1,661.70 1,734.961,479.20 1,254.19Total 58,181.85 55,425.85Profit Before TaxProvision For Taxation- Current Tax- Deferred Tax-Fringe Benefit TaxProfit After Tax8,085.24 3,536.082,216.23 439.47467.05-749.7511.185,401.96 2,335.68Balance Brought Forward6,795.96 5,305.60Profit Available for AppropriationAppropriations:General ReserveDebenture Redemption ReserveProposed Dividend on Equity SharesTax on above DividendDividend on Equity Shares for earlier periodTax on DividendBalance carried to Balance Sheet12,197.92 7,641.28540.00 234.00<strong>10</strong>6.25 268.75408.64 279.7467.87 47.540.22 13.060.04 2.2211,074.89 6,795.96Earnings Per Share (Face Value Rs. 5 each) (Refer Note 19)- Basic- Diluted28.04 12.5925.18 12.50Weighted average no. of Shares used in computingEarnings Per Share - Basic- Diluted192,638,617 185,569,595218,019,604 186,864,123Significant Accounting Policies and Notes to Accounts 18As per our attached report of even dateFor and on behalf of the BoardFor MGB & Co.Chartered AccountantsB.K.GoenkaChairman and Managing DirectorM.L.MittalExecutive Director-FinanceMohan BhandariPartnerMumbai, 27 April 20<strong>10</strong>B.R.JajuChief Financial OfficerPradeep JoshiCompany Secretary57
th15 <strong>Annual</strong> <strong>Report</strong> <strong>2009</strong>-<strong>10</strong>Schedules forming part of AccountsParticularsAs at31-Mar-<strong>10</strong>(Rs. in Million)As at31-Mar-09Schedule - 1 Share CapitalAuthorised304,000,000 (304,000,000) Equity Shares of Rs. 5 each98,000,000 (98,000,000) Preference Shares of Rs. <strong>10</strong> each1,520.00980.001,520.00980.002,500.002,500.00Issued, Subscribed and Paid Up (Refer Note 2 and 3 )204, 322,4<strong>10</strong> (186,491,192) Equity Shares of Rs. 5 each fully paid up1,021.61932.46Total1,021.61932.46(Of the above 8,120,000 Equity Shares Rs. 5 each fully paid up are allotted forconsideration other than cash, pursuant to the Scheme of Arrangement in the year 2004-05.)Schedule - 2 Reserves and SurplusCapital ReserveAs per last Balance Sheet1,057.261,057.26Securities PremiumAs per last Balance SheetAdd/(Less): Received during the yearDiscount on issue of shares under Employee Stock Options Scheme (Refer Note 3)Premium payable on redemption of Foreign Currency Convertible Bonds (Refer Note 1(b))Utilised towards share issue expenses (Refer Note 2(b))7,7<strong>10</strong>.724,663.7630.40(15.62)(58.28)12,330.996,860.93848.141.65--7,7<strong>10</strong>.72Debenture Redemption ReserveAs per last Balance SheetAdd: Appropriated during the year537.50<strong>10</strong>6.25643.75268.75268.75537.50Employee Stock Options OutstandingLess : Deferred employee compensation25.0660.03(0.70) (18.35)24.3641.68Hedging Reserve Account (Refer Note 6(c))(31.86) (2,004.20)General ReserveAs per last Balance SheetAdd: Appropriated during the yearLess: Transferred to Fixed AssetsProfit and Loss Account726.61540.00-1,266.6111,074.89501.96234.00(9.35)726.616,795.96Total26,366.0014,865.5358
Schedules forming part of AccountsParticularsAs at31-Mar-<strong>10</strong>C rp Ltd(Rs. in Million)As at31-Mar-09Schedule - 3 Secured Loans (Refer Note 4)DebenturesSecured Redeemable Non Convertible DebenturesTerm Loan from BanksIn Foreign CurrencyIn Rupee3,000.00 3,000.00398.76 68.472,782.37 <strong>10</strong>,537.853,181.13 <strong>10</strong>,606.32External Commercial BorrowingsWorking Capital From BanksIn Foreign CurrencyIn Rupee6,789.99 7,623.87--303.83<strong>10</strong>0.00-403.83Total 12,971.12 21,634.02Schedule - 4 Unsecured LoansForeign Currency Convertible Bonds (Refer Note 1)Deferred Sales Tax Loan(Repayable in six equal annual instalments from Financial Year <strong>2009</strong> / 2015)6,735.0083.46 <strong>10</strong>3.41-Total 6,818.46 <strong>10</strong>3.41Schedule - 5 Fixed Assets - (at cost)Gross BlockDepreciation/AmortisationNet BlockParticulars As at Additions Deductions As atUpto For the Deductions Upto As at As at01.04.<strong>2009</strong> 31.03.20<strong>10</strong> 31.03.<strong>2009</strong> year31.03.20<strong>10</strong> 31.03.20<strong>10</strong> 31.03.<strong>2009</strong>a) Tangible AssetsLand 128.43 1.95 0.76 129.63- - - - 129.63 128.43Buildings 3,631.37 114.01 - 3,745.38298.56 <strong>10</strong>1.04 - 399.61 3,345.77 3,332.80Plant and Machinery 22,268.27 3,329.14 381.57 25,215.83 3,205.70 1,302.88 34.68 4,473.90 20,741.93 19,062.57Office and Other Equipments 161.46 58.58 4.30 215.7566.99 19.96 3.17 83.78 131.9794.48Vehicles 42.42 9.27 0.80 50.8912.52 4.52 0.41 16.64 34.2629.90Furnitures and Fixtures 67.01 28.33 2.92 92.4126.58 6.30 1.78 31.<strong>10</strong> 61.3140.42b) Intangible AssetsSoftware 225.52 8.07 - 233.598.12 44.50 - 52.62 180.97 217.4026,524.48 3,549.35 390.35 29,683.48 3,618.48 1,479.20 40.04 5,057.64 24,625.84 22,906.00Assets held for disposal 4.34 4.13 - 8.46- - - - 8.464.34Total 26,528.82 3,553.48 390.35 29,691.95 3,618.48 1,479.20 40.04 5,057.64 24,634.31 22,9<strong>10</strong>.34Previous Year 22,324.85 4,522.02 318.05 26,528.82 2,367.67 1,254.19 3.38 3,618.48 22,9<strong>10</strong>.34NOTES :1. Gross block of Plant and Machinery includes Rs. 63.49 million (Rs. 63.49 million) in respect of expenditure incurred on capital asset, ownership of which does not vestwith the Company.2. Deductions in gross block for the year includes Rs. 314.57 million on account of decapitalisation of foreign exchange as per amended AS 11.59
th15 <strong>Annual</strong> <strong>Report</strong> <strong>2009</strong>-<strong>10</strong>Schedules forming part of AccountsParticularsAs at31-Mar-<strong>10</strong>(Rs. in Million)As at31-Mar-09Schedule - 6 InvestmentsLong Term (at cost)-Unquoteda) Subsidiary Companies-Wholly Owned<strong>Welspun</strong> Pipes Inc.<strong>10</strong>,001 Equity Shares of $1 each fully paid up16,000 Redeemable Preferred Stock of $ <strong>10</strong>00 each fully paid up #<strong>Welspun</strong> Pipes Limited50,000 Equity Shares of Rs.<strong>10</strong> each fully paid up #0.44 0.44645.50 645.500.50 0.50<strong>Welspun</strong> Infratech Limited24,750,000 (Nil) Equity Shares of Rs.<strong>10</strong> each fully paid up<strong>Welspun</strong> Tradings Limited (Formely Known as Seagull Global Private Limited)5,012,002 (Nil) Equity Shares of Rs. <strong>10</strong> each fully paid up1,000.8550.21--<strong>Welspun</strong> Natural Resources Private Limited<strong>10</strong>,000 (5,<strong>10</strong>0) Equity Shares of Rs.<strong>10</strong> each fully paid up0.<strong>10</strong> 0.05b) Subsidiary Company-Other<strong>Welspun</strong> Urja India LimitedNil (25,500) Equity Shares of Rs.<strong>10</strong> each fully paid up-0.26c) Joint VentureDahej Infrastructure Private Limited (Extent of holding 50%)500,000 Equity Shares of Rs.<strong>10</strong> each fully paid upLess: Provision for Diminutiond) AssociatesRed Lebondal Limited (Extent of holding 25%)450 Equity Shares of Euro 1 each5.00 5.00(5.00)0.03 0.03-<strong>Welspun</strong> Energy Limited (Extent of holding 26%)13,000 (Nil) Equity Shares of Rs.<strong>10</strong> each fully paid up0.13-e) OthersQuoted<strong>Welspun</strong> India LimitedNil (<strong>10</strong>0) Equity Shares of Rs. <strong>10</strong> each fully paid up<strong>Welspun</strong> Syntex LimitedNil (25) Equity Shares of Rs. <strong>10</strong> each fully paid upUnquoted<strong>Welspun</strong> Enterprises (Cyprus) Limited11,800 Equity Shares of Euro 1 each fully paid up--0.0<strong>10</strong>.000.77 0.77<strong>Welspun</strong> Power and Steel LimitedNil (<strong>10</strong>0) Equity Shares of Rs. <strong>10</strong> each fully paid up<strong>Welspun</strong> Global Brands Limited* <strong>10</strong> (Nil) Equity Shares of Rs. <strong>10</strong> each fully paid up<strong>Welspun</strong> Investments Limited* 5 (Nil) Equity Shares of Rs. <strong>10</strong> each fully paid up-0.000.000.00--60
C rp LtdSchedules forming part of AccountsParticularsAs at31-Mar-<strong>10</strong>(Rs. in Million)As at31-Mar-09Current InvestmentsBonds - Quoted9.50% Delhi Transco Limited(4000 Bonds of Rs. <strong>10</strong>0,000 each)398.55-9.55% IFCI Limited 2025(279 Bonds of Rs. 1,000,000 each)268.03-<strong>10</strong>.80% Lakshmi Vilas Bank Limited(<strong>10</strong>8 Bonds of Rs. 1,000,000 each)<strong>10</strong>6.95-9.75% West Bengal State Electricity Transmission Company Limited 2019(120 Bonds of Rs. 1,000,000 each)124.08-8.64% Tamil Nadu Electricity Board(200 Bonds of Rs. 1,000,000 each)200.00-11.45% Punjab Infrastructure Development Board(<strong>10</strong>18 bonds of Rs. 1,000,000 each)-1,018.00<strong>10</strong>.25% Government of India(390 bonds of Rs <strong>10</strong>0,000 each)-47.81Total2,796.14 1,718.37All the above Shares and Securities are fully paid up* Denotes amount less than Rs.<strong>10</strong>,000Aggregate Book Value of Quoted InvestmentsAggregate Book Value of Unquoted InvestmentsAggregate Market Value of Quoted Investments# The Company has given an undertaking to banks for non disposal of its shareholding for credit facilitiesgranted to Subsidiaries1,097.61 1,065.811,698.53 652.561,<strong>10</strong>4.06 1,167.61Mutual Fund Units bought and sold during the yearName of the FundQuantity(Nos. In million)(Rs. In million)Axis Liquid Fund - IP - Daily Dividend Reinvestment Plan 0.45 452.11Axis Treasury Advantage Fund - IP - Daily Dividend Reinvestment Plan 0.05 50.00Bharti AXA Liquid Fund - Super Institutional - Daily Dividend Reinvestment 0.02 24.59Birla Sun Life Cash Manager - IP - Daily Dividend Reinvestment 370.26 3,703.08Birla Sun Life Cash Plus - Instl. Prem. - Daily Dividend Reinvestment 254.91 2,553.68Birla Sun Life Savings Fund - Instl. - Daily Dividend Reinvestment 253.05 2,531.59Baroda Pioneer Treasury Advantage Fund - IP - Daily Dividend Reinvestment 25.00 250.00BOB Pioneer Liquid Fund - IP - Daily Dividend Reinvestment 127.34 1,273.94BOB Pioneer Public Sector Undertaking (PSU) Bond Fund - IP - Monthly Dividend Reinvestment 5.06 50.00Canara Robeco FRF - ST - Daily Dividend Reinvestment Plan 61.33 629.06Canara Robeco Liquid Super Instl. - Daily Div Reinvest Fund 47.60 477.88Canara Robeco Treasury Advantage Fund - Super Institutional - Daily Dividend Reinvest 8.43 <strong>10</strong>4.49DBS Chola Freedom Income Short Term Fund -IP- Daily Div Reinv Plan 60.65 615.06DBS Chola Liquid Fund - Super IP- Daily Dividend Reinvestment Plan 77.06 874.50DSP Black Rock Floating Rate Fund - IP - Daily Dividend Reinvestment 0.68 680.89Cost61
th15 <strong>Annual</strong> <strong>Report</strong> <strong>2009</strong>-<strong>10</strong>Schedules forming part of AccountsMutual Fund Units bought and sold during the yearName of the FundQuantity(Nos. In million)(Rs. In million)CostDSP Black Rock Liquidity Fund -IP-Daily Dividend Reinvestment 1.56 1,557.45DWS Credit Opportunities Cash Fund - Daily Dividend Reinvestment 5.54 55.36DWS Insta Cash Plus - Super IP - Daily Dividend Reinvestment 61.15 613.19DWS Short Maturity Fund - IP - Weekly Dividend Reinvestment Plan 4.78 50.01DWS Treasury Fund - Cash - IP - Daily Dividend Reinvestment 29.40 295.08DWS Ultra Short - Term Fund - IP - Daily Dividend Plan <strong>10</strong>.00 <strong>10</strong>0.03Fortis Money Plus Institutional Plan - Daily Dividend 39.16 390.70Fortis Overnight Fund - Institutional Plan - Daily Dividend 59.11 591.12HDFC Cash Management Fund - Saving Plan - Daily Dividend Reinvestment Plan 199.52 2,121.98HDFC Cash Management Fund - Treasury Advantage - Wholesale Plan - Daily Dividend Reinvest 80.93 811.41HDFC Liquid Fund Premium Plan - Dividend - Daily Reinvest 128.86 1,579.55HDFC Liquid Fund Premium Plus Plan - Dividend - Daily Reinvest 25.40 311.34ICICI Prudential Flexible Income Plan - Premium Plan - Daily Dividend Reinvestment 203.42 2,436.92ICICI Prudential Instl. Liquid Plan - Super Instl. - Daily Dividend Reinvestment 332.43 4,641.11IDFC Cash Fund - Plan C - Super IP - Daily Dividend Reinvestment 74.54 745.50IDFC Money Manager - Treasury Plan - Super Instn Plan C - Daily Dividend Reinvestment 68.70 687.05JM High Liquidity Fund - Super IP - Daily Dividend Reinvestment Plan 4.99 50.00JM Money Manager Fund - Super Plus Plan - Daily Dividend Reinvestment 5.00 50.01JP Morgan India Liquid Fund - Super Instn - Dividend Plan - Reinvest 159.80 1,598.89JP Morgan India Treasury Fund - Super Instn - Daily Dividend Plan - Reinvest 46.39 463.93Kotak Flexi Debt Fund -IP - Daily Dividend Reinvestment 9.96 <strong>10</strong>0.01Kotak Floater - LT - Daily Dividend Reinvestment Plan 52.65 529.39Kotak Liquid Institutional Premium Plan - Daily Dividend Reinvestment 72.28 883.65LICMF Floating Rate Fund - Daily Dividend Reinvestment Plan 4,589.39 45,863.57LICMF Income Plus Fund - Daily Dividend Reinvestment Plan 660.35 6,600.31LICMF Liquid Fund - Daily Dividend Reinvestment Plan <strong>10</strong>,989.57 120,645.80LICMF Saving Plus Plan - Daily Dividend Reinvestment 2,604.89 26,030.29Principal Cash Management Fund Liquid Option - Instl Prem Plan - Dividend Reinvestment Daily 59.94 599.42Reliance Medium Term Fund - Daily Dividend Reinvestment 7.16 122.34Reliance Liquidity Fund-Daily Dividend Reinvestment Option 51.84 518.42Religare Credit Opportunities Fund - IP - Monthly Dividend Reinvestment Plan 5.09 50.80Religare India Liquid Fund - Institutional - Daily Dividend Reinvestment Plan 2.08 20.77Religare India Liquid Fund - Super Institutional - Daily Dividend Reinvestment Plan 3.00 30.00Religare Ultra Short Term Fund - IP - Daily Dividend Reinvestment Plan 2.08 20.77Magnum Insta Cash Fund - Daily Dividend Option 347.06 5,812.40SBI Premier Liquid Fund - Instl Plan - Daily Dividend Reinvestment 760.22 7,625.96Shinsei Liquid Fund - IP - Daily Dividend Reinvestment Plan 2.00 20.00Shinsei Treasury Advantage Fund -IP-Daily Dividend Reinvestment 0.05 50.00Sundaram BNP Paribas Money Fund Super Inst.Daily Div.Rein 18.94 191.20Sundaram BNP Paribas Ultra Short Term - Super IP - Daily Dividend Reinvestment 19.05 191.21Tata Floating Rate Short Term Inst. Plan - Daily Dividend 92.09 921.81Tata Liquid Super High Investment Fund - Daily Dividend 0.46 513.50Tata Treasury Manager Fund - SHIP - Daily Dividend Reinvestment Plan 0.49 500.04Taurus Liquid Fund Super IP - Daily Dividend Reinvestment Plan 5.00 50.00Templeton Floating Rate Income Fund - Long Term - Super IP - Daily Dividend Reinvestment Plan 33.24 331.38Templeton Floating Rate Income Fund - Short Term - Super IP - Daily Dividend Reinvestment Plan 26.04 264.34Templeton India Treasury Mgt Account Super Instl Plan - Daily Dividend Reinvestment 1.23 1,232.50Templeton India Ultra Short Bond Fund - Super IP - Daily Dividend Reinvestment <strong>10</strong>.00 <strong>10</strong>0.01UTI Floating Rate Fund - STP - IP - Daily Dividend Reinvestment Plan 1.00 1,000.08UTI Liquid Cash Plan Institutional - Daily Income Option - Re-investment 2.23 2,269.93UTI Money Market Fund - Daily Dividend Option - Re-investment 8.18 150.00UTI Money Market Fund - IP- Daily Dividend Option - Re-investment 1.43 1,433.6962
C rp LtdSchedules forming part of AccountsParticularsSchedule - 7 Inventories(As taken, valued and certified by the management)Raw MaterialsStores and SparesFinished GoodsWork / Goods In ProcessGoods in Transit(Rs. in Million)As at31-Mar-<strong>10</strong>As at31-Mar-093,586.44 11,099.17895.36 728.852,697.19 4,850.13564.64 2,334.925,299.29 4,223.34Total13,042.92 23,236.41Schedule - 8 Sundry Debtors(Unsecured and considered good, unless otherwise stated)More than six months - considered good- considered doubtful831.98 872.8097.28 97.29Others - considered good *7,208.894,965.758,138.15 5,935.84Less: Provision for doubtful debts97.28 97.29* include due from Subsidiaries Rs. 1858.55 million (Rs. 1,860.99 million)Total8,040.87 5,838.55Schedule - 9 Cash and Bank BalancesCash in handCheques in hand3.08 4.53-2.27Balance with Scheduled Banks- In Current Accounts *- In Margin Money Accounts- In Fixed Deposit Accounts774.05 4,834.96621.49 699.257,813.78 3,641.59Balance with Non-Scheduled Banks- In Current Accounts -Banque Exterieure'd Algerie(Maximum Balance outstanding Rs. 72.52 million (Rs. 36.27 million)* includes Rs. 3.11 million (Rs. 2.28 million) being balance in unclaimeddividend accounts not available for use by the Company.Total0.00 11.119,212.40 9,193.71Schedule - <strong>10</strong> Loans and Advances(Unsecured and considered good, unless otherwise stated)Loans and Advances to Subsidiaries-Share Application Money-Other Loans and Advances2,151.89-1,695.514,769.57Advances(Recoverable in cash or in kind or for value to be received)Balances with excise and customs authorities etc.Other AdvancesDeposits2,087.321,559.91530.736,329.853,030.781,087.25566.7011,149.8163
th15 <strong>Annual</strong> <strong>Report</strong> <strong>2009</strong>-<strong>10</strong>Schedules forming part of AccountsParticularsAs at31-Mar-<strong>10</strong>(Rs. in Million)As at31-Mar-09Less: Provision for doubtful Advances135.70-Schedule - 11 Current LiabilitiesAcceptancesSundry CreditorsDue to Micro Small and Medium Enterprises (Refer Note 5)Due to OthersTotal 6,194.157,000.300.858,132.9511,149.8130,940.781.586,085.83Trade Advances and DepositsInterest accrued but not dueUnclaimed Dividend *1,201.46264.613.11322.35254.352.28* There is no amount due and outstanding to be credited to InvestorEducation and Protection Fund as at 31March 20<strong>10</strong>Schedule - 12 ProvisionsFor Proposed Dividend (Including tax on proposed dividend)For Taxation (Net)For Retirement BenefitsTotal 16,603.28 37,607.18476.51 327.28624.02 242.9734.27 30.03Total 1,134.80 600.28ParticularsYear ended31-Mar-<strong>10</strong>Year ended31-Mar-09Schedule - 13 Sales and ServicesSalesJob Work and Other charges(Tax deducted at source Rs 0.03 million (Rs.16.68 million)Export and Excise Benefits67,769.27 57,278.77846.30 2,509.87308.75 1,308.18Total 68,924.32 61,096.82Schedule - 14 Other IncomeDividend (Gross)Profit on sale of InvestmentsMiscellaneous Income91.52 70.73<strong>10</strong>.62 68.6225.60 39.44Total 127.74 178.79Schedule - 15 Cost of Goods(A) Raw Materials consumedOpening StockPurchases (Net) *Less: Closing Stock11,099.17 6,094.6530,563.13 48,467.7441,662.30 54,562.393,586.44 11,099.17Total (A) 38,075.86 43,463.22(B) Purchases of Traded GoodsTotal (B)2,900.952,900.952,763.752,763.75(C) Increase/(Decrease) in StockClosing StockFinished GoodsWork/Goods In Process2,697.19564.643,261.834,850.132,334.927,185.0564
Schedules forming part of AccountsParticularsYear ended31-Mar-<strong>10</strong>C rp Ltd(Rs. in Million)Year ended31-Mar-09Less : Opening StockFinished GoodsWork/Goods In ProcessLess: Increase/(Decrease) in Excise duty on Finished Goods4,850.132,334.927,185.0528.431,626.131,122.432,748.57323.45* Includes transfer from Trial Run Rs. 40.05 million (Rs. Nil)ParticularsSchedule - 16 Manufacturing and Other ExpensesStores and Spares consumedCoating and Other Job chargesPower, Fuel and Water chargesMaterial handling and Transport chargesFreight expensesCommission and Discounts on salesDirectors' RemunerationSalaries, Wages and AllowancesContribution to fundsStaff welfare expensesRentRates and TaxesRepairs and Maintenance- Plant and Machinery- Buildings- OthersTravelling and Conveyance expensesCommunication expensesProfessional and Consultancy feesInsuranceDirectors' sitting feesPrinting and StationarySecurity chargesMembership and SubscriptionVehicle expensesForeign Exchange difference (Net)Miscellaneous expensesAuditors' RemunerationSales Promotion expensesDiminution in value of Current / Long Term InvestmentsLoss on sale / discard of fixed assetsBad debts and Advances written offProvision for doubtful Debts / Advances (Net)Schedule - 17 Finance Expenses (Net)Interest onDebenturesFixed LoansWorking CapitalOthersDiscounting and Other chargesLess: Interest received (Gross) *(Tax deducted at source Rs. 160.97 million (Rs. 53.79 million)Total (C)Total (A)+(B)-(C)* includes interest received from a Subsidiary Rs. 204.<strong>10</strong> million (Rs. 139.24 million)TotalTotal(3,951.65)44,928.46Year ended31-Mar-<strong>10</strong>4,113.0442,113.92Year ended31-Mar-091,578.48 982.30172.67 2,525.151,527.20 1,3<strong>10</strong>.891,095.53 1,470.211,317.41 1,907.48880.88 676.66<strong>10</strong>8.16 69.471,155.89 947.2861.40 49.6890.86 86.4997.66 79.92282.27 61.82165.06 46.0123.26 16.0517.53 15.52148.68 137.4223.49 19.74486.00 53.3876.15 59.070.54 0.4012.38 11.8915.27 20.4811.20 7.8420.87 16.76387.41 (309.99)93.52 86.447.11 4.0425.33 24.235.00 1.0645.48 5.1144.<strong>10</strong> 1.58135.69 (61.60)<strong>10</strong>,112.49 <strong>10</strong>,322.78323.66 337.431,111.58 1,165.8012.24 <strong>10</strong>8.04303.08 385.641,750.56 1,996.91376.01 518.372,126.57 2,515.28464.87 780.321,661.70 1,734.9665
th15 <strong>Annual</strong> <strong>Report</strong> <strong>2009</strong>-<strong>10</strong>Schedule: 18 Significant Accounting Policies and Notes to AccountsA. Significant Accounting Policies1. Basis of AccountingThe financial statements have been prepared under the Historical Cost Convention on accrual basis and in accordance withthe accounting standards referred to in Section 211(3C) of the Companies Act 1956.Pursuant to the announcement of the Institute of Chartered Accountants of India (ICAI) on “Accounting for Derivatives” onthe early adoption of Accounting Standard (AS-30) “Financial Instruments: Recognition and Measurement”, the Companyhas early adopted the standard w.e.f 1 April 2007, to the extent that the adoption does not conflict with the existingmandatory accounting and other authoritative pronouncements, Company Law and other regulatory requirements.2. Use of EstimatesThe preparation of the financial statements in accordance with the generally accepted accounting principles requires themanagement to make estimates and assumptions that affect the reported amounts of assets and liabilities, disclosure ofcontingent liabilities as at the date of the financial statements and the reported amount of revenue and expenses of the year.Actual results could differ from those estimates. Any revision of such accounting estimate is recognized prospectively incurrent and future periods.3. Fixed Assets(a)Fixed assets are stated at original cost of acquisition / installation (net of cenvat credit availed) net off accumulateddepreciation, amortization and impairment losses except land which is carried at cost. The cost of fixed assets includescost of acquisition, construction and installation, taxes, duties, freight, other incidental expenses related to theacquisition including trial run expenses (net of revenue) and borrowing cost incurred during pre-operational period.(b) Capital Work-In-Progress is stated at the amount expended upto the date of Balance Sheet including pre-operativeexpenditure and advances on capital account.(c)Cost of Software includes license fees, cost of implementation and system integration and capitalized as intangibleassets in the year in which the relevant software is put to use.4. Borrowing CostsBorrowing costs attributable to the acquisition or construction of qualifying assets are capitalized as part of cost of suchassets. All other borrowing costs are charged to revenue.5. Depreciation(a)(b)(c)Depreciation on fixed assets is provided on Straight Line Method at the rates prescribed in Schedule XIV to theCompanies Act, 1956 except for certain Plant and Machinery which are depreciated on the basis of estimated useful livesof 13-15 years. The rates of depreciation derived from these estimated useful lives are higher than those given inSchedule XIV to the Companies Act, 1956.For determining the appropriate rate of depreciation on Plant and Machinery, continuous process plant has beenidentified on the basis of technical opinion by the Company / Expert.Software is amortized over a period of five years from the date of its use based on Management's estimate of useful life.6. InvestmentsInvestments intended to be held for more than a year, from the date of acquisition, are classified as long-term and are statedat cost. Provision for diminution in value of investments is made to recognize a decline other than temporary. CurrentInvestments are stated at cost or fair value whichever is lower.7. Revenue Recognition(a)Sale of goods is recognized when the risks and rewards of ownership are passed on to the customers, which is generallyon dispatch. Export Sales are accounted for on the basis of date of bill of lading. Gross Sales include excise duty, valueadded tax incentive, adjustments for price variation, quality claims, liquidated damages and exchange rate variationsrelated to export realization.66
C rp Ltd(b)(c)(d)Export benefits: Duty Entitlement Pass Book (DEPB) and Focus Market are accounted on accrual basis. Target Plus /DutyFree Entitlement Certificate scheme of EXIM policy are recognized when utilized.Revenue from Services is recognized when the services are completed.Dividend income is recognized when the right to receive the dividend is unconditional.8. InventoriesInventories are valued at lower of cost or net realizable value. The basis of determining cost for various categories ofinventories is as follows;(i) Raw Materials, Stores and Spares - Moving weighted average basis.(ii) Work / Goods in Process and Finished Goods - Cost of Direct Material, Labour and other manufacturing expenses.9. Foreign Currency Transactions(a)(b)(c)Foreign exchange transactions are converted into Indian Rupees at the prevailing rate on the date of the transactions.Current monetary assets and liabilities are translated at the exchange rate prevailing on the last day of the year. Nonmonetary items are carried at cost.Gains or losses arising out of remittance / translations at the year-end are credited / debited to the profit and lossaccount for the year and where it relates to acquisition of fixed assets, are adjusted to the carrying cost of such assetsexcept treatment as per amendment to AS-11 (Refer note no 6 (b)).Premium / discount on forward exchange contracts not relating to firm commitments or highly probable forecastedtransactions and not intended for Trading or Speculation purpose is amortized as income or expense over the life of thecontract.<strong>10</strong>. Derivative Instruments and Hedge AccountingThe Company uses foreign currency forward contracts to hedge its risk associated with foreign currency fluctuations relatingto certain firm commitments and forecasted transactions. The Company designates these hedging instruments as cash flowhedges and applying the recognition and measurement principles set out in Accounting Standard 30 “Financial Instruments:Recognition and Measurement” (AS 30). The gain or loss on the effective hedges is recorded in “Hedging Reserve Account”until the transaction is complete. The gain or loss is accounted in Profit and Loss Account upon completion of the transactionor when the hedge instrument expires or terminates or ceases to qualify for hedge accounting.11. Employee Benefitsa) Short term employee benefits are recognized as an expense at the undiscounted amount in the Profit and Loss accountof the year in which the related service is rendered.b) Post employment and other long term benefits are recognized as an expense in the profit and loss account of the year inwhich the employee has rendered services. The expense is recognized at the present value of the amounts payabledetermined using actuarial valuation techniques. Actuarial gains and losses in respect of post employment and otherlong-term benefits are charged to the Profit and Loss account.(c)Payments to defined contribution retirement benefit schemes are charged as expenses as and when they fall due.12. Employee Stock Options SchemeIn respect of employee stock options granted pursuant to the Company's Stock Option Scheme, the intrinsic value of theoptions (excess of market price of the share over the exercise price of the option) is treated as discount and accounted asemployee compensation cost over the vesting period.13. Accounting for Taxes on Income(a)(b)Current tax is determined as the amount of tax payable in respect of taxable income of the year computed as per theIncome Tax Act, 1961.Deferred tax is recognized subject to consideration of prudence, on timing difference, being the difference betweentaxable income and accounting income that originate in one period and are capable of reversal in one or moresubsequent periods and measured using prevailing enacted or substantively enacted tax rates.67
th15 <strong>Annual</strong> <strong>Report</strong> <strong>2009</strong>-<strong>10</strong>14. Operating LeaseLease of assets under which all the risks and rewards of ownership are effectively retained by the lessor are classified asoperating leases. Lease payments under operating leases are recognized as an expense on accrual basis in accordance withthe respective lease agreements.15. Research and DevelopmentCapital expenditure on research and development is treated in the same manner as fixed assets. Revenue expenditure onresearch and development is charged to Profit and Loss Account.16. Impairment of AssetsAt each Balance Sheet date, the Company reviews the carrying amount of fixed assets to determine whether there is anyindication that those assets suffered impairment loss. If any such indication exists, the recoverable amount of the assets isestimated in order to determine the extent of impairment loss. The recoverable amount is higher of the net selling price andvalue in use, determined by discounting the estimated future cash flows expected from the continuing use of the asset totheir present value.68
C rp LtdB. Notes to Accounts1. Foreign Currency Convertible Bonds (FCCB)a) During the year, the Company has raised US$ 150 million (Equivalent INR 6,942 million) by way of issue of 1,500, 4.5%Foreign Currency Convertible Bonds (FCCB) of US$ <strong>10</strong>0,000 each. The Bondholders have an option to convert thesebonds into 24,0<strong>10</strong>,000 equity shares at an initial conversion price of Rs. 300 per share of Rs. 5 each fully paid up with afixed rate of exchange on conversion of Rs. 48.02= US$ 1 at any time on or after 26 November <strong>2009</strong> until <strong>10</strong> days prior toMaturity date (i.e 17 October 2014). Unless previously converted, redeemed or repurchased and cancelled, the Bondswill be redeemed on 17 October 2014 at <strong>10</strong>2.8028% of the principal amount so as to give a gross yield of 5% per annum(calculated on semi annual basis) to the Bond Holders.The Company has an option to redeem the Bonds at their Early Redemption Amount upon occurrence of eventsspecified in the Offering Circular issued by the Company for issue of the Bonds (“Offering Circular”). Further, theCompany has the option to mandatorily convert the Bonds after three years as specified in the Offering Circular.b) Premium payable on redemption of FCCB aggregating to Rs. 15.62 million has been adjusted against Securities PremiumAccount (SPA) as per Section 78 of the Companies Act,1956. In the event that the holders of FCCB exercise theconversion option, the amount of premium utilized from SPA will be suitably adjusted in respective years.(c)Part of the net proceeds received from the issue of FCCB has been utilized as per object of the issue viz for funding ofPlate / Coil Mill and Pipe Mill Capex Projects. Pending utilization, the issue proceeds of USD 122.35 million (EquivalentINR 5,493.66 million) have been invested in short term deposits with Banks abroad.2. Qualified Institutional Placement (QIP)a) The Company has launched a Qualified Institutional Placement (QIP) on 24 November <strong>2009</strong> and raised equity fundsaggregating to Rs. 4,662 million by issuing 16,694,718 equity shares of face value of Rs. 5 each, at a premium of Rs.274.25 per equity share to certain “Qualified Institutional Buyers” (QIBs) in accordance with the terms of chapter XIII-Aof the SEBI (DIP) Guidelines.b) Share issue expenses related to QIP aggregating to Rs. 58.28 million is adjusted against Securities Premium Account(SPA) as per Section 78 of the Companies Act, 1956.3. Employee Stock Options SchemeIn respect of options granted under the <strong>Welspun</strong> Employee Stock Options Scheme, in accordance with the guidelines issuedby Securities and Exchange Board of India, the value of options (based on intrinsic value of the share on the date of the grantof the option) is accounted as deferred employee compensation, which is amortized on a straight line basis over the vestingperiod. Salaries, wages and allowances include Rs 13.06 million (Rs. 21.85 million) deferred employee compensation underEmployee Stock Options Scheme.During the year, 1,136,500 equity shares of Rs. 5 each fully paid up were issued at a price of Rs. 80.00 each, on exercise ofoptions by employees. Discount allowed aggregating to Rs. 30.40 million (Rs. 1.65 million) in respect of shares allottedpursuant to Stock Options Scheme is credited to Securities Premium Account as per guidelines of Securities and ExchangeBoard of India.Stock options outstanding as at the year end are as follows:Particulars Granted during 2006-07 Granted during 2007-08 Granted during <strong>2009</strong>-<strong>10</strong>Exercise Price Rs. 80Rs. 94.<strong>10</strong> Rs. 66.75Date of Grant 8 January 200724 April 2007 20 April <strong>2009</strong>Vesting period commences on 8 January 200824 April 2008 20 April 20<strong>10</strong>Options outstanding at the beginning of the period 2,138,75090,000 NilOptions granted during the year ---- 47,500Options exercised during the year 1, 136,500Nil NilOptions lapsed during the year <strong>10</strong>5,25090,000 NilOutstanding as at 31 March 20<strong>10</strong>897,000 Nil 47,50069
th15 <strong>Annual</strong> <strong>Report</strong> <strong>2009</strong>-<strong>10</strong>4. Secured Loansa) Redeemable Secured Non-Convertible Debentures (NCD)ParticularsNo. ofDebenturesFace Value(In Rs.)Date ofAllotmentRedemption fromthe date ofallotmentInterest(p.a.)Amount (Rs.in million)The debentures together with interest are secured by first charge ranking pari passu by way of mortgage/hypothecation ofentire immovable and movable fixed assets of the Company, both present and future and second/floating charge on currentassets, subject to prior charge in favour of banks for working capital facilities.b) Term Loan from BanksTerm Loans of Rs. 3,181.13 million (Rs. <strong>10</strong>,606.32 million) are secured by first charge ranking pari passu by way ofmortgage / hypothecation of entire immovable and movable fixed assets of the Company both present and future andalso secured by second / floating charge on current assets subject to prior charge in favour of banks for working capitalfacilities.c) External Commercial Borrowings (ECB)ECB of Rs 6,789.99 million (Rs. 7,623.87 million) is secured by first charge ranking pari passu by way of mortgage /hypothecation on entire immovable and movable fixed assets of the Company both present and future. Further the ECBis secured by exclusive charge by way of hypothecation of Debt Service Reserve Account.d) Working Capital facilitiesWorking Capital facilities from banks are secured by first charge by way of hypothecation of raw materials, finishedgoods and goods in process, stores & spares and book debts of the Company and second charge on entire immovableand movable fixed assets of the Company both present and future of the Company.5. Micro, Small and Medium EnterprisesThe Company has amounts due to suppliers under The Micro, Small and Medium Enterprises Development Act, 2006(MSMED Act) as at 31 March 20<strong>10</strong>. The disclosure pursuant to the said Act is as under:(Rs. in million)Particulars 31 March 20 <strong>10</strong>31 March <strong>2009</strong>Principal amount due to suppliers under MSMED Act, 2006 0.851.58Interest accrued and due to suppliers under MSMED Act, on the above amount0.0<strong>10</strong>.01Payment made to suppliers (Other than interest) beyond the appointed day,during the year16.8635.07Interest due and payable to suppliers under MSMED Act, for payments alreadymade0.130.24Interest accrued and remaining unpaid at the end of the year to suppliersunder MSMED Act0.940.80The above information and that given in Schedule -11 “Current Liabilities and Provisions” regarding Micro, Small and MediumEnterprises has been determined to the extent such parties have been identified by the Company on the basis of informationavailable.6. Foreign Exchange Differencesa) Loss on account of difference in foreign exchange on realignment/realization and on cancellation of derivativeinstruments amounting to Rs. 5.30 million (Rs. 3,433.25 million) is adjusted under respective heads of income orexpenses in the Profit and Loss account to which it relates and exchange difference gain of Rs. Nil (Rs. 6.27 million) otherthan (b) below, has been adjusted to the carrying cost of fixed assets/capital work in progress.b) The Companies (Accounting Standards) Amendment Rules <strong>2009</strong> has amended the provision of AS-11 related to "Theeffects of changes in Foreign Exchange Rates" vide notification dated 31 March <strong>2009</strong> issued by the Ministry of CorporateAffairs. Accordingly, the Company has adjusted exchange difference gain amounting to Rs. 348.36 million (Loss of Rs.70
C rp Ltd616.20 million) to the cost of fixed assets and exchange difference gain of Rs. 93.76 million (Loss of Rs. 532.50 million) istransferred to "Foreign Currency Monetary Item Translation Difference Account" to be amortized over the balanceperiod of such long term assets / liabilities but not beyond 31 March 2011. Out of the above, gain of Rs. 18.34 million(Loss of Rs.177.50 million) has been adjusted in the current year and gain of Rs. 75.42 million (Loss of Rs. 354.98 million)has been carried over.c) The Company has early adopted AS-30 as referred to in Note A (i) of the Significant Accounting Policies and accordinglyloss of Rs. 31.86 million (Rs. 2,004.20 million) related to foreign exchange difference on Cash Flow Hedges for certainfirm commitments and forecasted transactions is recognized in Shareholders' Funds and shown as Hedging ReserveAccount.7. Disclosure of Derivative Instruments and Unhedged Foreign Currency ExposureThe outstanding foreign currency derivative contracts as at 31 March 20<strong>10</strong> in respect of various types of derivative hedgeinstruments and nature of risk being hedged and not hedged are as follows:(Rs. in million)Particulars 31 March 20<strong>10</strong> 31 March <strong>2009</strong>a) In respect of Short term receivables and payables(i) In respect of Debtorsa) Existing as on the balance sheet dateb) In respect of future forecasted transactions(ii) In respect of Creditorsa) Existing as on the balance sheet dateb) In respect of future forecasted transactionsb) In respect of short term receivables and payablesexisting as on balance sheet date(i) Other short term assets or receivables(ii) Other short term liabilities or payablesc) In respect of long term receivables and payables existingas on balance sheet date(i) In respect of Foreign Currency Loan receivables(ii) In respect of Foreign Currency Loan payablesd) Other Derivative Hedge instrumentsNote:* The net un-hedged short term receivables as on 31 March 20<strong>10</strong> is Rs. 392.82 million (as on 31 March <strong>2009</strong> net un-hedged short term payableswas Rs. 13,095.92 million) resulting in natural hedge against foreign exchange rate fluctuation.Details of Cross Currency derivative contractsCross Currency HedgesIn respect of Short term receivablesAmountHedgedAmountUnhedged*AmountHedgedAmountUnhedged*- 1,389.47- 5,238.965,975.39 -16,483.09 -3,344.69 6,542.76- 19,772.695,544.95 -4,312.45 -- 6,324.36- 2,786.04- 778.257,556.86 1,348.23- -- 2,536.00437.62 13,524.9968.47 7,623.874,245.00- 3,536.00 -Particulars 31 March 20<strong>10</strong>31 March <strong>2009</strong>Amount in Foreign C urrencyEUR/USD 2.0088.15In respect of Short term payablesAmount in Foreign C urrencyEUR/USD 44.7574.22JPY/USD 184.139.76(Rs. in million)8. Managerial Remunerationa) Remuneration paid or provided in accordance with section 198 of the Companies Act, 1956 to the Directors is asunder:(Rs. in million)ParticularsManaging DirectorWhole Time Directors31 March 20<strong>10</strong> 31 March <strong>2009</strong> 31 March 20<strong>10</strong> 31 March <strong>2009</strong>Salaries and Allowances5.505.5014.3927.85Commission87.8531.27--Perquisites / Contribution to Provident Fund--0.424.85Total93.3536.7714.8132.7071
th15 <strong>Annual</strong> <strong>Report</strong> <strong>2009</strong>-<strong>10</strong>Notes:(i)(ii)Salaries and Allowances include basic salary, house rent allowance and leave travel allowance.Provision for post retirement benefits which is based on actuarial valuation done on an overall Company basis isexcluded from the above calculation.b) Computation of Net Profit in accordance with Section 349 of the Companies Act, 1956 and commission payable to theManaging Director is as under:(Rs. in million)ParticularsProfit before Tax as per Profit and Loss accountAdd: Managerial RemunerationDirectors’ Sitting feesDepreciation as per profit and loss accountLoss on sale/discard of fixed assetsWealth TaxDiminution in value of long term current investmentsProvision for doubtful Debts / Advances (Net)Less: Depreciation u/s 350FCCB Premium adjustmentTotalProfit on Sale of Current InvestmentsForeign Currency Monetary Item Translation Difference Account -NetNet Profit for Section 198Commission to Managing Director @1%Maximum permissible managerial remuneration to Managing Directors and WholeTime Directors under Section 198 of the Companies Act, 1956 @ <strong>10</strong>% of the profits computed above31 March 20<strong>10</strong>8,085.24<strong>10</strong>8.160.541479.2045.480.265.0135.699859.571479.2015.62<strong>10</strong>.62(430.39)8,784.5287.85878.4531 March <strong>2009</strong>3,536.0869.470.401254.195.1<strong>10</strong>.261.06(61.60)4804.971254.19--68.62354.983127.1831.27312.72Restricted as per service agreements <strong>10</strong>8.1669.479. Contingent Liabilities not provided for(Rs. in million)Particula rs 31 March 20<strong>10</strong> 31 March <strong>2009</strong>Performance Guarantees/Bid Bond given by banks to company’s customers / government authoritiesetc.Corporate Guarantees given by the company (includes Rs. 5,246.70 million (Rs. 4,131.17 million) forLoans/Liabilities taken by the subsidiaries. Loans / Liabilities outstanding against these guarantees areRs. 5,018.83 million (Rs. 4,131.17 Million))Letters of Credit outstanding (net of liability provided) for company’s sourcingClaims against the Company not acknowledged as debtsCustom duty on pending export obligation against import of Raw MaterialsDisputed service tax /sales tax/ excise duty liabilities15,697.136,385.2715,840.2813.46561.3675.7513,648.356,954.024,683.7511.631,011.7692.37<strong>10</strong>. During the previous year one of the customer reported defect in the pipes supplied alleging grade of steel used did not meetthe specifications, the company replaced the defective pipes and also provided for the expected loss on this account. Duringthe year the said customer initiated legal action against the company in the United States of America claiming loss / damagesof $ 66 million on account of defects in the pipes supplied, consequently the company also initiated legal action against thesteel supplier claiming corresponding loss / damages it may suffer on account of this claim of the customer. Hence thecompany does not expect any liability on account of the claim against it.11. Disclosures pursuant to adoption of Accounting Standard 15 (Revised 2005) Employee BenefitsThe Employees gratuity fund scheme managed by Kotak Life Insurance Limited is a defined benefit plan. The present value ofobligation is based on actuarial valuation using the projected unit credit method. The obligation for leave encashment isrecognized in the same manner as gratuity.72
C rp LtdDefined Benefit PlanDetails of defined benefit plan of Gratuity (Funded) and Leave Encashment (Non-Funded) are as follows:I. Actuarial AssumptionsEconomic AssumptionsMajor Assumptions<strong>2009</strong>-<strong>10</strong> (%p.a.)2008-09 (%p.a.)Discount Rate (p.a.) 8.57.75Expected Return on Assets 6 to 7.56.0Salary Escalation Rate 5.755.0Demographic AssumptionMajor AssumptionsMortality Latest Compiled Table of LIC (1994 -96)Retirement Age 60 years for all staff and workers (except in case ofPresidents and above 62 Years)Attrition Rate 2% upto age 44 and 1% thereafterII. Expenses Recognized in the Profit and Loss Account(Rs. in million)ParticularsGratuityGratuityLeave EncashmentLeave(Funded)(Funded)(Unfunded)Encashment(Unfunded)III. Present Value of Defined Benefit Obligation and the Fair Value of AssetsParticularsPresent Value of Obligation as at 31 March 20<strong>10</strong>Fair Value of Plan Assets as at 31 March 20 <strong>10</strong>Liability Recognized in the Balance Sheet and disclosedunder Current Liabilities and Provisions (Refer Schedule -12)Gratuity(Funded)<strong>2009</strong>-<strong>10</strong>Gratuity(Funded)2008-09Leave Encashment(Unfunded)<strong>2009</strong>-<strong>10</strong>(Rs. in million)Leave Encashment(Unfunded)2008-0970.78 59.00 34.2730.0370.78 59.00 NilNilNil Nil 34.2730.03IV. Change in the Present Value of Obligation(Rs. in million)ParticularsGratuityGratuityLeaveLeave Encashment(Funded)(Funded)Encashment(Unfunded)(Unfunded)<strong>2009</strong>-<strong>10</strong>2008-09<strong>2009</strong>-<strong>10</strong>2008-09Present Value of Obligation as at 1 April <strong>2009</strong> 59.0045.<strong>10</strong> 30.03 20.76Current Service Cost 50.5644.9833.8431.47Interest Cost 4.954.60 2.482.22Benefits Paid (8.08)(1.89) (7.42)(3.50)Actuarial (Gain)/Loss on Obligations (35.65)(33.79) (24.66) (20.92)Present Value of Obligation as at 31 March 20<strong>10</strong> 70.7859.00 34.27 30.0373
th15 <strong>Annual</strong> <strong>Report</strong> <strong>2009</strong>-<strong>10</strong>V. Change in Fair Value of Plan Assets(Rs. in million)ParticularsGratuityGratuity(Funded)(Funded)<strong>2009</strong>-<strong>10</strong>2008-09Fair Value of Plan Assets as at 1 April <strong>2009</strong> 59.0045.<strong>10</strong>Expected Return on Plan Assets 4.17 2.44Actuarial Gain/(Loss) on Plan Assets 15.26(12.64)Contributions 0.43 25.99Benefits Paid(8.08)(1.89)Fair Value of Plan Assets as at 31 March 20 <strong>10</strong> 70.78 59.00* Included in the “Contribution to funds” (Refer Schedule-16).12. Capital Projects(i) Pre-operative Expenses (including accumulated borrowing costs of Rs. 378.87 million) of Rs. 488.98 million (Rs. 266.46million) in respect of projects capitalized during the year have been allocated proportionately to the direct cost ofrespective building and plant and machinery.(ii) Borrowing costs related to Plate and Coil Mill capitalized / allocated to fixed assets / Capital work in progress is Rs. 47.87million (Rs. 240.30 million).(iii) Estimated amount of contracts remaining to be executed on Capital account and not provided for Rs. 3,415.52 million(Rs. 733.69 million), net of advances.(iv) Capital Work in Progress, includes Capital Advances Rs. 929.06 million (Rs. 403.43 million) and Pre-operative expensesRs. 35.35 million (Rs. 460.27 million).(v)The details of Pre-operative Expenses are as under:(Rs. in million)ParticularsExpenditure upto previous yearAdd: Expenses incurred during the yearJob chargesPower, Fuel and Water ChargesMaterial Handling and Transport ChargesSalary, Wages and AllowancesStaff WelfareRentRates and TaxesRepairs and Maintenance ExpensesTravelling and Conveyance ExpensesCommunication ExpensesProfessional and Consultancy FeesInsuranceVehicle expensesSecurity chargesMiscellaneous expensesFinance expensesSub TotalTrial Run ExpensesRaw Material Consumed- M S Slabs 2,284.57 MT (Nil)Production- H. R. Coils 2,226.45 MT (Nil)Stores and Spares ConsumedPower, Fuel and Water chargesSalaries, Wages and AllowancesSelling and Distribution ExpensesTrial Run RecoveriesNet Sales- H. R. Coils 636.24 MT (Nil)Finished goods transferred to operation- H. R. Coils 1590.25 MT (Nil)Net LossTotalLess : Amount allocated to Assets Capitalized during the yearBalance Carried to Balance Sheet31 March 20<strong>10</strong> 31 March <strong>2009</strong>460.270.670.56-0.27-0.2<strong>10</strong>.30-0.360.042.144.400.390.032.3947.8759.6354.750.246.130.411.39(18.44)(40.05)4.43524.33488.9835.35471.96--(2.67)11.850.38--1.51-0.240.452.53--0.18240.30254.77---------726.73266.46460.2774
C rp Ltd13. Segment <strong>Report</strong>ing(I)(II)The Company is engaged in the business of steel products which in the opinion of the management is considered theonly business segment in the context of Accounting Standard 17 on “Segment <strong>Report</strong>ing”.Information about Secondary-Geographical Segment(Rs. in million)* includes deemed export Sales of Rs. 21,957.22 million (Rs. 26,655.73 million).Notes:a) The Segment revenue in the geographical segments considered for disclosure is as follows:- Revenue within India includes sales to customers located within India and earnings in India.- Revenue outside India includes sales to customers located outside India, earnings outside India.b) Segment revenue, results, assets and liabilities include the respective amounts identified to each of thesegments and amounts allocated on a reasonable basis.14. Taxationa) Current tax is determined as the amount of tax payable in respect of taxable income of the year computed as per IncomeTax Act, 1961.b) The components of deferred tax balances are as underParticulars(Rs. in million)31 March 20<strong>10</strong> 31 March <strong>2009</strong>Deferred Tax AssetsRetirement BenefitsOther Fiscal DisallowanceTotalDeferred Tax LiabilitiesFiscal allowance on fixed assetsOthersTotalDeferred Tax Liabilities (net)11.38<strong>10</strong>.2158.7733.4270.1543.633,049.882,4<strong>10</strong>.60(25.05)120.663,024.832,531.262,954.68 2,487.6315. Auditors' Remuneration includesParticulars 31 March 20<strong>10</strong>Audit FeesTax Audit FeesCertification and other feesOut of Pocket expenses3.500.752.750.11(Rs. in million)31 March <strong>2009</strong>2.800.500.720.0216. Prior period expense / incomeDetails of prior period income of Rs. Nil (Rs.166.27 million - net) is as under:Account HeadExpensesFinance ExpensesOthersIncomeExport and Excise IncentivesInterest IncomeOthersPrior Period (Income)/Expenses-(net)Total31 March 20<strong>10</strong>------(Rs. in million)31 March <strong>2009</strong>1.8<strong>10</strong>.20(126.80)(24.25)(17.23)(166.27)75
th15 <strong>Annual</strong> <strong>Report</strong> <strong>2009</strong>-<strong>10</strong>17. Operating LeaseThe Company leases office, residential facilities, equipment etc. under operating lease agreements that are renewable on aperiodic basis at the option of both the lessor and the lessee. The initial tenure of lease is generally for eleven months.(Rs. in million)ParticularsLease Rental charges for the yearFuture lease rental obligations payable (under non-cancelable leases)Not Later than one yearLater than one year but not later than five yearsLater than five yearsTotal31 March 20<strong>10</strong>99.7395.21374.6698.33568.2031 March <strong>2009</strong>62.6292.85366.19277.78736.8218. Related party disclosuresAs per Accounting Standard 18, the disclosure of transactions with related parties as defined in the Accounting Standard aregiven below: Particulars of Subsidiaries / Associates / Joint VenturesName of the SubsidiariesDirect Subsidiaries<strong>Welspun</strong> Pipes Limited<strong>Welspun</strong> Natural Resources Private Limited (holding increasedfrom 51% to <strong>10</strong>0% w.e.f. 30 March 20<strong>10</strong>)<strong>Welspun</strong> Pipes Inc<strong>Welspun</strong> Tradings Limited (Subsidiary w.e.f. 31 March 20<strong>10</strong>)<strong>Welspun</strong> Infratech Limited (Subsidiary w.e.f. 01 January 20<strong>10</strong>)<strong>Welspun</strong> Urja India Limited(Ceased to be Subsidiary w.e.f. 31March 20<strong>10</strong>)<strong>Welspun</strong> Steel Plates and Coil Mills Private Limited(Incorporated and sold during the year)Indirect SubsidiaryNature of BusinessCountry of Extent of HoldingIncorporation(%)Manufacturer of Steel Pipes India <strong>10</strong>0%Oil and Gas Exploration India <strong>10</strong>0%SPV for Steel Pipes Business USA <strong>10</strong>0%Trading Business of Pipes and Plates India 99.97%Infrastructure India <strong>10</strong>0%Energy and Solar Power Generation India 51%Manufacturer of Steel Plates and Coils India <strong>10</strong>0%Held through <strong>Welspun</strong> Pipes Inc.<strong>Welspun</strong> Tubular LLC<strong>Welspun</strong> Global Trade LLCHeld through <strong>Welspun</strong> Natural Resources Private Limited<strong>Welspun</strong> Plastics Private LimitedHeld through <strong>Welspun</strong> Plastics Private LimitedNirmal Plastic Industries (Partnership firm) (Dissolved w.e.f. 30March 20<strong>10</strong>)Manufacturer of Steel Pipes USA <strong>10</strong>0%Marketing Company USA <strong>10</strong>0%Oil and Gas Exploration India <strong>10</strong>0%Oil and Gas Exploration India 95%Associate CompaniesRed Lebondal Limited<strong>Welspun</strong> Energy Limited (w.e.f. 1 January 20<strong>10</strong>)Joint VenturesAdani <strong>Welspun</strong> Exploration Limited(Held through <strong>Welspun</strong> Natural Resources Private Limited)Dahej Infrastructure Private LimitedSPV for Steel Pipe Marketing Cyprus 25%Power Generation India 26%Oil and Gas Exploration India 35%Development of Jetty India 50%Other related parties with whom transactions have taken place during the year and balances outstanding as on the last day ofthe year. <strong>Welspun</strong> India Limited, <strong>Welspun</strong> Power and Steel Limited, <strong>Welspun</strong> Orissa Power and Steel Limited, <strong>Welspun</strong> RetailLimited, <strong>Welspun</strong> Anjar SEZ Limited, <strong>Welspun</strong> Foundation for Health and Knowledge, <strong>Welspun</strong> Syntex Limited, VipunaTrading Limited, <strong>Welspun</strong> Logistics Limited, <strong>Welspun</strong> Realty Private Limited, <strong>Welspun</strong> Enterprises (Cyprus) Limited, KrishirajTrading Limited, Remi Metals Gujarat Limited, <strong>Welspun</strong> Steel Plates and Coil Mills Private Limited, <strong>Welspun</strong> Maxsteel Limited76
C rp LtdDirectors /Key Management PersonnelName of the Related PartyNature of Relationship* Ceased to be director w.e.f 3 October <strong>2009</strong>.Disclosure in respect of transactions which are more than <strong>10</strong>% of the total Transactions of the same type with related partyduring the year:i. Sale of Goods/Services and Recoveries include from - <strong>Welspun</strong> Tradings Limited Rs. 21,909.58 million (Rs. 28,741.51million) (Refer Note 25), <strong>Welspun</strong> Tubular LLC Rs. 4,302.50 million (Rs. 2,730.75 million)ii.iii.iv.Sale of fixed assets include to - <strong>Welspun</strong> Tubular LLC Rs. 0.81 million (Rs.0.03 million), <strong>Welspun</strong> Power and Steel LimitedRs. 0.87 million (Rs.0.26 million), Remi Metals Gujarat Limited Rs. 1.63 million (Rs. Nil).Purchase of Goods and Services include from- <strong>Welspun</strong> Tubular LLC Rs. Nil (Rs. 151.04 million), <strong>Welspun</strong> Pipes Inc Rs. Nil(Rs. 603.29 million), <strong>Welspun</strong> Power and Steel Limited Rs. 48.25 million (Rs. 37.47 million), <strong>Welspun</strong> Logistics Limited Rs.17.93 million (Rs. 23 million), <strong>Welspun</strong> Global Trade LLC Rs. 13.82 million (Rs. Nil)Purchase of Fixed Assets includes from - <strong>Welspun</strong> Pipes Limited Rs. 1,074.59 million (Rs. Nil)v. Expenditure includes -Rent paid to - Vipuna Trading Limited Rs. 6.66 million (Rs. 6.62 million), <strong>Welspun</strong> Realty PrivateLimited Rs. 81.96 million (Rs. 47.51 million).vi.vii.Donation paid to - <strong>Welspun</strong> Foundation for Health and Knowledge Rs. 18 million (Rs. 24 million) (meant for corporatesocial responsibility activities).Interest Income includes - Interest received from <strong>Welspun</strong> Pipes Inc Rs. 204.09 million (Rs. 139.24 million).viii. Loans, Advances and Deposits includes given to - <strong>Welspun</strong> Pipes Inc Rs 1,843.22 million (Rs. 4,195.60 million) and repaidduring the year Rs. 6,<strong>10</strong>5.32 million, to <strong>Welspun</strong> Pipes Limited given and repaid Rs. Nil (Rs. 1,000 million).ix.Investment in Equity Shares of - <strong>Welspun</strong> Infratech Limited Rs. 1,000.85 million (Rs. Nil), <strong>Welspun</strong> Urja India Limited Rs.Nil (Rs. 0.26 million), <strong>Welspun</strong> Steel Plates and Coils Private Limited Rs. 0.<strong>10</strong> million (Rs. Nil).x. Sale of Investment in Equity Shares of - <strong>Welspun</strong> Urja India Limited of Rs. 0.26 million (Rs. Nil) to <strong>Welspun</strong> Energy Limited ,<strong>Welspun</strong> Steel Plates and Coils Private Limited Rs. 0.<strong>10</strong> million (Rs. Nil) to other related parties, Adani <strong>Welspun</strong>Exploration Limited Rs. Nil (Rs.2.96 million) to <strong>Welspun</strong> Natural Resources Limitedxi.xii.Share Application Money given includes to -<strong>Welspun</strong> Pipes Limited Rs.373 million (Rs. 1,288.95 million), <strong>Welspun</strong>Natural Resources Private Limited Rs. Nil (Rs. 172.50 million), <strong>Welspun</strong> Infratech Limited Rs. 778.35 million (Rs. Nil).Share Application Money given includes repaid by - Adani <strong>Welspun</strong> Exploration Limited Rs. Nil (Rs. 31.14 million),<strong>Welspun</strong> Natural Resources Private Limited Rs. 63.30 million (Rs. Nil).xiii. Issue of Equity Shares by exercise of employee stock option scheme (ESOP)- Whole Time Directors Rs. 14 million (Rs. 0.94million). Issue of Equity Shares by conversion of warrants to Krishiraj Trading Limited Rs. Nil (Rs. 886.90 million)xiv. Reimbursement of Expenses includes to <strong>Welspun</strong> India Limited Rs. 64.95 million (Rs. 68.93 million), <strong>Welspun</strong> Power andSteel Limited Rs. 8.68 million (Rs. 0.93 million), <strong>Welspun</strong> Anjar SEZ Limited Rs. Nil (Rs. 28.63 million).Disclosure of Closing balances as at 31 March 20<strong>10</strong>i. Loans, Advances and Deposits given include - <strong>Welspun</strong> Pipes Inc Rs. Nil (Rs. 4,762.58 million), <strong>Welspun</strong> Logistics LimitedRs. 52.40 million (Rs. 23.40 million), <strong>Welspun</strong> Realty Private Limited Rs.425.93 million (Rs. 467.60 million)ii.iii.iv.Sundry Debtors include - <strong>Welspun</strong> Tubular LLC Rs. 49.72 million (Rs. 1860.99 million), <strong>Welspun</strong> Tradings Limited Rs.1808.83 million (Rs. 169.02 million )Sundry Creditors include - <strong>Welspun</strong> India Limited Rs. Nil (Rs. 0.97 million), <strong>Welspun</strong> Anjar SEZ Limited Rs. 23.59 million(Rs. 28.62 million), Dahej Infrastructure Private Limited Rs. 2.86 million (Rs. Nil).Investments held include of - <strong>Welspun</strong> Pipes Inc Rs. 645.95 million (Rs. 645.95 million), <strong>Welspun</strong> Infratech Limited Rs.1,000.85 million (Rs. Nil).v. Share Application Money given to - <strong>Welspun</strong> Pipes Limited Rs. 1,300.48 million (Rs. 1,520.65 million), <strong>Welspun</strong> NaturalResources Private Limited Rs. 71.56 million (Rs. 174.86 million), <strong>Welspun</strong> Infratech Limited Rs. 779.85 million (Rs. Nil)vi.Guarantees and Collaterals provided include issued to - <strong>Welspun</strong> Pipes Inc Rs. 3,592 million (Rs. 4,057.60 million),<strong>Welspun</strong> Tradings Limited Rs. 1,609.80 million (Rs. 1,609.80 million).77
th15 <strong>Annual</strong> <strong>Report</strong> <strong>2009</strong>-<strong>10</strong>Note: Details of remuneration paid to Key Managerial Personnel are disclosed at Note 8 above.19. Earnings Per Share (EPS)ParticularsI) Profit computation for Basic and Diluted EPSProfit After Tax (Rs. In Million)Add: Interest on Foreign Currency Convertible Bonds (Net of Tax) (Rs. InMillion)Profit After Tax for Diluted EPS (Rs. In Million)II) Weighted average number of equity shares for EPS computationa) For Basic EPS (Nos)b) For Diluted EPS (Nos)III) EPS on Face Value of Rs. 5 eachBasic (Rs.)Diluted (Rs.)Year ended 31 March 20<strong>10</strong>5 ,401.9687.515 ,489.47192,638,617218,019,60428.0425.18Year ended 31 March <strong>2009</strong>2,335.68-2,335.68185,569,595186,864,12312.5912.5020. Disclosure pursuant to Clause 32 of the listing agreement :(Rs. in million)Particulars Balance as on 31 March Maximum amount outstanding duringthe year21. <strong>Welspun</strong> Infratech Limited (the “Acquirer”) a wholly owned subsidiary of the Company has entered into Share PurchaseAgreement with the existing promoters and other shareholders of MSK Projects (India) Limited. (a company engaged ininfrastructure development and listed on Bombay Stock Exchange, National Stock Exchange and Vadodara StockExchange) (the “Target Company”) to transfer 5,279,438 equity shares (23.13%) of the Target Company at a price of Rs.130.50 per share and also entered into a Share Subscription Agreement to subscribe to 17,178,888 equity shares of theTarget Company at an issue price of Rs. 123 per share and consequently has made a public announcement to the existingshareholders of the Target Company to acquire 20% of post preferential issue equity share capital of the Target Company ata price of Rs. 130.50 per share. Upon completion of the offer, assuming full acceptances in the offer, the Acquirer will hold30,458,326 equity shares (76.15%) and assuming Nil acceptances in the offer, the Acquirer will hold 22,458,326 equityshares (56.15%) of the post preferential issue equity share capital of the Target Company.22. Remittance in Foreign Currency on Account of DividendParticularsNumber of non - resident shareholders where direct remittances havebeen made by the CompanyNumber of shares on which dividend is remittedYear to which dividend relatesAmount remitted (Rs. in million)<strong>2009</strong>-<strong>10</strong>2822,423,6052008-<strong>2009</strong>33.642008-092922,425,0052007-200833.6423. Disclosure in respect of Joint VenturesIn compliance with Accounting Standard 27 on “Financial <strong>Report</strong>ing of Interest in Joint Ventures”, the Company's share ofeach of the assets, liabilities, income and expenses etc. in respect of jointly controlled entities are as follows:Name of Joint Venture78
C rp LtdFinancial interest (on the basis of audited accounts)Particulars(Rs. in million)24. The Board of the Company had approved the Scheme of Arrangement in the nature of demerger and transfer of Plateand Coil Mill Division of the Company to its then wholly owned subsidiary viz. <strong>Welspun</strong> Steel Plates and Coil Mills PrivateLimited (the “Scheme”). Due to change in the circumstances since then, in the opinion of the management, going aheadwith the Scheme would not be in the overall interest of the Company. Hence, it was decided not to pursue the Schemeand accordingly the scheme was withdrawn. The High Court of Gujarat vide its order dated <strong>10</strong> March 20<strong>10</strong> has given itsapproval to the withdrawal of Demerger Scheme filed u/s 391 to 394 of the Companies Act.25. The Company has been getting majority of the export orders and executing those orders through one of the related partywhich became its Subsidiary (w.e.f. 31 March 20<strong>10</strong>). The realization, income/ benefits, claims or expenses relating to suchtransactions are transferred/ paid immediately to the Company allowing it a small profit margin of about 0.5% of Sales.26. Sundry Creditors include an amount of Rs. 214.59 million being VAT collected on Sales. The Company has withheld theamount on account of its claim for set off against VAT incentive limit. If claim of the Company is not accepted, the amount willbe paid and contested in appeal.27. Sales is net off bad debts of Rs. 134 million.28. The members of the Company have approved change of name to "<strong>Welspun</strong> Corp Limited" and the Company has received thecertificate dated 27 April 20<strong>10</strong> towards change of name from Registrar of Companies, Gujarat.29. Previous year figures have been regrouped / rearranged / re casted wherever considered necessary to confirm to this year'sclassification. Figures in brackets pertain to previous year.30. Additional Information pursuant to Part II of Schedule VI of the Companies Act, 1956i) Licensed and Installed Capacity Licensed Installed1. Welded Pipes MT N.A 1,150,000 (1,150,000)2. Coating of Pipes '000 SQMS N.A 14,500 (14,500)3. M.S. Plate / H.R.Coils MT N.A 1,500,000 (1,500,000)4. Power (co-generation) KWH N.A 330,000 (330,000)ii) Production, purchase, sales and stocks:Opening Stock31 March 20<strong>10</strong> 31 March <strong>2009</strong>Qty Rs. in million Qty Rs. in millionWelded Pipes MT 57,675 2,983.63 34,901 1,571.04M.S. Plate MT 38,656 1,558.93 203 7.27Coating 000’SQMS 533 307.57 31 <strong>10</strong>.84Others - 36.98Production*4,850.13 1,626.13Welded Pipes MT 686,226 734,352M.S. Plate MT 383,577 192,569H.R. Coils MT 1,<strong>10</strong>1 -Coating 000’SQMS 5,036 688Power KWH 305,462 286,86779
th15 <strong>Annual</strong> <strong>Report</strong> <strong>2009</strong>-<strong>10</strong>31 March 20<strong>10</strong> 31 March <strong>2009</strong>Qty Rs. in million QtyRs. in millionSteam MT 1,516,196 1,366,281Transfer from Trial Run MT 1,590 -Purchase of Traded GoodsCoils MT 74,846 2,856.95 51,315 2,606.91Others 44.00 156.84Sales (Inclusive of excise duty)Welded Pipes MT 699,778 45,444.64 691,563 49,344.24M.S. Plate MT 308,952 15,122.38 42,073 3,298.32H.R. Coils MT 38 1.37 - -Coating 000’SQMS 4,486 1,759.68 186 203.08Power KWH 123,938 869.62 94,834 415.39Steam MT 271,768 383.45 290,701 466.88Trading Sales- Coils MT 74,846 3,890.<strong>10</strong> 51,315 2,860.07Others 262.18 - 159.98Equipment Sales 35.85 - 530.80Closing Stock67,769.27 57,278.77Welded Pipes MT 42,<strong>10</strong>8 1,237.88 57,675 2,983.63M.S. Plate MT 35,011 1,016.45 38,656 1,558.93H.R. Coils MT 2,653 78.20 - -Coating 000’SQMS 1,083 363.38 533 307.57Others 1.28 -Note *1) Production includes used for captive consumption2,697.19 4850.13(i) Welded Pipes MT 2,016 20,015(ii) M.S. Plate MT 78,270 112,043(iii) Power KWH 181,524 192,033(iv) Steam MT 1,244,428 1,075,5802) Production and Sales of welded pipes include 42,835 MT (Nil) and 41,218 MT (Nil) respectively done on job work basis3) Production of welded pipes include produced by third parties on job work basis – Nil (3,006 MT)4) Value of following materials consumed for power generation is included in Power, Fuel and Water chargesCoal MT 218,834 740.16 239,969Lignite MT 89,741 165.99 31,620iii) Raw Materials consumedH.R. CoilsMT489,62216,761.82557,504H.R. Plates *MT<strong>10</strong>6,<strong>10</strong>45,025.3097,921M.S. SlabsMT430,20914,305.31211,902Welding & Coating MaterialMT1,983.4338,075.86* Note: Does not include 87,277 MT (112,043 MT) consumed out of own productioniv) Raw Materials consumedImported%5621,342.3677Indigenous%4416,7 33.5023<strong>10</strong>038,075.86<strong>10</strong>0984.4559.0826,837.216,398.448,558.361,669.2143,463.2233,264.97<strong>10</strong>,198.2543,463.22v)Stores and Spares consumedImported%26415.1515151.57Indigenous%741,163.3385830.73<strong>10</strong>01,578.48<strong>10</strong>0982.3080
C rp Ltdvi)CIF Value of Importsa) Raw materialsb) Capital goodsc) Stores and Sparesd) Traded goods (Coils)e) Coal(Rs. in million)31 March 20<strong>10</strong> 31 March <strong>2009</strong>Rs.Rs.17,608.5237,488.551,147.641,169.73929.97727.073,223.072,736.75295.65875.21vii)Expenditure in Foreign Currencya) Travelling expenses3.194.72b) Freight charges/ Material handlingand transportation charges1,964.253,012.08c) Membership and other Fees3.471.20d) Commissione) Interest691.73757.60558.56665.79f) Professional and Consultancy(Including amount capitalized)250.39147.69g) Discounting & other Bank chargesh) Job work charges195.4324.40236.852,241.71i) Miscellaneous expenses5.8145.53viii) Earnings in Foreign Currencya) FOB value of Exportsb) Interest Incomec) Job work and other service charges22,190.57204.<strong>10</strong>669.4917,540.71203.202,504.50SIGNATURES TO SCHEDULES 1 TO 18As per our attached report of even dateFor and on behalf of the BoardFor MGB & Co.Chartered AccountantsB.K.GoenkaChairman and Managing DirectorM.L.MittalExecutive Director-FinanceMohan BhandariPartnerMumbai, 27 April 20<strong>10</strong>B.R.JajuChief Financial OfficerPradeep JoshiCompany Secretary81
th15 <strong>Annual</strong> <strong>Report</strong> <strong>2009</strong>-<strong>10</strong>Cash Flow Statement Annexed to the Balance Sheet for the year endedPARTICULARSCASH FLOW FROM OPERATING ACTIVITIESNet Profit before tax and exceptional itemsAdjustments for:Depreciation/AmortisationExchange Adjustments (Net)Employee stock option compensation (Net)Interest incomeDividend incomeProvision for doubtful Debts (Net)Provision for doubtful Advances (Net)Provision for diminution in value of Current / Long Term Investments(Profit)/Loss on sales/redemption of Current InvestmentsInterest expenseLoss on sale/discard of fixed assetsOperating Profit before working capital changesAdjustments for:Trade and other receivablesInventoriesTrade and other payblesCash used in operationsTaxes paid (net)NET CASH USED IN OPERATING ACTIVITIESCASH FLOW FROM INVESTING ACTIVITIESPurchase of fixed assets (including Capital Work in Progress)Sale of fixed assets (Net)Interest receivedDividend received(Increase)/decrease in Share Application money to Subsidiaries(Increase)/decrease in Share Application money to Joint Ventures/Associates(Increase)/decrease in Loans and Advances to SubsidiariesPurchase of Long Term investments-SubsidiariesPurchase of Long Term investments-AssociatesSale of Long Term investments-SubsidiariesSale of Long Term investments-Others(Purchase)/Sale of Current Investments (Net)NET CASH GENERATED FROM INVESTING ACTIVITIESCASH FLOW FROM FINANCING ACTIVITIESProceeds from issue of equity shares (Including Securities Premium) (Refer Note 3)Interest paidDividend paid (including corporate dividend tax)Proceeds from DebenturesRedemption of DebenturesProceeds from issue of FCCB (Gross)Proceeds from Long Term borrowingsRepayment of Long Term borrowingsIncrease/(decrease) in other borrowings (Net)NET CASH FROM FINANCING ACTIVITIES31 March 20<strong>10</strong> 31 March <strong>2009</strong>8,085.241,479.20(1,771.93)13.06(464.87)(91.52)(0.01)135.705.00(<strong>10</strong>.62)1,750.5645.489,175.30(2,073.76)<strong>10</strong>,193.48(17,315.82)(20.80)(1,835.20)(1,856.00)(3,594.68)3.41433.6491.52(456.38)(22.00)4,769.57(1,051.21)(0.13)0.360.01(20.12)153.994,694.65(1,740.28)(326.71)4,900.00(4,900.00)6,942.00-(7,425.19)(423.78)1,720.70(Rs. in million)3,536.081,254.191,413.1321.85(780.32)(70.73)(61.60)-1.06(68.62)1,996.915.117,247.07(42.24)(<strong>10</strong>,358.06)16,328.2113,174.98(551.99)12,622.99(3,001.71)11.18800.3370.73(1,458.41)23.64(4,234.49)(0.26)--2.962,251.16(5,534.86)4.93(1,876.00)(325.88)1,550.00(1,550.00)-5,385.86(2,089.03)(202.00)897.88NET INCREASE/(DECREASE) IN CASH AND CASH EQUIVALENTSCASH AND CASH EQUIVALENT - OPENING BALANCECASH AND CASH EQUIVALENT - CLOSING BALANCENotes:1. Cash and Cash equivalents at end of year includes unrealised loss of Rs. 146.27 million (Rs.1.07 million) being on account of Current Account/FixedDeposits in foreign currency.2. Cash and Bank balances include Rs. 624.60 million (Rs. 701.53 million) which is not available for use by the Company.3. Proceeds from equity shares includes Rs. 4,603.72 million (Net of issue expenses of Rs. 58.28 million) received from "Qualified Institutional Buyers"(QIBs) (Refer note 2 of Notes to Accounts)4. Previous year's figures have been regrouped/recast wherever necessary.18.699,193.719,212.407,986.001,207.719,193.71As per our attached report of even dateFor and on behalf of the BoardFor MGB & Co.Chartered AccountantsB.K.GoenkaChairman and Managing DirectorM.L.MittalExecutive Director-FinanceMohan BhandariPartnerMembership No. 12912Mumbai, 27 April 20<strong>10</strong>82B.R.JajuChief Financial OfficerPradeep JoshiCompany Secretary
C rp LtdBALANCE SHEET ABSTRACT AND GENERAL BUSINESS PROFILEI. REGISTRATION DETAILSREGISTRATION NO. 04-25609 STATE CODE 04BALANCE SHEET DATE 31.03.20<strong>10</strong>II. CAPITAL RAISED DURING THE PERIOD (Amount in Rs. thousands)PUBLIC ISSUE - RIGHT ISSUE -BONUS ISSUE - PRIVATE PLACEMENT 4,662,000III. POSITION OF MOBILISATION AND DEPLOYMENT OF FUNDS ( Amount in Rs. thousands)TOTAL LIABILITIES 50,207,288 TOTAL ASSETS 50,207,288SOURCES OF FUNDSAPPLICATION OF FUNDSPAID UP CAPITAL 1,021,612 NET FIXED ASSET 28,645,476RESERVES AND SURPLUS 26,365,998 (Including Capital Work in progress)SHARE APPLICATION MONEY - INVESTMENTS 2,796,140DEFERRED TAX BALANCES (NET) 2,954,679SECURED LOANS 12,971,121 NET CURRENT ASSETS 18,765,672UNSECURED LOANS 6,818,463 MISC. EXPENDITURE -FOREIGN CURRENCY MONETARY ITEMTRANSLATION ACCOUNT 75,415IV. PERFORMANCE OF THE COMPANY (Amount in Rs. Thousands)TURNOVER AND OTHER INCOME 66,267,092 TOTAL EXPENDITURE 58,181,850PROFIT BEFORE TAX 8,085,242 PROFIT AFTER TAX 5,401,961EARNING PER SHARE (Rs.) 28.04 DIVIDEND RATE 40%V. GENERIC NAMES OF THREE PRINCIPAL PRODUCTS OF THE COMPANY (AS PER MONETARY TERMS)ITEM CODE NO. (ITC CODE) 73 - 05PRODUCT DESCRIPTIONSTEEL PIPES AND TUBESITEM CODE NO. (ITC CODE) 72 - 08PRODUCT DESCRIPTIONSTEEL PLATESFor and on behalf of the BoardB.K.GoenkaChairman and Managing DirectorM.L.MittalExecutive Director-FinanceB.R.JajuChief Financial OfficerPradeep JoshiCompany Secretary83
th15 <strong>Annual</strong> <strong>Report</strong> <strong>2009</strong>-<strong>10</strong>84STATEMENT PURSUANT TO SECTION 212 OF THE COMPANIES ACT,1956, RELATED TO SUBSIDIARY COMPANIESWELSPUN NATURALRESOURCES PVT. LTD. $ WELSPUN PLASTICS LTD WELSPUN PIPES LTD WELSPUN PIPES INC WELSPUN TUBULAR LLC WELSPUN GLOBAL TRADE LLCNAME OF THE SUBSIDIARY COMPANYFINANCIAL YEAR OF THE SUBSIDIARY ENDED ON 31st March, 20<strong>10</strong> 31st March, 20<strong>10</strong> 31st March, 20<strong>10</strong> 31st March, 20<strong>10</strong> 31st March, 20<strong>10</strong> 31st March, 20<strong>10</strong>SHARES OF THE SUBSIDIARY COMPANY HELD ON THE ABOVE DATE ANDEXTENT OF HOLDING<strong>10</strong>,001 common stock of US$1 each50,000 equity shares of Rs.<strong>10</strong>each(i) Equity shares <strong>10</strong>,000 equity shares of Rs.<strong>10</strong>each(ii) Preference Stock 16,000 preference stock ofUS$ <strong>10</strong>00 each(ii) Extent of holding / Control <strong>10</strong>0% <strong>10</strong>0% <strong>10</strong>0% <strong>10</strong>0% <strong>10</strong>0% <strong>10</strong>0%Net aggregate amount of profit / (losses) of subsidiary for the above financialyear so far as they concern members of the Company(i) Dealt with in the accounts of the Company for the year ended31 March 20<strong>10</strong> (Rs.millions)(ii) Not dealt with in the accounts of the Company for the year ended - (0.29) - 52.28 1,262.45 26.3831 March 20<strong>10</strong> (Rs. millions)Net aggregate amount of profits / (Losses) for previous financial year thesubsidiary as far as it concern the members of the Company.(i) Dealt with in accounts of the Company.(ii) Not dealt with in the accounts of the Company. - 0.<strong>10</strong> - 1<strong>10</strong>.84 (156.98) 3.69WELSPUN INFRATECH LTD # WELSPUN TRADINGS LTD @31st March, 20<strong>10</strong> 31st March, 20<strong>10</strong>2,47,50,000 equity shares of Rs.<strong>10</strong> each50,12,002 equity shares of Rs. <strong>10</strong>each<strong>10</strong>0% 99.97%- 85.58- -$ Became <strong>10</strong>0% Subsidiary w.e.f 30 March 20<strong>10</strong># Became Subsidiary w.e.f 1 January 20<strong>10</strong>@ Became Subsidiary w.e.f 31 March 20<strong>10</strong>For and on behalf of the BoardPradeep JoshiCompany SecretaryB.R. JajuChief Financial OfficerM.L.MittalExecutive Director-FinanceB.K.GoenkaChairman and Managing Director
C rp LtdAuditors' <strong>Report</strong> on Consolidated Financial StatementsToThe Board of Directors<strong>Welspun</strong> Corp Limited ( Formerly <strong>Welspun</strong> Gujarat Stahl Rohren Limited)1) We have audited the attached Consolidated Balance Sheet of <strong>Welspun</strong> Corp Limited (“the Company”) and itssubsidiaries, associates and joint venture Companies (“the group”) as at 31 March 20<strong>10</strong>, the Consolidated Profit and Loss Accountfor the year ended on that date annexed thereto and the Consolidated Cash Flow statement for the year ended on that date. Thesefinancial statements are the responsibility of Company's management. Our responsibility is to express an opinion on thesefinancial statements based on our audit.2) We conducted our audit in accordance with the auditing standards generally accepted in India. Those Standards require that weplan and perform the audit to obtain reasonable assurance about whether the financial statements are free of materialmisstatement. An audit includes, examining on a test basis, evidence supporting the amounts and disclosures in the financialstatements. An audit also includes assessing the accounting principles used and significant estimates made by management, aswell as evaluating the overall financial statement presentation. We believe that our audit provides a reasonable basis for ouropinion.3) The financial statements of subsidiaries, with total assets of Rs. 31,767,596,999 as at 31 March 20<strong>10</strong> and total revenues of Rs.11,790,937,662 for the year ended on that date, have not been audited by us. These financial statements have been audited byother auditors whose reports have been furnished to us, and in our opinion, in so far as it relates to the amounts included inrespect of those subsidiaries, are based solely on the report of the other auditors.4) The financial statements of Red Lebondal Limited, Cyprus an associate have been consolidated based on the managementestimate and therefore unaudited. The profit/ (loss) of such associate considered for consolidation is Rs. Nil for the year.5) a) The financial statements of a joint venture namely Dahej Infrastructure Private Limited have been audited by other auditorwhose report has been furnished to us. The total assets and total revenues for consolidation are Rs. 2,626,905 and Rs.517,890 respectively. Our opinion in so far as relates to the amount included in respect of those joint ventures, is based solelyon the report of respective auditor.b) The financial statements of a joint venture namely Adani <strong>Welspun</strong> Exploration Limited have been consolidated based on themanagement estimate and therefore unaudited. The total assets and total revenues for consolidation are Rs. 1,223,535,929and Rs. Nil respectively6) a) We report that the consolidated financial statements have been prepared by the Company in accordance with therequirements of Accounting Standard (AS) 21, “Consolidated Financial Statements”, AS-23 “Accounting for investments inAssociates in Consolidated Financial Statements” and AS-27 “Financial <strong>Report</strong>ing of Interests in Joint Venture” issued by theInstitute of Chartered Accountants of India and on the basis of separate financial statements of the Company, its subsidiaries,associates and joint ventures .(b)Based on our audit and on consideration of the reports of the Company on separate financial statements of subsidiaries,associates and joint ventures, in our opinion and to the best of our information and according to the explanations given to us,the attached Consolidated Financial Statements give a true and fair view in conformity with the accounting principlesgenerally accepted in India.(i) In the case of the Consolidated Balance Sheet of the consolidated state of affairs of the group as at 31 March 20<strong>10</strong>.(ii)In the case of the Consolidated Profit and Loss Account of the consolidated results of operations of the group for the yearended on that date; and(iii) In the case of the Consolidated Cash Flow Statement of the consolidated cash flows of the group for the year ended onthat date.For MGB & Co.Chartered AccountantsFirm Registration No. : <strong>10</strong>1169WMohan BhandariPartnerMembership No. 12912Mumbai, 27 April 20<strong>10</strong>85
th15 <strong>Annual</strong> <strong>Report</strong> <strong>2009</strong>-<strong>10</strong>Consolidated Balance Sheet as at 31 March 20<strong>10</strong>(Rs. in million)ParticularsSchedulesAs at31-Mar-<strong>10</strong>As at31-Mar-09Sources of FundsShareholders' FundsShare Capital11,021.61932.46Reserves and Surplus227,989.5014,664.4429,011.1115,596.90Minority Interest0.060.40Foreign Currency Monetary Item Translation Difference Account(Refer Note <strong>10</strong>(ii))75.42-Loan FundsSecured Loans318,654.4326,434.65Unsecured Loans46,821.55<strong>10</strong>3.4125,475.9826,538.06Deferred Tax Liabilities (Net) (Refer Note 14(c))3,352.272,487.63Total57,914.8444,622.99Application of FundsFixed AssetsGross Block538,809.8034,843.63Less:Depreciation/Amortisation/Impairment5,888.903,847.22Net Block32,920.9030,996.41Capital Work-In-Progress (Refer Note 4(e))5,412.475,808.0338,333.3736,804.44Investments61,595.501,139.95Foreign Currency Monetary Item Translation Difference Account(Refer Note <strong>10</strong>(ii))-354.98Current Assets, Loans and AdvancesIncome Accrued on Investments13.41112.54Inventories720,321.7226,112.64Sundry Debtors88,077.<strong>10</strong>4,601.45Cash and Bank Balances917,028.169,470.34Loans and Advances<strong>10</strong>6,030.645,551.5251,471.0345,848.49Less : Current Liabilities and ProvisionsCurrent Liabilities1132,291.4438,954.88Provisions121,218.86600.5933,5<strong>10</strong>.3039,555.47Net Current Assets17,960.736,293.02Miscellaneous Expenditure (To the extent not w/off)Preliminary Expenses0.070.08Deferred Revenue Expenditure (Refer Note 18(b))25.1730.52Total57,914.84Significant Accounting Policies and Notes to Consolidated Accounts 18As per our attached report of even dateFor and on behalf of the Board44,622.99For MGB & Co.Chartered AccountantsMohan BhandariPartnerMumbai, 27 April 20<strong>10</strong>B.K.GoenkaChairman and Managing DirectorB.R.JajuChief Financial OfficerM.L.MittalExecutive Director-FinancePradeep JoshiCompany Secretary86
C rp LtdConsolidated Profit and Loss Account for the year ended 31 March 20<strong>10</strong>ParticularsSchedulesYear ended31-Mar-<strong>10</strong>(Rs. in million)Year ended31-Mar-09IncomeSales and Services (Gross)Less: Excise DutySales and Services (Net)Other IncomeExpenditureCost of GoodsManufacturing and Other ExpensesFinance Expenses (net)Depreciation/Amortisation/ImpairmentProfit Before TaxProvision For Taxation- Current Tax- Deferred Tax- Fringe Benefit TaxProfit After TaxMinority InterestShare of Loss of Associate CompanyNet Profit for the yearBalance Brought ForwardProfit Available for AppropriationAppropriations:General ReserveDebenture Redemption ReserveProposed Dividend on Equity SharesTax on above DividendDividend on Equity Shares for earlier periodTax on DividendBalance carried to Balance SheetEarnings Per Share (Face Value Rs. 5 each) (Refer Note 26)- Basic- DilutedTotalTotal13 76,287.70 59,708.952,784.97 2,313.6873,502.73 57,395.2714 185.34 186.9773,688.07 57,582.2415 47,484.18 40,032.6816 12,832.32 11,014.9117 2,070.90 1,766.342,060.61 1,432.7564,448.01 54,246.689,240.06 3,335.562,271.24 439.47864.64 749.75-11.186,<strong>10</strong>4.18 2,135.160.14 0.<strong>10</strong>0.016,<strong>10</strong>4.03 2,135.066,488.55 5,198.8012,592.58 7,333.86540.00 234.00<strong>10</strong>6.25 268.75408.64 279.7467.87 47.540.22 13.060.04 2.2211,469.56 6,488.5531.69 11.5128.40 11.43-Weighted average no. of Shares used in computingEarnings Per Share - Basic192,638,617 185,569,595- Diluted 218,019,604 186,864,123Significant Accounting Policies and Notes to Consolidated Accounts 18As per our attached report of even dateFor and on behalf of the BoardFor MGB & Co.Chartered AccountantsMohan BhandariPartnerMumbai, 27 April 20<strong>10</strong>B.K.GoenkaChairman and Managing DirectorB.R.JajuChief Financial OfficerM.L.MittalExecutive Director-FinancePradeep JoshiCompany Secretary87
th15 <strong>Annual</strong> <strong>Report</strong> <strong>2009</strong>-<strong>10</strong>Schedules Forming Part of Consolidated AccountsParticularsSchedule - 1 Share CapitalAuthorised304,000,000 (304,000,000) Equity Shares of Rs. 5 each98,000,000 (98,000,000) Preference Shares of Rs. <strong>10</strong> eachAs at31-Mar-<strong>10</strong>1,520.00980.00(Rs. in million)As at31-Mar-091,520.00980.002,500.002,500.00Issued, Subscribed and Paid Up (Refer Note 12(b) and 13)204, 322,4<strong>10</strong> (186,491,192) Equity Share of Rs. 5 each fully paid up1,021.61932.46Total(Out of the above, 8,120,000 Equity Shares of Rs. 5 each fully paid up are alloted for considerationother than cash, pursuant to the Scheme of Arrangement in the year 2004-05.)Schedule - 2 Reserves and SurplusCapital ReserveAs per last Balance SheetCapital Reserve on ConsolidationSecurities PremiumAs per last Balance SheetAdd/(Less): Received during the yearDiscount on issue of shares under Employees Stock Options Scheme (Refer Note 12(b))Premium payable on redemption of Foreign Currency Convertible Bonds (Refer Note 19(b))Utilised towards share issue expenses (Refer Note 13(b))Debenture Redemption ReserveAs per last Balance SheetAdd: Appropriated during the yearEmployees Stock Options OutstandingLess : Deferred employee compensationHedging Reserve Account (Refer Note <strong>10</strong>(iii)(b))Foreign Currency Translation ReserveGeneral ReserveAs per last Balance SheetAdd: Appropriated during the yearLess: Transferred to Fixed AssetsProfit and Loss Account **Total** Includes share of loss in Joint Ventures Rs. 50.45 Million (Rs 5.36 million)1,021.611,057.26153.097,7<strong>10</strong>.724,663.7630.40(15.62)(58.28)12,330.98537.50<strong>10</strong>6.25643.7525.05(0.70)24.35(31.86)1,075.76726.61540.001,266.6111,469.5627,989.50-932.461,057.266,860.93848.141.650.007,7<strong>10</strong>.72268.75268.75537.5060.03(18.35)41.68(2,004.20)<strong>10</strong>6.32501.96234.00(9.35)726.616,488.5514,664.44--88
Consolidated Profit and Loss Account for the year ended 31 March 20<strong>10</strong>ParticularsSchedule - 3 Secured Loans (Refer Note 20)DebenturesRedeemable Non Convertible DebenturesNon Convertible Bonds-City of Little Rocks, Arkansas, Series 2007-AAs at31-Mar-<strong>10</strong>3,000.00456.253,456.25C rp LtdAs at31-Mar-093,000.00532.193,532.19(Rs. in million)Term Loan from BanksIn Foreign CurrencyIn RupeeExternal Commercial BorrowingsWorking Capital From BanksIn Foreign CurrencyIn RupeeFinance Lease (Refer Note 15(i))3,762.892,782.376,545.266,789.99808.20808.205.9717,605.67-4,144.47<strong>10</strong>,537.8614,682.337,623.87303.83<strong>10</strong>0.00403.83<strong>10</strong>.4326,252.65Share in Joint VenturesTotal1,048.7618,654.43182.0026,434.65Schedule - 4 Unsecured LoansForeign Currency Convertible Bonds (Refer Note 19)Deferred Sales Tax Loan(Repayable In six equal annual instalments from Financial Year <strong>2009</strong> / 2015)Share in Joint VenturesTotalSchedule - 5 Fixed Assets - (at cost)6,735.0083.476,818.463.086,821.55-<strong>10</strong>3.41<strong>10</strong>3.41<strong>10</strong>3.41Gross Block Depreciation / Amortisation/Impairment Net BlockParticulars As atAdditions DeductionsAs at Up to For theDeductionsImpairment Upto As atAs at01.04.<strong>2009</strong> 31.03.20<strong>10</strong> 31.03.<strong>2009</strong> Year (see note 3) 31.03.20<strong>10</strong> 31.03.20<strong>10</strong> 31.03.<strong>2009</strong>a) Tangible AssetsLand774.49 704.6<strong>10</strong>.76 1,478.3511.71 51.38 --63.08 1,415.26 762.78Buildings6,548.500.13-6,548.63317.58 158.36 --475.94 6,072.69 6,230.92Plant and MachineryOffice and other EquipmentsVehiclesFurnitures and Fixtures26,768.67244.4945.7076.133,432.39171.58<strong>10</strong>.6635.42381.5714.990.802.9229,819.48401.0855.57<strong>10</strong>8.633,300.4182.6313.6627.441,693.4152.665.428.3735.423.170.411.78----4,958.40132.1318.6634.0324,861.08268.9636.9074.6023,468.25161.8532.0548.70b) Intangible AssetsGoodwillSoftwareTotal (A)Assets held for disposalTotal (B)<strong>10</strong>8.18225.5234,791.694.3434,796.030.008.074,362.874.134,366.99--401.04-401.04<strong>10</strong>8.18233.5938,753.518.4638,761.9882.228.123,843.77-3,843.7725.9744.502,040.07-2,040.07--40.78-40.78----<strong>10</strong>8.1852.625,843.05-5,843.05-180.9732,9<strong>10</strong>.468.4632,918.9225.97217.4030,947.924.3430,952.26Share of Joint Venture (C)TOTAL (A+B+C)Previous YearNotes:47.6034,843.6322,499.400.234,367.2212,668.45-401.04324.2247.8338,809.8034,843.633.453,847.222,405.770.242,040.311,444.861. Depreciation for the year includes Rs 21.86 million (Rs. 12.<strong>10</strong> million) transferred to Pre-operative expenses.2. Plant and Machinery includes Gross block of Rs 63.49 million (Rs.63.49 million) in respect of expenditure incurred on capital asset, ownership of whichdoes not vest with the Company.3. In accordance with the provisions of the Accounting Standard 28 on Impairment of Assets issued by the Institute of Chartered Accountants of India, theCompany has identified certain fixed assets in respect of a Joint Venture (Namely Dahej Infrastructure Private Limited) that were impaired duringthe year mainly on account of economic performance and viability of such assets which does not have any value in use. Accordingly an Impairment loss ofRs. 42.16 million has been recognised in the profit & loss account for the year.4. Deductions in gross block for the year includes Rs. 314.57 million on account of decapitalisation of foreign exchange as per amended AS 11.-40.783.4142.1642.1645.855,888.903,847.221.9832,920.9030,996.4144.1530,996.4189
th15 <strong>Annual</strong> <strong>Report</strong> <strong>2009</strong>-<strong>10</strong>Schedules Forming Part of Consolidated AccountsParticularsSchedule - 6 InvestmentsLong Term (at Cost)-UnquotedAssociatesRed Lebondal Limited (Extent of holding 25%)450 Equity shares of Euro 1 eachLess : Share of accumulated loss<strong>Welspun</strong> Energy Limited (Extent of holding 26%)13,000 (Nil) Equity Shares of Rs.<strong>10</strong> each fully paid upAdd : Unamortised GoodwillLess : Share of Loss for the yearOthersQuoted<strong>Welspun</strong> India LimitedNil (<strong>10</strong>0) Equity Shares of Rs. <strong>10</strong> each fully paid up<strong>Welspun</strong> Syntex Limited* Nil (25) Equity Shares of Rs. <strong>10</strong> each fully paid upUnquoted<strong>Welspun</strong> Enterprises (Cyprus) Limited11,800 Equity Shares of Euro 1 each fully paid up<strong>Welspun</strong> Power and Steel Limited* Nil (<strong>10</strong>0) Equity Shares of Rs. <strong>10</strong> each fully paid up<strong>Welspun</strong> Global Brands Limited* <strong>10</strong> (Nil) Equity Shares of Rs. <strong>10</strong> each fully paid up<strong>Welspun</strong> Investments Limited* 5 (Nil) Equity Shares of Rs. <strong>10</strong> each fully paid upWorli Realty Private Limited8% Nil (390) Non-Cumulative redeemable preference shares of Rs <strong>10</strong> eachAs at31-Mar-<strong>10</strong>0.03(0.03)0.000.1<strong>10</strong>.02(0.01)0.12--0.77-0.000.00-(Rs. in million)As at31-Mar-090.03(0.03)0.00----0.0<strong>10</strong>.000.770.00--0.39Current InvestmentsBonds - Quoted9.50% Delhi Transco Limited(4000 Bonds of Rs. <strong>10</strong>0,000 each)9.55% IFCI Limited 2025(279 Bonds of Rs. 1,000,000 each)<strong>10</strong>.80% Lakshmi Vilas Bank Limited(<strong>10</strong>8 Bonds of Rs. 1,000,000 each)9.75% West Bengal State Electricity Transmission Company Limited 2019(120 Bonds of Rs. 1,000,000 each)8.64% Tamil Nadu Electricity Board(200 Bonds of Rs. 1,000,000 each)11.45% Punjab Infrastructure Development Board(<strong>10</strong>18 Bonds of Rs. 1,000,000 each)<strong>10</strong>.25% Government of India(390 Bonds of Rs <strong>10</strong>0,000 each)Mutual FundLIC MF Liquid Fund -Dividend PlanNil (285,158.488 units of Rs. <strong>10</strong> each)Share in Joint VentureAll the above Shares and Securities are fully paid up* Denotes amount less than Rs.<strong>10</strong>,000Aggregate Book Value of Quoted InvestmentsAggregate Book Value of Unquoted InvestmentsAggregate Market Value of Quoted InvestmentsTotal398.55268.03<strong>10</strong>6.95124.08200.00---1,098.50497.001,595.501,097.60497.901,<strong>10</strong>4.06-----1,018.0047.813.131,070.1169.841,139.951,068.9571.001,167.6190
Schedules Forming Part of Consolidated AccountsParticularsSchedule - 7 Inventories(As taken, valued and certified by the management)Raw MaterialsStores and SparesFinished Goods*Work/Goods In ProcessGoods In TransitShare in Joint VenturesTotal* Includes Rs. 3,581.49 million taken over on acquisition of subsidiary (Refer note - 25)Schedule - 8 Sundry Debtors(Unsecured and considered good, unless otherwise stated)As at31-Mar-<strong>10</strong>5,762.431,130.616,652.551,476.845,299.2920,321.7220,321.72-C rp Ltd(Rs. in million)As at31-Mar-0911,931.78790.124,865.492,548.615,976.6526,112.6426,112.64-More than six months - considered good- considered doubtfulOthers - considered goodLess: Provision for doubtful debts868.2497.287,208.858,174.3797.28872.8097.293,728.654,698.7497.298,077.094,601.45Share in Joint VenturesTotal0.018,077.<strong>10</strong>-4,601.45Schedule - 9 Cash and Bank BalancesCash in handCheques in hand3.43-4.602.27Balance with Scheduled Banks- In Current Accounts *- In Margin Money Accounts- In Fixed Deposit Accounts2,878.19629.1113,473.995,031.78699.253,671.93Balance with Non Scheduled Banks- In Current Accounts -Banque Exterieure'd Algerie(Maximum Balance outstanding Rs. 72.52 million (Rs. 36.27 million)0.0011.11Share in Joint VenturesTotal16,984.7243.4417,028.169,420.9449.409,470.34* Includes Rs.1,676.22 million (Rs.2.28 million) being balance in unclaimeddividend accounts and Escrow Account not available for use by CompanySchedule - <strong>10</strong> Loans and Advances(Unsecured and considered good, unless otherwise stated)Advances(Recoverable in cash or in kind or for value to be received)Share Application Money - othersBalances with excise and customs authorities etc.Other AdvancesDepositsConsidered doubtfulLess: Provision for doubtful Advances/DepositsShare in Joint VenturesTotal22.002,994.162,320.43557.535,894.1279.005,815.12215.526,030.643,030.781,885.42568.235,484.430.005,484.4367.095,551.52-91
th15 <strong>Annual</strong> <strong>Report</strong> <strong>2009</strong>-<strong>10</strong>Schedules Forming Part of Consolidated AccountsParticularsAs at31-Mar-<strong>10</strong>As at31-Mar-09(Rs. in million)Schedule - 11 Current LiabilitiesAcceptancesSundry CreditorsTrade Advances and DepositsInterest accured but not dueUnclaimed Dividend *7,000.309,356.4115,516.47295.233.1131,706.024,637.912,184.27376.932.28Share in Joint Ventures* There is no amount due and outstanding to be credited to InvestorEducation and Protection Fund as at 31 March 20<strong>10</strong>Total32,171.52119.9232,291.4438,907.4147.4738,954.88Schedule - 12 ProvisionsFor Proposed Dividend (Including tax on proposed dividend)For Taxation (Net)For Retirement BenefitsShare in Joint Ventures476.51673.6368.251,218.390.47327.28242.9130.38600.570.02Total1,218.86600.59ParticularsYear ended31-Mar-<strong>10</strong>Year ended31-Mar-09Schedule - 13 Sales and ServicesSalesJob Work and other service chargesExport and Excise Benefits75,444.62533.80308.7655,890.572,509.871,308.18Share in Joint VenturesTotal76,287.180.5276,287.7059,708.620.3359,708.95Schedule - 14 Other IncomeDividend (Gross)Profit on Sale of InvestmentsMiscellaneous IncomeShare in Joint VenturesTotal91.64<strong>10</strong>.6283.08185.34-185.3470.8768.6247.48186.97-186.97Schedule - 15 Cost of Goods( A )Raw Materials consumedOpening StockPurchases (Net) *Less: Closing Stock(B) Purchases of Traded Goods(C) Increase/(Decrease) in StockClosing StockFinished GoodsWork/Goods In ProcessLess : Opening StockFinished GoodsTotal (A)Total (B)11,931.7838,420.2150,351.995,762.4344,589.56--3,071.061,476.844,547.904,865.496,094.6549,435.4355,530.0811,931.7843,598.30776.47776.474,865.492,548.617,414.<strong>10</strong>1,626.13Work/Goods In Process2,548.611,122.43Less: Increase/(Decrease) in Excise duty on Finished Goods7,414.<strong>10</strong>28.422,748.56323.45Total (C)(2,894.62)4,342.09Total (A)+(B)-(C)47,484.1840,032.68Share in Joint VenturesTotal47,484.18-40,032.68-* Includes transfer from Trial Run Rs. 40.05 million (Rs. Nil)92
C rp LtdSchedules Forming Part of Consolidated Accounts(Rs. in million)ParticularsYear ended31-Mar-<strong>10</strong>Year ended31-Mar-09Schedule - 16 Manufacturing and Other ExpensesStores and Spares consumedCoating and Other Job chargesPower, Fuel and Water chargesMaterial Handling and Transport chargesFreight expensesCommission and Discounts on salesDirectors' RemunerationSalary, Wages and AllowancesContribution to funds1,834.50172.671,681.571,356.341,316.92866.73<strong>10</strong>8.162,487.9461.40914.732,417.471,332.061,963.041,897.86676.6669.471,<strong>10</strong>4.1549.68Staff welfare expensesRentRates and TaxesRepairs and Maintenance- Plant and Machinery- Buildings- OthersTravelling and Conveyance expensesCommunication expensesProfessional and Consultancy feesInsuranceDirectors' sitting feesPrinting and StationarySecurity chargesMembership and SubscriptionVehicle expensesForeign Exchange difference (Net)121.11229.75313.02237.4926.2919.96181.9133.69571.85139.9<strong>10</strong>.5414.5424.<strong>10</strong>16.4921.09392.0798.7888.5261.8246.0116.0516.75149.8035.0178.0678.860.4012.3822.158.6521.01(387.25)Miscellaneous expensesAuditors' RemunerationSales Promotion expensesDiminution in value of Current InvestmentsLoss on sale / discard of fixed assetsProvision for doubtful Debts / Advances (Net)Bad debts and Advances written off388.537.1129.700.0050.4078.9944.<strong>10</strong>12,828.87258.524.0428.221.065.11(61.60)1.5811,009.03Share in Joint VenturesTotal3.4512,832.325.8811,014.91Schedule - 17 Finance Expenses (Net)Interest onDebenturesFixed LoansWorking CapitalOthers323.661,351.5712.24264.231,951.70337.431,430.69<strong>10</strong>8.04385.632,261.79Discounting and Other Charges377.682,329.38525.622,787.41Less: Interest received (Gross)258.481,021.072,070.901,766.34Share in Joint VenturesTotal0.002,070.900.001,766.3493
th15 <strong>Annual</strong> <strong>Report</strong> <strong>2009</strong>-<strong>10</strong>Schedule: 18 Significant Accounting Policies and Notes to Consolidated AccountsBackground<strong>Welspun</strong> Corp Limited (Formerly <strong>Welspun</strong> Gujarat Stahl Rohren Limited) (hereinafter referred to as “the Parent Company”, “theCompany”) together with its subsidiaries (collectively referred to as “Group”) are engaged in the business of Production and coating ofHigh grade Submerged Arc Welded Pipes, Hot Rolled Steel Plates and Coils, Infrastructure, Oil and Gas exploration, Energy and PowerGeneration.1. Basis of Consolidationa) The Consolidated Financial Statements (CFS) of group are prepared under the Historical Cost Convention on accrual basis inaccordance with the Generally Accepted Accounting Principles in India and Accounting Standard-21 on “ConsolidatedFinancial Statements” issued by the Institute of Chartered Accountants of India (ICAI), to the extent possible in the sameformat as that adopted by the Parent Company for its separate financial statements by regrouping, recasting or rearrangingfigures wherever considered necessary.b) The consolidation of the financial statements of the Parent Company and its subsidiaries is done on a line-by-line basis byadding together like items of assets, liabilities, income and expenses. All significant inter-group transactions, unrealizedinter-company profits and balances have been eliminated in the process of consolidation. Minority interest in subsidiariesrepresents the minority shareholders proportionate share of the net assets and net income.c) CFS is prepared using uniform accounting policies for transactions and other events in similar circumstances.d)The CFS includes the accounts of the Parent Company and its subsidiaries (as listed in the table below). Subsidiaries areconsolidated from the date on which effective control is acquired and are excluded from the date of transfer / disposal.Name of the SubsidiariesNature of BusinessCountry ofIncorporationExtent of HoldingDirect Subsidiaries<strong>Welspun</strong> Pipes Limited<strong>Welspun</strong> Natural Resources Private Limited (holdingincreased from 51% to <strong>10</strong>0% w.e.f. 30 March 20<strong>10</strong>)Manufacturer of SteelPipesOil and Gas ExplorationIndiaIndia<strong>10</strong>0%<strong>10</strong>0%<strong>Welspun</strong> Pipes Inc<strong>Welspun</strong> Tradings Limited (Subsidiary w.e.f. 31 March 20<strong>10</strong>)<strong>Welspun</strong> Infratech Limited (Subsidiary w.e.f. 01 January20<strong>10</strong>)SPV for Steel BusinessTrading Business ofPipes and PlatesInfrastructureUSAIndiaIndia<strong>10</strong>0%99.97%<strong>10</strong>0%<strong>Welspun</strong> Urja India Limited (Ceased to be Subsidiary w.e.f.31 March 20<strong>10</strong>)Energy and Solar PowerGenerationIndia51%<strong>Welspun</strong> Steel Plates and Coil Mills Private Limited(Incorporated and Sold during the year)Manufacturer of SteelPlates and CoilsIndia<strong>10</strong>0%Indirect SubsidiariesHeld through <strong>Welspun</strong> Pipes Inc.<strong>Welspun</strong> Tubular LLCManufacturer of SteelPipesUSA<strong>10</strong>0%<strong>Welspun</strong> Global Trade LLCMarketing CompanyUSA<strong>10</strong>0%Held through <strong>Welspun</strong> Natural Resources Private Limited<strong>Welspun</strong> Plastics Private LimitedOil and Gas ExplorationIndia<strong>10</strong>0%Held through <strong>Welspun</strong> Plastics Private LimitedNirmal Plastic Industries (Partnership firm) (Dissolved w.e.f.30 March 20<strong>10</strong>)Oil and Gas ExplorationIndia95%e) AssociatesThe Group has adopted and accounted for Investment in the following Associates using the “Equity Method” as per AS-23issued by the ICAI in this CFSName of the CompanyNature of Business Country of Incorporation Extent of HoldingRed Lebondal LimitedSPV for Steel PipeMarketingCyprus25%<strong>Welspun</strong> Energy Limited (w.e.f. 1 January 20<strong>10</strong>)Power GenerationIndia26%94
C rp Ltdf) Joint VenturesI. The Group has adopted and accounted for interest in the following Joint Ventures in this CFS, using the “ProportionateConsolidation Method” as per AS-27 issued by ICAI.II.III.No adjustment is made for the difference in accounting policy for providing depreciation under written down valuemethod. The written down value of such assets as at 31 March 20<strong>10</strong> is Rs. 1.22 million (Rs. 1.23 million).Name of the Enterprise Nature of Business Country of Incorporation Extent of HoldingAdani <strong>Welspun</strong> Exploration Limited(Held through <strong>Welspun</strong> NaturalResources Private Limited)Dahej Infrastructure Private LimitedOil and Gas Exploration India 35%Development of Jetty India 50%The Parent Company's share of capital commitments in the Joint Ventures as at 31 March 20<strong>10</strong> is Rs. 16.08 million (Rs.98.45 million)The Parent Company's share of contingent liabilities in the Joint Ventures as at 31 March 20<strong>10</strong> is Rs. Nil.IV. Contingent liabilities in the form of Corporate Guarantees of Rs. 287 million (Rs.280 million) have been incurred as at 31March 20<strong>10</strong> in relation to the Parent Company's interest in the Joint Venture along with other venturer.2. Use of EstimatesThe preparation of CFS in accordance with the generally accepted accounting principles requires the management to makeestimates and assumptions that affect the reported amounts of assets and liabilities, disclosure of contingent liabilities as of thedate of financial statements and the reported amount of revenue and expenses of the year. Actual results could differ from theseestimates. Any revision of such accounting estimate is recognized prospectively in current and future periods.3. Comparabilitya) Previous year figures have been regrouped, rearranged or recasted wherever necessary to confirm to this year'sclassification. Figures in brackets pertain to previous year.b) The CFS for the previous year does not include the financial statements of subsidiaries acquired during the year hence figuresof current year are not comparable.4. Fixed Assetsa) Fixed assets are stated at original cost of acquisition / installation (net of cenvat / credit availed) net off accumulateddepreciation, amortization and impairment losses except land which is carried at cost. The cost of fixed assets include cost ofacquisition, construction and installation, taxes, duties, freight, other incidental expenses related to the acquisition includingtrial run expenses (net of revenue) and borrowing cost incurred during Pre-operational period.b) Capital Work-In-Progress is stated at the amount expended upto the date of Balance Sheet including pre-operativeexpenditure and advances on capital account.c) Cost of Software includes license fees, cost of implementation and system integration and capitalized as intangible assets inthe year in which the relevant software is put to use.d) Goodwill arising out of acquisition is amortized over a period of three years from the year of acquisition.e) Capital Work in Progress, includes Capital Advances of Rs. 936.87 million (Rs. 439.85 million) and Pre-operative expensesRs.622.48 million (Rs. 586.60 million)f) Pre-operative Expenses (including accumulated borrowing costs of Rs.378.87 million) of Rs. 488.98 million (Rs. 1,373.01million) in respect of projects capitalized during the year have been allocated proportionately to the direct cost of respectivebuilding and plant and machinery.g) In case of a Joint venture, expenditure related to and incurred during the exploration period are included under “Capital WorkIn Progress” and in case of discovery, the same will be allocated/ transferred to the respective producing properties.However, in case there is no discovery, expenditure incurred for the exploration work will be charged to revenue.5. Borrowing Costsa) Borrowing costs attributable to the acquisition or construction of qualifying assets are capitalized as part of cost of suchassets. All other borrowing costs are charged to revenue.b) Borrowing costs (net) capitalized / allocated to fixed assets / Capital work in progress is Rs. 80.44 million (Rs. 571 million).95
th15 <strong>Annual</strong> <strong>Report</strong> <strong>2009</strong>-<strong>10</strong>6. Depreciationa) In case of parent, depreciation on fixed assets is provided on Straight Line basis at the rates prescribed in Schedule XIV to theCompanies Act, 1956 except for certain plant and machinery which are depreciated on the basis of estimated useful lives of13- 15 years. The rates of depreciation derived from these estimated useful lives are higher than those given in Schedule XIVto the Companies Act, 1956.b) In case of subsidiaries / Joint ventures depreciation is provided at the rates adopted in the accounts of respective subsidiaries/ Joint ventures as permissible under applicable local laws on straight line basis except in the case of a joint venturedepreciation is provided on Written Down Value Method the net book value of such assets as at 31 March 20<strong>10</strong> is Rs. 1.22million (Rs. 1.23 million).c) For determining the appropriate rate of depreciation on Plant and Machinery, continuous process plant has been identifiedon the basis of technical opinion by the Company/ Expert.d) Software is amortized over a period of five years from the date of its use based on management's estimate of useful life.7. InvestmentsInvestments intended to be held for more than a year, from the date of acquisition, are classified as long term and are carried atcost. Provision for diminution in value of investments is made to recognize a decline other than temporary. Current Investmentsare stated at cost or fair value which ever is lower.8. Revenue Recognitiona) Sale of goods is recognized when the risks and rewards of ownership are passed on to the customers, which is generally ondispatch. Export Sales are accounted for on the basis of date of bill of lading. Gross Sales include excise duty, value added taxincentive, quality claims, adjustments for price variation, liquidated damages, exchange rate variations related to exportrealization.b) Export benefits: Duty Entitlement Pass Book (DEPB) and Focus Market are accounted on accrual basis. Target plus /Duty FreeEntitlement Certificate scheme of EXIM policy are recognized when utilized.c) Revenue from Services is recognized when the services are completed.d) Dividend income is recognized when the right to receive the dividend is unconditional.9. InventoriesInventories are valued at lower of cost or net realizable value. The basis of determining cost for various categories of inventories isas follows:-(I) Raw Materials, Stores and Spares Moving weighted average basis.(II) Work / Goods in Process and Finished Goods- Cost of Direct Materials, Labour and other manufacturing expenses.<strong>10</strong>. (i) Foreign Currency TransactionsAccounting of Transactionsa) Foreign exchange transactions are converted into Indian Rupees at the prevailing rate on the date of the transactions. Currentmonetary assets and liabilities are translated at the exchange rate prevailing on the last day of the year. Non monetary itemsare carried at cost.b) Gains or losses arising out of remittance / translations at the year- end are credited / debited to the profit and loss account forthe year and where it relates to acquisition of fixed assets are adjusted to the carrying cost of such assets except treatment asper amendment to AS-11 (Refer note no <strong>10</strong> (ii)).c) Premium / discount on forward exchange contracts not relating to firm commitments or highly probable forecastedtransactions and not intended for trading or speculation purpose is amortized as income or expense over the life of thecontract.Translation and Exchange RatesFinancial statements of overseas non-integral operations are translated as under:a) Assets and Liabilities are translated at the exchange rate prevailing at the end of the year. Depreciation is accounted by takingsame rate at which assets are converted.b) Revenues and expenses at yearly average rates (except for inventories which are converted at opening / closing rates as thecase may be). Off Balance Sheet items are translated into Indian Rupees at year-end rates.c) Exchange differences arising on translation of non-integral foreign operations are accumulated in the Foreign CurrencyTranslation Reserve until the disposal of such operations.96
C rp Ltd(ii)Foreign Exchange Differencea) Loss on account of difference in foreign exchange on realignment/realization and on cancellation of derivativeinstruments amounting to Rs. 9.96 million (Rs. 3,355.99 million) is adjusted under respective heads of income orexpenses in the Profit and Loss account to which it relates and exchange difference gain of Rs. 3.12 million (Rs. 6.37million) other than (b) below, has been adjusted to the carrying cost of fixed assets/capital work in progress.b) The Companies (Accounting Standards) Amendment Rules <strong>2009</strong> has amended the provision of AS-11 related to "Theeffects of changes in Foreign Exchange Rates" vide notification dated 31 March <strong>2009</strong> issued by the Ministry of CorporateAffairs. Accordingly, the Company has adjusted exchange difference gain amounting to Rs. 348.36 million (Loss of Rs.616.20 million) to the cost of fixed assets and exchange difference gain of Rs. 93.76 million (Loss of Rs. 532.50 million) istransferred to "Foreign Currency Monetary Item Translation Difference Account" to be amortized over the balanceperiod of such long term assets / liabilities but not beyond 31 March 2011. Out of the above, gain of Rs 18.34 million (Lossof Rs.177.50 million) has been adjusted in the current year and gain of Rs. 75.42 million (Loss of Rs. 354.98 million) hasbeen carried over.(iii) Derivative Instruments and Hedge Accountinga) The Company uses foreign currency forward contracts to hedge its risk associated with foreign currency fluctuationsrelating to certain firm commitments and forecasted transactions. The Company designates these hedging instrumentsas cash flow hedges and applying the recognition and measurement principles set out in Accounting Standard 30“Financial Instruments: Recognition and Measurement” (AS 30). The gain or loss on the effective hedges is recorded in“Hedging Reserve Account” until the transaction is complete. The gain or loss is accounted in Profit and Loss Accountupon completion of the transaction or when the hedge instrument expires or terminates or ceases to qualify for hedgeaccounting.b) The Company has early adopted AS-30 and accordingly loss of Rs. 31.86 million (Rs. 2,004.20 million) related to foreignexchange difference on Cash Flow Hedges for certain firm commitments and forecasted transactions is recognized inShareholders' Funds and shown as Hedging Reserve Account.11. Employee BenefitsIn case of Parent Companya) Short term employee benefits are recognized as an expense at the undiscounted amount in the Profit and Loss account of theyear in which the related service is rendered.b) Post employment and other long term benefits are recognized as an expense in the profit and loss account of the year inwhich the employee has rendered services. The expense is recognized at the present value of the amounts payabledetermined using actuarial valuation techniques. Actuarial gains and losses in respect of post employment and other longtermbenefits are charged to the Profit and Loss account.c) Payments to defined contribution retirement benefit schemes are charged as expenses as and when they fall due.In case of Subsidiaries / Joint VenturesIn case of certain subsidiaries and a joint venture, liability in respect of leave encashment and gratuity is provided onestimated basis.12. Employees Stock Option Schemea) In respect of Employees Stock Option granted pursuant to the Company's Stock Option Scheme, the intrinsic value of theoptions (excess of market price of the share over the exercise price of the option) is treated as discount and accounted asemployee compensation cost over the vesting period.b) In respect of options granted under the Company's Employees Stock Option Scheme, in accordance with guidelines issued bySecurities and Exchange Board of India, the value of options (based on intrinsic value of the share on the date of the grant ofthe option) is accounted as deferred employee compensation, which is amortized on a straight line basis over the vestingperiod. Salaries, wages and allowances include Rs.13.06 million (Rs. 21.85 million) deferred employee compensation underEmployee Stock Options Scheme.During the year, 1,136,500 equity shares of Rs. 5 each fully paid up were issued at a price of Rs. 80 each, on exercise of optionsby employees. Discount allowed aggregating to Rs. 30.40 million (Rs. 1.65 million) in respect of shares allotted pursuant toStock Option Scheme is credited to Securities Premium Account as per guidelines of Securities and Exchange Board of India.97
th15 <strong>Annual</strong> <strong>Report</strong> <strong>2009</strong>-<strong>10</strong>Stock Options outstanding as at the year end are as follows:ParticularsGranted during 2006-07 Granted during 2007- 08Exercise PriceRs. 80 Rs. 94.<strong>10</strong>Date of Grant8 January 2007 24 April 2007Vesting period commences on8 January 2008 24 April 2008Options outstanding at the beginning of the period2,138,750 90,000Options granted during the year-- --Options exercised during the year1,136,500 NilOptions lapsed during the year<strong>10</strong>5,250 90,000Outstanding as at 31 March 20<strong>10</strong>897,000 NilGranted during <strong>2009</strong>-<strong>10</strong>Rs. 66.7520 April <strong>2009</strong>20 April 20<strong>10</strong>Nil47,500NilNil47,50013. Qualified Institutional Placement (QIP)a) The company has launched a Qualified Institutional Placement (QIP) on 24 November <strong>2009</strong> and raised equity fundsaggregating to Rs. 4,662 million by issuing 16,694,718 equity shares of face value of Rs. 5 each, at a premium of Rs. 274.25 perequity share to certain “Qualified Institutional Buyers” (QIBs) in accordance with the terms of chapter XIII-A of the SEBI (DIP)Guidelines.b)Share issue expenses related to QIP aggregating to Rs 58.28 million is adjusted against Securities Premium Account (SPA) asper Section 78 of the Companies Act 1956.14. Accounting for Taxes on Incomea) Current tax is determined as the amount of tax payable in respect of taxable income of the year.b) Deferred tax is recognized subject to consideration of prudence, on timing difference, being the difference between taxableincome and accounting income that originate in one period and are capable of reversal in one or more subsequent periodsand measured using prevailing enacted or substantively enacted tax rates.c) The components of deferred tax balances are as underParticulars 31 March 20<strong>10</strong> 31 March <strong>2009</strong>Deferred Tax AssetsRetirement BenefitsOther Fiscal DisallowanceTotalDeferred Tax LiabilitiesFiscal allowance on fixed assetsOthersTotalDeferred Tax Liabilities (net)15. (i) Finance LeaseLong-term leases, which in economic terms constitute investment finance on a long term basis (finance lease) are recognizedas assets. The initial tenure is three years. The minimum lease payments required under this finance lease that have initiallyor remaining non-cancellable lease terms in excess of one year as at 31 March 20<strong>10</strong> and its present value are as follows:(Rs. in million)Particulars11.3858.7770.153,049.88372.543,422 .423,352.27(Rs. in million)<strong>10</strong>.2133.4243.632,4<strong>10</strong>.60120.662,531.262,487.6331 March 20<strong>10</strong> 31 March <strong>2009</strong>(ii)Operating Leasea) Lease of assets under which all the risks and rewards of ownership are effectively retained by the lessor are classified asoperating leases. Lease payments under operating leases are recognized as an expense on accrual basis in accordancewith the respective lease agreements.98
) The Group leases office, residential facilities, equipment etc. under operating lease agreements that are renewable on aperiodic basis at the option of both the lessor and the lessee. The initial tenure of lease is generally for eleven months.(Rs. in million)16. Research and DevelopmentCapital expenditure on research and development is treated in the same manner as fixed assets. Revenue expenditure onresearch and development is charged to Profit and Loss Account.17. Impairment of AssetsAt each Balance Sheet date, the Company reviews the carrying amount of fixed assets to determine whether there is anyindication that those assets suffered impairment loss. If any such indication exists, the recoverable amount of the assets isestimated in order to determine the extent of impairment loss. The recoverable amount is higher of the net selling price and valuein use, determined by discounting the estimated future cash flows expected from the continuing use of the asset to their presentvalue.18. Miscellaneous Expenditurea) In case of an Indian Subsidiary, preliminary expenses are deferred and amortized over a period of five years.b) Expenditure other than (a) above comprising amortization of bond issuance cost deferred in case of a subsidiary is amortizedover the period over which the benefit accrues. Deferred Revenue expenditure balance as at 31 March 20<strong>10</strong> is Rs. 25.17million (Rs. 30.52 million)19. Foreign Currency Convertible Bonds (FCCB)a) During the year, the Company has raised US$ 150 million (Equivalent INR 6,942 million) by way of issue of 1,500, 4.5% ForeignCurrency Convertible Bonds (FCCB) of US$ <strong>10</strong>0,000 each. The Bondholders have an option to convert these bonds into24,0<strong>10</strong>,000 equity shares at an initial conversion price of Rs. 300 per share of Rs. 5 each fully paid up with a fixed rate ofexchange on conversion of Rs. 48.02= US$ 1 at any time on or after 26 November <strong>2009</strong> until <strong>10</strong> days prior to Maturity date (i.e.17 October 2014). Unless previously converted, redeemed or repurchased and cancelled, the Bonds will be redeemed on 17October 2014 at <strong>10</strong>2.8028% of the principal amount so as to give a gross yield of 5% per annum (calculated on semi annualbasis) to the Bond Holders.The Company has an option to redeem the Bonds at their Early Redemption Amount upon occurrence of events specified inthe Offering Circular issued by the Company for issue of the Bonds (“Offering Circular”). Further, the Company has the optionto mandatorily convert the Bonds after three years as specified in the Offering Circular.b) Premium payable on redemption of FCCB aggregating to Rs. 15.62 million has been adjusted against Securities PremiumAccount (SPA) as per Section 78 of the Companies Act,1956. In the event that the holders of FCCB exercise the conversionoption, the amount of premium utilized from SPA will be suitably adjusted in respective years.c) Part of the net proceeds received from the issue of FCCB have been utilized as per object of the issue viz for funding of Plate /Coil Mill and Pipe mill Capex Project. Pending utilization, the issue proceeds of USD 122.35 million (Equivalent INR 5,493.66million) have been invested in short term deposits with Banks abroad.20. Secured Loansa) (i) Redeemable Secured Non-Convertible Debentures (NCD)C rp LtdParticulars 31 March 20<strong>10</strong> 31 March <strong>2009</strong>Lease Rental charges for the year 230.49 85.56Future lease rental obligations payable (under non-cancellable leases)Not later than one year 116.11 <strong>10</strong>5.30Later than one year but not later than five years 436.73 414.06Later than five years 98.33 277.78Total 651.27 797.14ParticularsNo. ofDebentureFace Value(In Rs.)Date of AllotmentRedemption fromdate of allotmentInterest(p.a.)Amount (Rs. inmillion)99
th15 <strong>Annual</strong> <strong>Report</strong> <strong>2009</strong>-<strong>10</strong>The debentures together with interest are secured by first charge ranking pari passu by way of mortgage/hypothecationof entire immovable and movable fixed assets of the Company, both present and future and also secured bysecond/floating charge on current assets, subject to prior charge in favour of banks for working capital facilities.(ii) Non Convertible BondsNon Convertible Bonds of Rs. 456.25 million (Rs. 532.19 million) issued by the City of Little Rock / State of Arkansas aresecured by property, plant and equipment of a subsidiary.b) Term Loan from BanksI. In case of parent company Term Loans of Rs. 3,181.13 million (Rs. <strong>10</strong>,606.32 million) are secured by first charge rankingpari passu by way of mortgage / hypothecation of entire immovable and movable fixed assets of the Company bothpresent and future and also secured by second / floating charge on current assets subject to prior charge in favour ofbanks for working capital facilities.II.III.In case of subsidiaries, Term Loan aggregating to Rs. 3,364.13 million (Rs. 4,076.01 million) is secured by property, plantand equipment, secured by pledge of secured bonds issued by the city of Little Rocks in the name of the borrower andfurther secured by corporate guarantee of the Parent Company.In case of Joint Ventures, Term Loan aggregating to Rs. 1,048.76 million (Rs. 182 million) is secured by hypothecation ofinventories, other exploration equipment, current assets etc and further secured by corporate guarantee of the ParentCompany and other venturer.c) External Commercial Borrowings (ECB)ECB of Rs. 6,789.99 million (Rs. 7,623.87 million) is secured by first charge ranking pari passu by way ofmortgage/hypothecation on entire immovable and movable fixed assets of the Company both present and future. Furtherthe ECB is secured by exclusive charge by way of hypothecation of Debt Service Reserve Account.d) Working Capital facilitiesWorking Capital facilities from banks are secured by first charge by way of hypothecation of raw materials, finished goods andgoods in process, stores & spares and book debts of the Company and second charge on entire immovable and movable fixedassets of the Company both present and future of the Company.e) Finance LeaseIn case of subsidiaries, finance Lease is secured by way of charge on equipment.21. a) Contingent Liabilities not provided forParticulars 31 March 20<strong>10</strong>(Rs. in million)31 March <strong>2009</strong>Performance Guarantees /Bid Bond given by banks to company’s customers /government authorities etc.Corporate Guarantees givenLetters of Credit outstanding (net of liability provided) for company’s sourcingClaims against the Company not acknowledged as debtsCustom duty on pending export obligation against import of Raw Materials andMachineriesDisputed service tax /sales tax/ excise duty liabilities15,697.133,021.1415,840.2813.46561.3675.7513,648.352,822.854,769.1811.631,011.7692.37b) During the previous year one of the customer reported defect in the pipes supplied alleging grade of steel used did not meetthe specifications, the company replaced the defective pipes and also provided for the expected loss on this account. Duringthe year the said customer initiated legal action against the company in the United States of America claiming loss / damagesof $ 66 million on account of defects in the pipes supplied, consequently the company also initiated legal action against thesteel supplier claiming corresponding loss / damages it may suffer on account of this claim of the customer. Hence thecompany does not expect any liability on account of the claim against it.c) Estimated amount of contracts remaining to be executed on Capital account and not provided for Rs. 3,423.08 (Rs. 739.06million), net of advances.d) The details of Preoperative Expenses are as under:ParticularsExpenditure upto previous yearAdd : Expenditure incurred during the yearJob ChargesPower, Fuel and Water ChargesMaterial Handling and Transport ChargesSalaries, Wages and Allowances(Rs. in million)31 March 20<strong>10</strong> 31 March <strong>2009</strong>586.60 692.220.67 -0.67 0.78- 6.6331.45 381.42<strong>10</strong>0
C rp Ltd(Rs. in million)ParticularsStaff Welfare ExpensesRentRates and TaxesRepairs and Maintenance ExpenseTravelling and Conveyance Expenses (Directors Rs. NIL million (Rs. 4.50 million))Communication Expenses31 March 20<strong>10</strong> 31 March <strong>2009</strong>0.29 0.5617.12 23.533.43 0.550.32 1.541.73 28.600.17 7.46Professional and Consultancy Fees320.72 45.51Insurance5.14 13.59Vehicle Expenses0.54 1.48Security Expenses1.25 8.65Miscellaneous Expenses37.37 36.69Depreciation22.<strong>10</strong> 11.97Finance Expenses82.60 572.60Provision for Income Tax0.22 0.18Sub Total1,112.39 1,833.96Trial Run ExpensesRaw Material consumed54.75 -Stores and Spares consumed0.24 127.89Power, Fuel and Water Charges6.13 -Salary, Wages and Allowances0.41 -Selling and Distribution Expenses1.39 -Trial Run RecoveriesNet Sales(18.44) (0.54)Finished goods transferred to operation(40.05) -Net Loss4.43 127.35Less : IncomeInterest on Fixed Deposits(0.59) (0.92)Dividend received on units in mutual funds (Gross)(1.57) (0.68)Foreign Exchange Difference(3.12) (0.<strong>10</strong>)Miscellaneous Income(0.01) -Total1,111.53 1,959.61Less: Transfered on disposal of Subsidiary0.07 -Less : Amount allocated to Assets Capitalized during the year488.98 1,373.01Balance Carried to Balance Sheet 622.48 586.6022. Segment <strong>Report</strong>ingi) The Company is engaged in the business of steel products which in the opinion of the management is considered the onlybusiness segment in the context of Accounting Standard 17 on “Segment <strong>Report</strong>ing”.ii)Information about Secondary-Geographical SegmentsExternal SaleCarrying Amount ofSegment AssetsCapital Expenditure* includes deemed export Sales of Rs. 21,957.22 million (Rs. 26,655.73 million)Notes:India<strong>2009</strong>-<strong>10</strong>Outside India42,856.86* 30,645.8769,387.39 22,012.513,271.70 695.84a) Segment revenue in the geographical segments considered for disclosure is as follows:- Revenue within India includes sales to customers located within India and earnings in India.- Revenue outside India includes sales to customers located outside India, earnings outside India.b) Segment revenue, results, assets and liabilities include the respective amounts identified to eachof the segments and amounts allocated on a reasonable basis.2008-09Total India Outside India73,502.73 42,536.05 * 14,859.2291,399.90 62,804.89 20,987.953,967.54 6,675.56 5,087.51(Rs. in million)Total57,395.2783,792.8811,763.07<strong>10</strong>1
th15 <strong>Annual</strong> <strong>Report</strong> <strong>2009</strong>-<strong>10</strong>23. Prior Period Expense/IncomeDetails of Prior period income of Rs. Nil (Rs. 166.27 million)-(net) is as under:Account HeadExpensesFinance ExpensesOthersIncomeExport and Excise IncentivesInterest IncomeOthersPrior Period (Income)/Expenses -(net)Total31 March 20<strong>10</strong>------(Rs. in million)31 March <strong>2009</strong>1.8<strong>10</strong>.20(126.80)(24.25)(17.23)(166.27)24. Related Party Disclosurea) List of Parties where control exists: The list of Subsidiaries is disclosed in Note 1(d) above.b) Other related parties with whom transactions have taken place during the year and balances outstanding as on the last day ofthe year.(i) Joint VenturesAdani <strong>Welspun</strong> Exploration Limited, Dahej Infrastructure Private Limited.(ii) AssociatesRed Lebondal Limited and <strong>Welspun</strong> Energy Limited.(iii) Other Related Parties<strong>Welspun</strong> India Limited, <strong>Welspun</strong> Power and Steel Limited, <strong>Welspun</strong> Orissa Power and Steel Limited, <strong>Welspun</strong> RetailLimited, <strong>Welspun</strong> Anjar SEZ Limited, <strong>Welspun</strong> Foundation for Health and Knowledge, <strong>Welspun</strong> Syntex Limited, VipunaTrading Limited, <strong>Welspun</strong> Logistics Limited, <strong>Welspun</strong> Realty Private Limited, <strong>Welspun</strong> Enterprises (Cyprus) Limited,Krishiraj Trading Limited, Remi Metals Gujarat Limited, <strong>Welspun</strong> Steel Plates and Coil Mills Private Limited, <strong>Welspun</strong>Maxsteel Limited.Directors /Key Management PersonnelName of the Related PartyNature of Relationship* Ceased to be director w.e.f 3 October <strong>2009</strong>.Disclosure in respect of transactions which are more than <strong>10</strong>% of the total transactions of the same type with related partyduring the year1. Sale of Goods and Recoveries from include to - <strong>Welspun</strong> Tradings Limited Rs. 22,539.58 million (Rs. 30,036 million) (ReferNote 28).2. Sale of Fixed Assets include to- <strong>Welspun</strong> Power and Steel Limited Rs. 0.87 million (Rs. 0.26 million), Remi Metals GujaratLimited Rs. 1.63 millions ( Rs. Nil ).3. Purchase of Goods and Services include from- <strong>Welspun</strong> Power and Steel Limited Rs. 48.25 million (Rs. 37.47), <strong>Welspun</strong>Logistics Limited Rs. 17.93 million (Rs. 23 million), <strong>Welspun</strong> Retail Limited Rs. 1.06 million (Rs. 2.35 million), <strong>Welspun</strong>India Limited Rs. 2.06 million (Rs. 22.32 million).4. Purchase of Fixed Assets includes from - <strong>Welspun</strong> India Limited Rs. 1.24 million (Rs. Nil), <strong>Welspun</strong> Power and SteelLimited Rs.Nil (Rs. 0.04 million).5. Expenditure includes -Rent paid to- <strong>Welspun</strong> India Limited Rs. 2.23 million (Rs. 2.92 million), Vipuna Trading LimitedRs. 6.66 million (Rs. 6.62 million), <strong>Welspun</strong> Realty Private Limited Rs. 81.96 million (Rs. 47.51 million), <strong>Welspun</strong> Anjar SEZLimited Rs. 16.90 million (Rs. Nil).6. Donation to- <strong>Welspun</strong> Foundation for Health and Knowledge Rs. 18 million (Rs. 24 million) (meant for corporate socialresponsibility activities).7. Other Income includes- Rent received from Remi Metals Gujarat Limited Rs. 0.57 million (Rs. 0.13 million).<strong>10</strong>2
8. Loans, Advances and Deposits includes given to <strong>Welspun</strong> Logistics Limited Rs. 32 million (Rs. 128.78 million) and repaidduring the year Rs. 3.00 million (Rs. 196.70 million).9. Investment in Equity Shares of <strong>Welspun</strong> Energy Limited Rs. 0.13 Million (Rs. Nil).<strong>10</strong>. Sale of Investments of - <strong>Welspun</strong> Urja Limited Rs. 0.26 million (Rs. Nil) to <strong>Welspun</strong> Energy Limited, <strong>Welspun</strong> Steel Platesand Coil Private Limited Rs. 0.<strong>10</strong> million (Rs. Nil) to other related parties.11. Share Application Money includes - given to <strong>Welspun</strong> Energy Limited Rs. 22.00 million (Rs. Nil).C rp Ltd12. Issue of Equity Shares by exercise of employee stock option scheme (ESOP) to Whole Time Directors is Rs. 14.00 million(Rs. 0.94 million).13. Reimbursement of Expenses (Net) includes to <strong>Welspun</strong> India Limited Rs. 64.95 million (Rs. 68.93 million), <strong>Welspun</strong>Power and Steel Limited Rs. 8.68 million (Rs. 0.93 million), <strong>Welspun</strong> Anjar SEZ Limited Rs. Nil (Rs. 28.63 million).Disclosure of Closing balances as at 31 March 20<strong>10</strong>1. Loans, Advances and Deposits given include - <strong>Welspun</strong> Realty Private Limited Rs. 425.93 million (Rs. 467.60 million),<strong>Welspun</strong> Logistics Private Limited Rs. 52.40 million (Rs. 23.40 million).2. Sundry Debtors include- Remi Metals Gujarat Limited Rs. 14.66 million (Rs. 158.59 million), <strong>Welspun</strong> Tradings Limited Rs.Nil (Rs. 789.54 million).3. Sundry Creditors include -<strong>Welspun</strong> India Limited Rs. Nil million (Rs. 0.97 million), <strong>Welspun</strong> Anjar SEZ Limited Rs. 23.59million (Rs. 28.62), <strong>Welspun</strong> Logistics Limited Rs. Nil (Rs. 14.41 million).4. Investments held include of -<strong>Welspun</strong> Energy Limited Rs. 0.13 million (Rs. Nil), <strong>Welspun</strong> Enterprises (Cyprus) Limited Rs.0.77 million (Rs. 0.77 million).5. Share Application Money given to <strong>Welspun</strong> Energy limited Rs. 22 million (Nil).6. Guarantees and Collaterals provided include issued to- Red Lebondal Limited Rs. 628.60 million (Rs. 7<strong>10</strong>.08 million),<strong>Welspun</strong> Power and Steel Limited Rs. 222.97 million (Rs. 222.97 million), Adani <strong>Welspun</strong> Exploration Limited Rs. 287million (Rs. 280 million).25. On 31 March 20<strong>10</strong>, the Company has acquired 99.97% stake in <strong>Welspun</strong> Tradings Limited. Details of Net Assets acquired andconsideration paid are as follows:-Inventories(Rs. in million)3,580.43Trade Receivables1,488.33Loans and Advances937.<strong>10</strong>Cash and Cash Equivalents4,831.52Other current Liabilities(<strong>10</strong>,634.29)Net assets acquired203.09Cash consideration paid50.21Capital Reserve arising on acquisition of Rs. 152.88 million has been recognized in the consolidated financial statements.26. Earnings Per Share (EPS)ParticularsI) Profit computation for Basic and Diluted EPSNet Profit for the year (Rs. In Million)Add: Interest on Foreign Currency Convertible Bonds (Net of Tax) (Rs. InMillion)Profit After Tax for Diluted EPS (Rs. In Million)Year ended 31 March 20<strong>10</strong>6,<strong>10</strong>4.0387.516,191.54Year ended 31 March <strong>2009</strong>2,135.06-2,135.06II) Weighted average number of equity shares for EPS computationa) For Basic EPS (Nos)b) For Diluted EPS (Nos)192,638,617218,019,604185,569,595186,864,123III) EPS on Face Value of Rs. 5 eachBasic (Rs.)Diluted (Rs.)Rs.31.69Rs.28.40Rs. 11.51Rs. 11.43<strong>10</strong>3
th15 <strong>Annual</strong> <strong>Report</strong> <strong>2009</strong>-<strong>10</strong>27. The Board of the Company had approved the Scheme of Arrangement in the nature of demerger and transfer of Plate and Coil MillDivision of the Company to its then wholly owned subsidiary viz. <strong>Welspun</strong> Steel Plates and Coil Mills Private Limited (the“Scheme”). Due to change in the circumstances since then, in the opinion of the management, going ahead with the Schemewould not be in the overall interest of the Company. Hence, it was decided not to pursue the Scheme and accordingly the schemewas withdrawn. The High Court of Gujarat vide its order dated <strong>10</strong> March 20<strong>10</strong> has given its approval to the withdrawal ofDemerger Scheme filed u/s 391 to 394 of the Companies Act.28. The Company has been getting majority of the export orders and executing those orders through one of the related party whichbecame its Subsidiary (w.e.f. 31 March 20<strong>10</strong>). The realization, income/ benefits, claims or expenses relating to such transactionsare transferred/ paid immediately to the Company allowing it a small profit margin of about 0.5% of Sales.29. <strong>Welspun</strong> Infratech Limited (the “Acquirer”) a wholly owned subsidiary of the Company has entered in to Share PurchaseAgreement with the existing promoters and other shareholders of MSK Projects (India) Limited. (a company engaged ininfrastructure development and listed on Bombay Stock Exchange., National Stock of Exchange of India. and Vadodara StockExchange) (the “Target Company”) to transfer 5,279,438 equity shares (23.13%) of the Target Company at a price of Rs. 130.50 pershare and also entered into a Share Subscription Agreement to subscribe to 17,178,888 equity shares of the Target Company at anissue price of Rs. 123 per share and consequently has made a public announcement to the existing shareholders of the TargetCompany to acquire 20% of post preferential issue equity share capital of the Target Company at a price of Rs. 130.50 per share.Upon completion of the offer, assuming full acceptances in the offer, the Acquirer will hold 30,458,326 equity shares (76.15%) andassuming “Nil” acceptances in the offer, the Acquirer will hold 22,458,326 equity shares (56.15%) of the post preferential issueequity share capital of the Target Company.30. Sundry Creditors include an amount of Rs. 214.59 million being VAT collected on Sales. The Company has withheld the amount onits claim for set off against VAT incentive limit. If claim of the Company is not accepted, the amount will be paid and contested inappeal.31. Sales is net off bad debts of Rs. 134 million.32. The members of the Company have approved change of name to "<strong>Welspun</strong> Corp Limited" and the Company has received thecertificate dated 27 April 20<strong>10</strong> towards change of name from Registrar of Companies, Gujarat.SIGNATURES TO SCHEDULES 1 TO 18As per our attached report of even date For and on behalf of the BoardFor MGB & Co. B.K.GoenkaChartered Accountants Chairman and Managing DirectorM.L.MittalExecutive Director FinanceMohan BhandariPartnerB.R.JajuChief Financial OfficerPradeep JoshiCompany SecretaryMumbai, 27 April 20<strong>10</strong><strong>10</strong>4
C rp LtdConsolidated Cash Flow Statement Annexed To The Balance Sheet For The Year Ended(Rs. in million)PARTICULARS31 March 20<strong>10</strong> 31 March <strong>2009</strong>CASH FLOW FROM OPERATING ACTIVITIESNet Profit before tax and exceptional itemsAdjustments for:9,240.063,335.56Depreciation/Amortisation/ImpairmentExchange Adjustments (Net)Employee stock option compensation (Net)Interest incomeDividend incomeProvision for doubtful Debts (Net)Provision for doubtful Advances (Net)Provision for Diminution in value of Current Investments(Profit)/Loss on sales/redemption of Current Investments - NetInterest expenseLoss on sale/discard of fixed assetsOperating Profit before working capital changesAdjustments for:2,060.61(1,255.78)13.06(258.48)(91.64)(0.01)79.000.00(<strong>10</strong>.62)1,951.7050.4011,778.311,432.752,852.8521.85(1,021.07)(70.87)(61.60)0.001.06(68.62)2,261.795.118,688.81Trade and other receivablesInventoriesTrade and other payablesCash generated from operationsTaxes paid (Net)NET CASH GENERATED FROM OPERATING ACTIVITIES(1,960.68)9,372.42(13,528.56)5,661.48(1,840.53)3,820.95408.39(13,234.30)17,883.9613,746.86(552.05)13,194.81CASH FLOW FROM INVESTING ACTIVITIESPurchase of fixed assets (including Capital Work in Progress)Sale of fixed assetsInterest receivedDividend receivedPurchase of Long Term investments-SubsidiariesPurchase of Long Term investments-AssociatesSale of Long Term investments-SubsidiariesSale of Long Term investments-Others(Purchase)/Sale of Current Investments (Net)NET CASH USED IN INVESTING ACTIVITIES(3,783.32)8.45314.5791.64(50.31)(0.11)0.<strong>10</strong>0.39(444.15)(3,862.74)(<strong>10</strong>,707.68)17.311,004.0770.87-(0.39)--2,178.19(7,437.64)<strong>10</strong>5
th15 <strong>Annual</strong> <strong>Report</strong> <strong>2009</strong>-<strong>10</strong>Consolidated Cash Flow Statement Annexed To The Balance Sheet For The Year Ended(Rs. in million)PARTICULARS31 March 20<strong>10</strong> 31 March <strong>2009</strong>CASH FLOW FROM FINANCING ACTIVITIESProceeds from issue of equity shares (Including Securities Premium) (Refer Note 3)Interest paidDividend paid (including corporate dividend tax)Proceeds from DebenturesRedemption of DebenturesProceeds from issue of FCCBProceeds from Long Term borrowingsRepayment of Long Term borrowingsIncrease/(decrease) in other borrowings (Net)NET CASH FROM FINANCING ACTIVITIES4,694.65(2,033.41)(326.71)4,900.00(4,900.00)6,942.000.00(7,683.76)1,173.872,766.644.93(2,018.31)(325.88)1,550.00(1,550.00)0.005,385.86(2,089.03)51.991,009.57NET INCREASE/(DECREASE) IN CASH AND CASH EQUIVALENTSCASH AND CASH EQUIVALENT - OPENING BALANCECash and Cash Equivalent taken over on acquisition of SubsidiaryCASH AND CASH EQUIVALENT - CLOSING BALANCE2,724.859,470.344,832.9717,028.166,766.742,703.340.269,470.34Notes:1. Cash and Cash equivalents at end of year includes unrealised loss of Rs. 146.27 million (Rs. 1.07 million) being on account of fixeddeposits in foreign currency.2. Cash and Bank balances includes Rs. 1,676.22 million (Rs. 724.98 million) which is not available for use by the Company.3. Proceeds from equity shares includes Rs. 4,603.72 million (Net of issue expenses of Rs. 58.28 million) received from "QualifiedInstitutional Buyers" (QIBs) (Refer note 13 of Notes to Consolidated Accounts).4. Previous year's figures have been regrouped/recast wherever necessary.As per our attached report of even dateFor and on behalf of the BoardFor MGB & Co.Chartered AccountantsB.K.GoenkaChairman and Managing DirectorM.L.MittalExecutive Director-FinanceMohan BhandariPartnerMembership No: 12912Mumbai, 27 April 20<strong>10</strong>B.R.JajuChief Financial OfficerPradeep JoshiCompany Secretary<strong>10</strong>6
C rp LtdStatement pursuant to exemption received under Section 212 (8) of the Companies Act,1956, relating to Subsidiary Companies(Rs. in million)Sr.No Name of the Subsidiary Company<strong>Report</strong>ingCurrencyCapital andShareApplicationMoneyReserves Total Gross AssetsTotal GrossLiabilitiesInvestment otherthan Investmentin SubsidiaryTurnoverProfit/(Loss)before TaxationProvision forTaxationProfit/(Loss)after TaxationProposedDividendCountry1<strong>Welspun</strong> Natural Resources PrivateLtd.INR 71.66 - 14.17 5.47 62.96 - - - - - India2 <strong>Welspun</strong> Plastics Ltd INR 2.35 4.71 7.06 - - 0.12 (0.29) - (0.29) - India3 <strong>Welspun</strong> Pipes Inc # USD 718.85 76.53 354.57 5,572.42 6,013.23 - 52.28 - 52.28 - Delaware (U.S)4 <strong>Welspun</strong> Tubular LLC # USD - 1,122.89 15,603.89 14,481.00 - 11,246.64 1,715.04 452.59 1,262.45 - Delaware (U.S)5 <strong>Welspun</strong> Global Trade LLC # USD - 22.94 96.20 73.26 - 91.90 26.38 - 26.38 - Delaware (U.S)6 <strong>Welspun</strong> Pipes Limited INR 2,349.86 - 2,507.60 157.74 - - - - - - India7 <strong>Welspun</strong> Infratech Ltd. INR 1,027.35 753.35 1,791.92 11.22 - - - - - - India8 <strong>Welspun</strong> Tradings Ltd. INR 50.13 153.01 <strong>10</strong>,882.39 <strong>10</strong>,679.24 - 24,803.07 121.56 36.98 85.58 - India# the financial statements of the foreign subsidiaries have been converted into Indian Rupees at the 31st March 20<strong>10</strong> exchange rate. (US $ 1: Rs. 44.90)For and on behalf of the BoardB.K.GoenkaChairman and Managing DirectorM.L.MittalExecutive Director-FinanceB.R. JajuChief Financial OfficerPradeep JoshiCompany Secretary<strong>10</strong>7
th15 <strong>Annual</strong> <strong>Report</strong> <strong>2009</strong>-<strong>10</strong>FAQ SectionPipe Segment1. What is the current capacity in Pipes in India and US? Provide details as per the products? Whether the company is looking for anyfurther expansion plans?The Current Pipe Manufacturing Capacity is 1.5 mn MTPA as explained in page no. 34 which includes the US capacity of 0.35 mnMTPA. The New LSAW capacity of 0.35 mn MTPA and HSAW capacity of 0.20 mn MTPA is planned in India by <strong>FY</strong>2011. Proposedinvestment in the Middle East facility having HSAW capacity of 0.27 mn tonnes. The total capacity post expansion will be 2.27 mnMTPA.2. What is the Current Utilization level for the company in India and US pipe plants?The total Utilization levels in India and US facilties is around 55%. The capacity utilization depends on diameter and thickness ofthe pipes. The Current year has new capacity of 0.5 mn MTPA which typically takes 3 years to mature.3. What is the production and sales volume in pipes for <strong>FY</strong> <strong>10</strong>?The Production of Welded Pipes was 814 K MT in <strong>FY</strong> 20<strong>10</strong> and the sales volume of pipes was 816 K MT in <strong>FY</strong> <strong>10</strong>.4. How much was the US Production during the year? What was the Sales from the US Plant during the year?During the year the US plant has produced 130 K MT of Spiral Welded pipes. The Sales from the US Plant is US$ 250 mn during theyear.Plate cum Coil mill segment5. What is the production in the Plate Mill? What is total sale of plates during the year (External and Internal)?The company produced 384 K MT of Plates during the year. The total plate sale during the year was 387K MT, out of which 309 K MTis external sale and 78 K MT is internal consumption.6. What is the status of the coil mill?The Coil mill has been commissioned during the year and has started the trial production of coils. The Commercial production istargeted in <strong>FY</strong> 11.Order Book Position7. What is the current Order Book Position in Value? What is the percentage export and domestic breakup by volume?The combined order book position (for both pipes and Plates) of the company stands at Rs. 64,300 mn (as at 27th April 20<strong>10</strong>).8. Who are the Major Clients on the Order Book?• TCPL, Canada • Ruby, US • Quastar, US • Pine Gulf, Middle East• Enterprise, US • Saudi Aramco , Middle East • ETC Tiger, US • GAIL, India9. What are the key export markets for the company?The Key Export market for company is North America, South America, South East Asia, Africa and Middle East. The company has awell established sales network across the globe.<strong>10</strong>. What are the new markets the company is looking for?The new markets for the company are mainly CIS countries, some parts of Middle East and Africa. The company is also lookingforward to increasing its market share in these markets.11. How the company is looking towards the growing domestic market?The domestic market is growing at a good pace with an opportunity of over US$3.2 bn with Major oil & gas pipeline players like,GAIL (Gas Authority of India Ltd) , RGTIL (Reliance Gas Transportation India Ltd) and GSPL (Gujarat State Petronet Ltd) planing to layaround 13,066 km of pipelines over the next 3-4 years. <strong>Welspun</strong> is looking towards this huge opportunity in the domestic marketand started bidding for the recently announced projects. The company during the year has made a domestic sale of Rs. 20,900 mnout of the total sales of Rs 73,503 mn in <strong>FY</strong> <strong>10</strong>.<strong>10</strong>8
C rp Ltd12. Who are customers that the company has got accreditations from?The Company has got accreditations from over 50 Oil and Gas majors world wide. To list, some of them are:COMPANY NAMECOMPANY NAMECOMPANY NAMEAGIP GASCO, ABUDHABI QATAR PETROLEUMBECHTELGASCO, EGYPTRELIANCE INDUSTRIES LIMITEDBRITISH GASGAZPROM (STROYTRANSGAZ)SAIPEM, SNAMBRITISH PETROLEUMKINDER MORGANSAUDI ARAMCO (Framework Agreement)CHINA NATIONAL PETROLEUM CORPORATION MOGE, MYANMARSHELLCPMEC, CHINAN.A.O.C. - NIGERIASTOLT OFFSHORE – AcergyCHEVRON (Frame Agreement)NPCC, ABU DHABISONATRACHDOWNTPCTECHNIPRUBY (ELPASO)ONGCTOTALEGYPTIAN GENERAL PETROLEUM CORPORATION PETRO CHINATRANSCANADA (Long term contract)ENTERPRISEPETRONAS, MALAYSIA (PETROJET)UNOCALGOLDEN PASS PIPELINE LP (EXXON-MOBILE) PETROLEUM DEVELOPMENT OMAN LLC PERU LNG S.R.L. (HUNT OIL)GAILPGN, INDONESIAVIETSOPETRODebt / Inventory Position13. What is the net debt to networth ratio for the company?The Net Debt to Networth ratio for the company for <strong>FY</strong> <strong>10</strong> stands at 0.29 :1. This is calculated as [Gross Debt (-) Cash ]Shareholder's Equity (Share Capital + Reserves)].[Total14. What is the current gross and net debt position as at 31st March 20<strong>10</strong>?The Gross Debt (Secured & Unsecured) is Rs. 25,476 mn as at 31st March 20<strong>10</strong>. The Net Debt Position for the company is Rs. 8,448mn.15. What are the Inventory level of the Company? What is the Inventory turnover for the company during the year ?The Inventory as at 31st March 20<strong>10</strong> stands at Rs. 20,322 mn which is lesser by Rs. 5,791 mn as compared to the previous yeardespite increase in scale of operations, reflecting lower steel prices as compared with the previous year and better inventorymanagement. The Inventory turnover ratio stands at <strong>10</strong>1 days of Net sales during the year.Others16. What is the Outlook for future in terms of business opportunity?<strong>Welspun</strong> has firmly established itself as a credible supplier in the international market. It has set up its Plants at such strategiclocations in the coastal belt of the country from where the transportation cost of the manufactured pipes to the desireddestination is low. It has also proved its capability in venturing out of India with its new pipe mill at the Little Rock Arkansas US, witha Spiral Pipe capacity of 350 K MT and also has coating, double jointing and bending facilities. This provides a one stopsolutions to its customers locally in US and the neighboring areas. <strong>Welspun</strong> is also setting up the new LSAW pipe facilities in India of350 K MT in Anjar and 200 K MT in other parts of India to cater to demands in domestic as well as international market.17. What was the Equity dilution during the year on account of fund raising activities done by the company during the year? Howmuch fund was raised and what is the planned use of proceeds by the company?The Company has raised US $ 250 mn during the year with US $ 150 mn through FCCB (Foreign Currency Convertible Bonds)redeemable after 5 years and are convertible into equity shares at a conversion price of Rs. 300 per share and US$ <strong>10</strong>0 mn throughQIP (Qualified Institutional Placements). The Equity dilution is 16.69 mn shares added during the year on account of QIP taking thetotal outstanding shares to 204.32 mn as at 31st March 20<strong>10</strong>. These funds are being used for growth initiatives of the company.18. What is the planned CAPEX for the company for the further expansion plans?The Capex planned is about Rs. 700 crores for the new capacities in Anjar of 350 K MTPA LSAW plant, HSAW <strong>10</strong>0 K MTPA atMandya, near Bangalore and another HSAW plant of <strong>10</strong>0 K MTPA in Central India by end of <strong>FY</strong> 11.19. What are the strategic initiatives taken by the company?The Company has forayed into the Infrastructure Sector and Pipe laying for oil, gas and water by way of investment in MSK ProjectsIndia Ltd., through <strong>Welspun</strong> Infratech Ltd., a <strong>10</strong>0% subsidiary of <strong>Welspun</strong> Corp. Ltd. Also it has initialed agreements for investmentin a Middle East facility with HSAW capacity of 0.27 mn tonnes.<strong>10</strong>9
th15 <strong>Annual</strong> <strong>Report</strong> <strong>2009</strong>-<strong>10</strong>Glossary of Terms2B5LAPIbnCAGRCARECISCRISILCTCGDEBITDAECBERWEPSEIAFCCBFDIFSUGAILGSPLGSPCGDPGmBHHRCHSAWINRISOIEAJPYLIBORLLCLSAWmnMTMTPAMTOEMMSCMDNELPOCTGOECDOHSASONGCQQIPRGTILRBISAWTPAUKUSUS$VAIVATWCL<strong>Welspun</strong> Corp Ltd.Event Calendar <strong>FY</strong> 20<strong>10</strong>-2011Date Events/AnnouncementsWeek 30 of 20<strong>10</strong>Week Starting July 26Week 43 of 20<strong>10</strong>Week Starting Oct. 25Week 4 of 2011Week Starting Jan. 17Week 20 of 2011Week Starting May 16TubularLineAmerican Petroleum InstituteBillionCompounded <strong>Annual</strong> Growth RateCredit Analysis and Research LimitedCommonwealth of Independent StatesCredit Rating Information Services of India LimitedCasing and TubularCity Gas DistributionEarnings Before Interest Tax Depreciation and AmortizationExternal Commercial BorrowingElectric Resistant WeldedEarnings per ShareEnergy Information AdministrationForeign Currency Convertible BondsForeign Direct InvestmentFormer Soviet UnionGas Authority of India LimitedGujarat State Petroleum LimitedGujarat State Petroleum CorporationGross Domestic ProductGesellschaft mit beschränkter HaftungHot Rolling CoilHelical Submerged Arc WeldedIndian Rupee (Rs.)International Organization for StandardizationInternational Energy AgencyJapanese YenLondon Interbank Offered RateLimited Liability CompanyLongitudinal Submerged Arc WeldedMillionMetric TonnesMetric Tonnes Per AnnumMillion Tonnes of Oil EquivalentMillion Metric Standard Cubic Meter Per DayNew Exploratory Licensing policyOil Country Tubular GoodsOrganisation for Economic Co-operation and DevelopmentOccupational Health and Safety Advisory ServicesOil and Natural Gas CorporationQuarterQualified Institutional PlacementsReliance Gas Transportation Infrastructure Ltd.Reserve Bank of IndiaSubmerged Arc WeldedTonnes Per AnnumUnited KingdomUnited States of AmericaUS DollarVoest Alpine IndustriesValue added Tax<strong>Welspun</strong> Corp LimitedQ1 Board meeting and Results followed byInvestors / Analysts callQ2 Board meeting and Results followed byInvestors / Analysts callQ3 Board meeting and Results followed byInvestors / Analysts callQ4 Board meeting and Results followed byInvestors / Analysts call1<strong>10</strong>
YEAR AWARD/RECOGNITION BESTOWED BY20<strong>10</strong> Star Performer Award for the year 2008-09– All India Export Excellence AwardsEEPC 20<strong>10</strong>20<strong>10</strong> Top Indian Company under Metal Pipes Dun & Bradstreet<strong>2009</strong> National Awards for Export Excellence- Silver TrophyEngineering ExportPromotion Council- India2008 Most Valuable Company in Metal Pipes Dun & Bradstreet2008 Emerging Company of the Year Economic TimesCorporateExcellence Award2008 2nd Largest Steel Pipe Producer inthe World (Large Diameter)Financial Times (UK)
<strong>Welspun</strong> Corp Ltd. www.welspuncorp.comth<strong>Welspun</strong> House, 5 Floor, Kamala City, Senapati Bapat Marg, Lower Parel (West), Mumbai - 400013, INDIA.