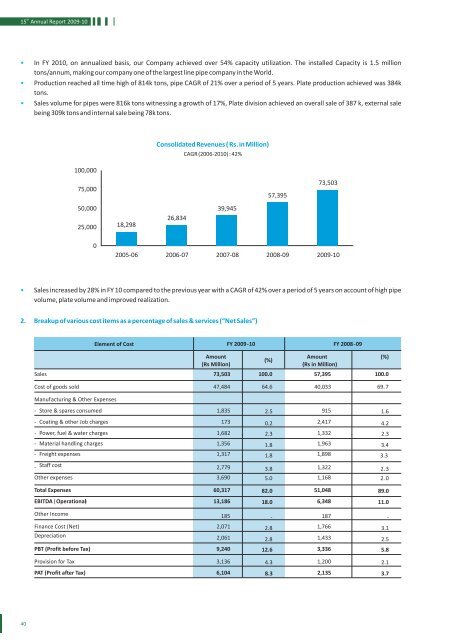
th15 <strong>Annual</strong> <strong>Report</strong> <strong>2009</strong>-<strong>10</strong>• In <strong>FY</strong> 20<strong>10</strong>, on annualized basis, our Company achieved over 54% capacity utilization. The installed Capacity is 1.5 milliontons/annum, making our company one of the largest line pipe company in the World.• Production reached all time high of 814k tons, pipe CAGR of 21% over a period of 5 years. Plate production achieved was 384ktons.• Sales volume for pipes were 816k tons witnessing a growth of 17%, Plate division achieved an overall sale of 387 k, external salebeing 309k tons and internal sale being 78k tons.Consolidated Revenues ( Rs. in Million)CAGR (2006-20<strong>10</strong>) : 42%<strong>10</strong>0,00075,00057,39573,50350,00025,00018,29826,83439,94502005-06 2006-07 2007-08 2008-09 <strong>2009</strong>-<strong>10</strong>• Sales increased by 28% in <strong>FY</strong> <strong>10</strong> compared to the previous year with a CAGR of 42% over a period of 5 years on account of high pipevolume, plate volume and improved realization.2. Breakup of various cost items as a percentage of sales & services (“Net Sales”)Element of Cost<strong>FY</strong> <strong>2009</strong>-<strong>10</strong> <strong>FY</strong> 2008-09SalesCost of goods soldAmount(Rs Million)(%)Amount(Rs in Million)73,503 <strong>10</strong>0.0 57,395<strong>10</strong>0.047,484 64.6 40,033 69.7(%)Manufacturing & Other Expenses- Store & spares consumed- Coating & other Job charges- Power, fuel & water charges- Material handling charges- Freight expenses- Staff costOther expenses1,835 2.5 915 1.6173 0.2 2,417 4.21,682 2.3 1,332 2.31,356 1.8 1,963 3.41,317 1.8 1,898 3.32,779 3.8 1,322 2. 33,690 5.0 1,168 2. 0Total ExpensesEBITDA ( Operational)60,317 82.013,186 18.051,048 89.06,348 11.0Other IncomeFinance Cost (Net)Depreciation185 - 187 -2,071 2.8 1,766 3.12,061 2.8 1,433 2.5PBT (Profit before Tax)9,240 12.63,336 5.8Provision for TaxPAT (Profit after Tax)3,136 4.3 1,200 2.16,<strong>10</strong>4 8.3 2,135 3.740
C rp LtdCost of goods sold as a percentage to Net Sales has decreased from 69.7% to 64.6% mainly on account of efficient raw materialmanagement. Operational cost increased mainly due to rise in power and fuel charges, staff costs and other expenses. Coating andother job charges have come down due to lower job work volume. Power, Fuel and Water Charges increased mainly due to higherenergy requirement for enhanced plate mill operations and part of the energy needs were served by 43 MW Captive Power Plant.Stores and Spares cost increased on account of commissioning of pipe capacities in India, USA and higher level of Plate mill operations.Freight Charges were lower due to better negotiations with the shipping companies and also due to direct dispatches from US facility.Staff Cost is higher due to additional employees for US facility, plate mill and the effect of capitalization in the previous year.Net Finance Cost is higher due to lower interest income and effect of higher interest capitalization in the previous year.Depreciation charges also increased due to increase in fixed Assets with the capitalization of Coil Mill at Anjar, and full period effect ofcapitalization of HSAW mill at Anjar and US Spiral Mill.3. MarginsOperating Margins: The EBITDA margin showed a growth of <strong>10</strong>8% at Rs. 13,186 million compared to the previous year at Rs. 6,348million. Previous year was impacted by extraordinary items like forex provisioning of Rs. 1,256 million on asset/ liability mismatch,Inventory write-down of Rs. 385 mn and forex provisioning on ECB of Rs. 178 million. The current year benefited with the reversalof forex provisioning. The EBITDA Margin for <strong>FY</strong> <strong>10</strong> stands at 17.9% as compared to 11.0 % in <strong>FY</strong> 09.PAT Margins: Profit after tax shows a growth of 186% and stands at Rs. 6,<strong>10</strong>4 million as compared to the <strong>FY</strong> 09 at Rs. 2,135 million(excluding the extraordinary items). The PAT Margin for the <strong>FY</strong> <strong>10</strong> stands at 8.3% as compared to 3.7% in <strong>FY</strong> 09.Table: Balance Sheet (Consolidated)(Rs. in Million)Sources of Funds As at 31 March 20<strong>10</strong> As at 31 March <strong>2009</strong> ChangeShareholder’s FundsShare Capital1,022933 89Reserves27,989 14,664 13,325Total29,01115,597 13,414Foreign Currency Monetary ItemTranslation Difference A/cLoan Funds7675Secured LoansUnsecured LoansTotal 25,47626,538 (1,062)Deferred Tax Liabilities (Net)TotalApplication of Funds18,6546,8223,35257,91526,435<strong>10</strong>3 6,7192,488(7,781)86444,623 13,292Net Block & Capital Work inProgress38,33336,804 1,529InvestmentsForeign Currency Monetary ItemTranslation Difference A/c1,596 1,140 456355 (355)Current Assets, Loans andAdvancesIncome Accrued on InvestmentsInventoriesSundry DebtorsCash and Bank BalancesLoans and Advances13 113 (<strong>10</strong>0)20,32226,113(5,791)8,077 4,601 3,47617,0289,470 7,5586,031 5,552 47951,47145,849 (5,622)41