
You also want an ePaper? Increase the reach of your titles
YUMPU automatically turns print PDFs into web optimized ePapers that Google loves.
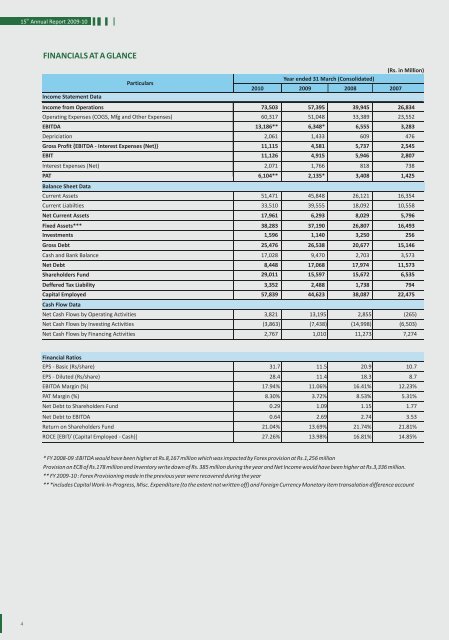
th15 <strong>Annual</strong> <strong>Report</strong> <strong>2009</strong>-<strong>10</strong>FINANCIALS AT A GLANCE(Rs. in Million)ParticularsYear ended 31 March (Consolidated)20<strong>10</strong> <strong>2009</strong> 2008 2007Income Statement DataIncome from Operations 73,503 57,395 39,945 26,834Operating Expenses (COGS, Mfg and Other Expenses) 60,317 51,048 33,389 23,552EBITDA 13,186** 6,348* 6,555 3,283Depriciation 2,061 1,433 609 476Gross Profit {EBITDA - Interest Expenses (Net)} 11,115 4,581 5,737 2,545EBIT 11,126 4,915 5,946 2,807Interest Expenses (Net) 2,071 1,766 818 738PAT 6,<strong>10</strong>4** 2,135* 3,408 1,425Balance Sheet DataCurrent Assets 51,471 45,848 26,121 16,354Current Liabilties 33,5<strong>10</strong> 39,555 18,092 <strong>10</strong>,558Net Current Assets 17,961 6,293 8,029 5,796Fixed Assets*** 38,283 37,190 26,807 16,493Investments 1,596 1,140 3,250 256Gross Debt 25,476 26,538 20,677 15,146Cash and Bank Balance 17,028 9,470 2,703 3,573Net Debt 8,448 17,068 17,974 11,573Shareholders Fund 29,011 15,597 15,672 6,535Deffered Tax Liability 3,352 2,488 1,738 794Capital Employed 57,839 44,623 38,087 22,475Cash Flow DataNet Cash Flows by Operating Activities 3,821 13,195 2,855 (265)Net Cash Flows by Investing Activities (3,863) (7,438) (14,998) (6,503)Net Cash Flows by Financing Activities 2,767 1,0<strong>10</strong> 11,273 7,274Financial RatiosEPS - Basic (Rs/share) 31.7 11.5 20.9 <strong>10</strong>.7EPS - Diluted (Rs/share) 28.4 11.4 18.3 8.7EBITDA Margin (%) 17.94% 11.06% 16.41% 12.23%PAT Margin (%) 8.30% 3.72% 8.53% 5.31%Net Debt to Shareholders Fund 0.29 1.09 1.15 1.77Net Debt to EBITDA 0.64 2.69 2.74 3.53Return on Shareholders Fund 21.04% 13.69% 21.74% 21.81%ROCE [EBIT/ (Capital Employed - Cash)] 27.26% 13.98% 16.81% 14.85%* <strong>FY</strong> 2008-09 :EBITDA would have been higher at Rs.8,167 million which was impacted by Forex provision at Rs.1,256 millionProvision on ECB of Rs.178 million and Inventory write down of Rs. 385 million during the year and Net Income would have been higher at Rs.3,336 million.** <strong>FY</strong> <strong>2009</strong>-<strong>10</strong> : Forex Provisioning made in the previous year were recovered during the year** *includes Capital Work-In-Progress, Misc. Expenditure (to the extent not written off) and Foreign Currency Monetary item transalation difference account4