Safety 2008 - ASSE - American Society of Safety Engineers
Safety 2008 - ASSE - American Society of Safety Engineers
Safety 2008 - ASSE - American Society of Safety Engineers

You also want an ePaper? Increase the reach of your titles
YUMPU automatically turns print PDFs into web optimized ePapers that Google loves.
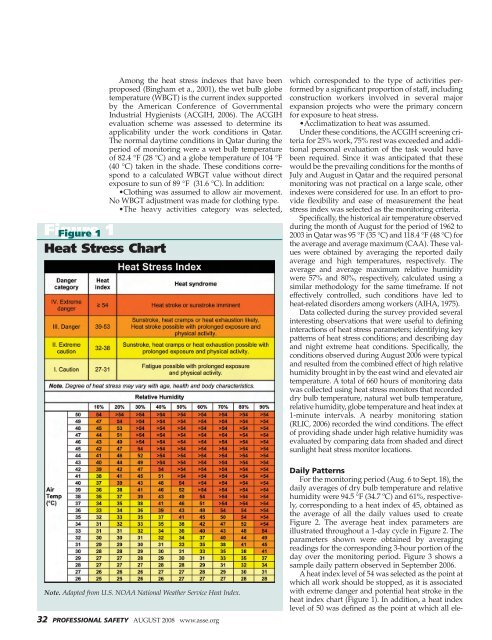
Figure 1Figure 1Heat Stress ChartAmong the heat stress indexes that have beenproposed (Bingham et a., 2001), the wet bulb globetemperature (WBGT) is the current index supportedby the <strong>American</strong> Conference <strong>of</strong> GovernmentalIndustrial Hygienists (ACGIH, 2006). The ACGIHevaluation scheme was assessed to determine itsapplicability under the work conditions in Qatar.The normal daytime conditions in Qatar during theperiod <strong>of</strong> monitoring were a wet bulb temperature<strong>of</strong> 82.4 °F (28 °C) and a globe temperature <strong>of</strong> 104 °F(40 °C) taken in the shade. These conditions correspondto a calculated WBGT value without directexposure to sun <strong>of</strong> 89 °F (31.6 °C). In addition:•Clothing was assumed to allow air movement.No WBGT adjustment was made for clothing type.•The heavy activities category was selected,which corresponded to the type <strong>of</strong> activities performedby a significant proportion <strong>of</strong> staff, includingconstruction workers involved in several majorexpansion projects who were the primary concernfor exposure to heat stress.•Acclimatization to heat was assumed.Under these conditions, the ACGIH screening criteriafor 25% work, 75% rest was exceeded and additionalpersonal evaluation <strong>of</strong> the task would havebeen required. Since it was anticipated that thesewould be the prevailing conditions for the months <strong>of</strong>July and August in Qatar and the required personalmonitoring was not practical on a large scale, otherindexes were considered for use. In an effort to provideflexibility and ease <strong>of</strong> measurement the heatstress index was selected as the monitoring criteria.Specifically, the historical air temperature observedduring the month <strong>of</strong> August for the period <strong>of</strong> 1962 to2003 in Qatar was 95 °F (35 °C) and 118.4 °F (48 °C) forthe average and average maximum (CAA). These valueswere obtained by averaging the reported dailyaverage and high temperatures, respectively. Theaverage and average maximum relative humiditywere 57% and 80%, respectively, calculated using asimilar methodology for the same timeframe. If noteffectively controlled, such conditions have led toheat-related disorders among workers (AIHA, 1975).Data collected during the survey provided severalinteresting observations that were useful to defininginteractions <strong>of</strong> heat stress parameters; identifying keypatterns <strong>of</strong> heat stress conditions; and describing dayand night extreme heat conditions. Specifically, theconditions observed during August 2006 were typicaland resulted from the combined effect <strong>of</strong> high relativehumidity brought in by the east wind and elevated airtemperature. A total <strong>of</strong> 660 hours <strong>of</strong> monitoring datawas collected using heat stress monitors that recordeddry bulb temperature, natural wet bulb temperature,relative humidity, globe temperature and heat index at1-minute intervals. A nearby monitoring station(RLIC, 2006) recorded the wind conditions. The effect<strong>of</strong> providing shade under high relative humidity wasevaluated by comparing data from shaded and directsunlight heat stress monitor locations.Note. Adapted from U.S. NOAA National Weather Service Heat Index.32 PROFESSIONAL SAFETY AUGUST <strong>2008</strong> www.asse.orgDaily PatternsFor the monitoring period (Aug. 6 to Sept. 18), thedaily averages <strong>of</strong> dry bulb temperature and relativehumidity were 94.5 °F (34.7 ºC) and 61%, respectively,corresponding to a heat index <strong>of</strong> 45, obtained asthe average <strong>of</strong> all the daily values used to createFigure 2. The average heat index parameters areillustrated throughout a 1-day cycle in Figure 2. Theparameters shown were obtained by averagingreadings for the corresponding 3-hour portion <strong>of</strong> theday over the monitoring period. Figure 3 shows asample daily pattern observed in September 2006.A heat index level <strong>of</strong> 54 was selected as the point atwhich all work should be stopped, as it is associatedwith extreme danger and potential heat stroke in theheat index chart (Figure 1). In addition, a heat indexlevel <strong>of</strong> 50 was defined as the point at which all ele-