Public Trust - Annual Report 2011 - Crown Ownership Monitoring Unit
Public Trust - Annual Report 2011 - Crown Ownership Monitoring Unit
Public Trust - Annual Report 2011 - Crown Ownership Monitoring Unit

You also want an ePaper? Increase the reach of your titles
YUMPU automatically turns print PDFs into web optimized ePapers that Google loves.
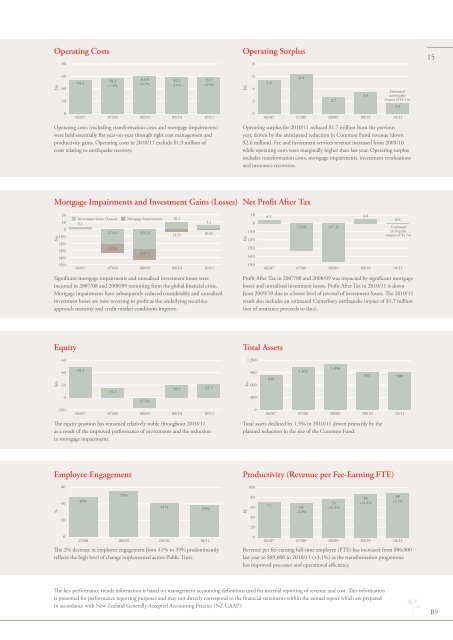
Operating Costs$m40200Operating costs (excluding transformation costs and mortgage impairments)were 20 held essentially flat year-on-year through tight cost management andproductivity 10 gains. Operating costs in 2010/11 exclude $1.9 million ofcosts 0 relating to earthquake recovery.-10-20-30-40-50Mortgage Impairments and Investment Gains (Losses)$mSignificant mortgage impairments and unrealised investment losses were60incurred in 2007/08 and 2008/09 stemming from the global financial crisis.Mortgage 40 impairments have subsequently reduced considerably and unrealisedinvestment losses are now reversing to profit as the underlying securities20approach maturity and credit market conditions improve.Equity$m806040200(10)(20)(30)(40)(50)0-2054.558.3+7.0%06/07 07/08 08/0909/10 10/11The 40 equity position has remained relatively stable throughout 2010/11as a result of the improved performance of investments and the reductionin 20mortgage impairments.020100604020060 (20)Investment Gains (Losses)3.1Employee Engagement61.0+4.7%59.2-3.0%59.7+0.9%06/07 07/08 08/0909/10 10/1149.2(21.6) (29.2)(12.4)15.2Mortgage Impairments(14.7)(17.0)10.1(3.5)20.15.1(0.8)21.706/07 07/08 08/0909/10 10/11Operating Surplus$mOperating surplus for 2010/11 reduced $1.7 million from the previousyear, 10 driven by the anticipated reduction in Common Fund revenue (down$2.6 0 million). Fee and investment services revenue increased from 2009/10while -10 operating costs were marginally higher than last year. Operating surplusexcludes-20transformation costs, mortgage impairments, investment revaluationsand insurance recoveries.-30Net Profit After Tax$mProfit After Tax in 2007/08 and 2008/09 was impacted by significant mortgage1200losses and unrealised investment losses. Profit After Tax in 2010/11 is downfrom 900 2009/10 due to a lower level of reversal of investment losses. The 2010/11result also includes an estimated Canterbury earthquake impact of $1.7 million600(net of insurance proceeds to date).300Total Assets$m420-40-501000864201,20090060030005.506/07 07/08 08/0909/10 10/118466.41,0221,096921 90806/07 07/08 08/0909/10 10/1180Total assets declined by 1.5% in 2010/11 driven primarily by the60planned reduction in the size of the Common Fund.40200100(10)(20)(30)(40)(50)4.1Productivity (Revenue per Fee-Earning FTE)2.73.5Estimatedearthquakeimpact of $1.1m(33.0) (47.2) Estimatedearthquakeimpact of $1.7m06/07 07/08 08/0909/10 10/114.81.80.61560100%402048%55%41%39%$k80604071 68-3.8%76+10.3%86+14.2%89+3.1%20007/08 08/0909/10 10/11The 2% decrease in employee engagement from 41% to 39% predominantlyreflects the high level of change implemented across <strong>Public</strong> <strong>Trust</strong>.006/07 07/08 08/0909/10 10/11Revenue per fee-earning full-time employee (FTE) has increased from $86,000last year to $89,000 in 2010/11 (+3.1%) as the transformation programmehas improved processes and operational efficiency.The key performance trends information is based on management accounting definitions used for internal reporting of revenue and cost. This informationis presented for performance reporting purposes and may not directly correspond to the financial statements within the annual report which are preparedin accordance with New Zealand Generally Accepted Accounting Practice (NZ GAAP).B9