Lab Exercise 5
Lab Exercise 5
Lab Exercise 5

You also want an ePaper? Increase the reach of your titles
YUMPU automatically turns print PDFs into web optimized ePapers that Google loves.
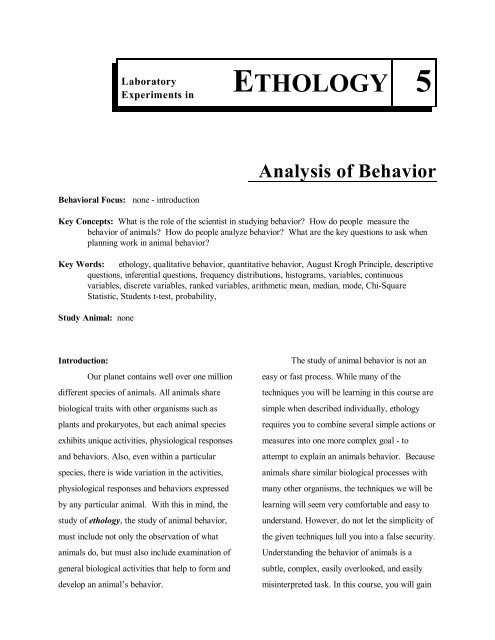
<strong>Lab</strong>oratoryETHOLOGY 5Experiments inBehavioral Focus: none - introductionAnalysis of BehaviorKey Concepts: What is the role of the scientist in studying behavior? How do people measure thebehavior of animals? How do people analyze behavior? What are the key questions to ask whenplanning work in animal behavior?Key Words: ethology, qualitative behavior, quantitative behavior, August Krogh Principle, descriptivequestions, inferential questions, frequency distributions, histograms, variables, continuousvariables, discrete variables, ranked variables, arithmetic mean, median, mode, Chi-SquareStatistic, Students t-test, probability,Study Animal: noneIntroduction:Our planet contains well over one milliondifferent species of animals. All animals sharebiological traits with other organisms such asplants and prokaryotes, but each animal speciesexhibits unique activities, physiological responsesand behaviors. Also, even within a particularspecies, there is wide variation in the activities,physiological responses and behaviors expressedby any particular animal. With this in mind, thestudy of ethology, the study of animal behavior,must include not only the observation of whatanimals do, but must also include examination ofgeneral biological activities that help to form anddevelop an animal’s behavior.The study of animal behavior is not aneasy or fast process. While many of thetechniques you will be learning in this course aresimple when described individually, ethologyrequires you to combine several simple actions ormeasures into one more complex goal - toattempt to explain an animals behavior. Becauseanimals share similar biological processes withmany other organisms, the techniques we will belearning will seem very comfortable and easy tounderstand. However, do not let the simplicity ofthe given techniques lull you into a false security.Understanding the behavior of animals is asubtle, complex, easily overlooked, and easilymisinterpreted task. In this course, you will gain
Ethology <strong>Lab</strong>oratory Manualfirst hand exposure to both the ample joys andthe daunting frustrations involved in the study ofanimal behavior.This first exercise does not directlyinvolve the examination of animals, but insteadprovides you with a framework upon which youwill be able to construct your own ideas, planyour own experiments, and focus your attentionon the types of data you will need to collect inyour study of animal behavior. Keep in mindthat the task you are undertaking requirespatience, thought, and planning. It is only aminor exaggeration that the most oft mutteredwords of the ethologist, whether he or she is anamateur or a professional are the following:“What the he%@ is going on,why aren’t the da}* animals doinganything?”To limit your need for speaking similar or evenmore robust sentiments under your own breath,the most important thing you can do as a newethologist is to carefully plan your actions priorto actual work with animals. The following arequestions you will want to think about prior tothe start of work:1. What information do I want tounderstand from these animals?2. What behavior(s) of these animals willhelp me find this information?3. How should I organize my experiment togather the needed information efficiently?4. What related activities of the animalsneed to be addressed prior to conductingthis experiment?Qualitative vs. Quantitative:There are two common research methodsused in the study of ethology. Both approacheshave tremendous value and are useful in theexamination of this science. However, both haveunique characteristics that help determine wheneach is more suitable.One method, qualitative analysis, seeksto understand the behavior of an animal indescriptive terms. Usually without the use of anynumerical analysis, qualitative ethology presentsan holistic view of an animal’s behavior. Thisform of ethology is typified by the descriptivetext written by Charles Darwin in his epic workOn the Origin of Species, and currently it is acommon approach taken by scientists who studyecological aspects of animal behavior in the wild.Qualitative ethology is especially useful when 1)the animal being examined is a new specieswhose behavior is unknown, 2) when the animalis exhibiting previously unobserved behaviors,and 3) when you wish to develop a narrativeexplanation of behavior.Occasionally you may hear someresearchers (unfortunately even some scientistscan be very short-sighted) say that the qualitativeapproach to ethology is old-fashioned and nolonger useful. However, this is far from the truth,2
<strong>Lab</strong>oratory 5 Analysis of Behaviorespecially for the new ethologist. Always keep inmind, the better you can explain and describebehavior of animals, the closer you can come tofully understanding and predicting their behavior.A second method for the study ofethology is quantitative analysis. Quantitativeanalysis is an experimental approach to ethology,for it seeks to manipulate one or more variablesabout the behavior of animals to collectnumerically analyzable data. These data can thenbe used to make concrete statements about howanimals behave. Quantitative analysis isconsidered the most useful method to learn aboutanimal behavior today, and it is different in manyways from qualitative analysis. One crucialdifference is the amount of work required of theresearcher prior to the observation of behavior.Quantitative analysis requires much forethoughtand planning before any work with animals cansuccessfully occur.Below are suggestions for observinganimals that may help you, theobserver/researcher in viewing and thinkingabout questions that might otherwise beoverlooked. However, keep in mind that themethods available for the observation of animalsare limited only by your imagination and theaccessability of animals. Hence, the following areonly guidelines. You may and should be able tocreate your own methods specific to the animalsyou plan to study.Legal, Ethical, and Safety Issues:The world today is very complex interms of the ethics, rules and regulationspertaining to the study of animals. Additionally,the study of certain animals can be quitedangerous to the observer (i.e.: study of blackbear hunting behavior). Therefore, for the safetyand welfare of all concerned - students ofbehavior, instructors, the animals, and othersassociated with the study animals - we must allbe alert to and familiar with the possible ethicaland safety issues concerning experiments we willconduct. For our class, the following guidelineswill help ensure good and safe learningexperiences:1. Be careful and cautious in your planningand organization of exercises in thiscourse.2. Keep the instructor informed of all usageof animals. Be sure to inform theinstructor of animal use especially foryour independent project and researchprogress.3. Realize that you, as an independentresearcher, are responsible forconducting all experimentation in a safeand careful manner.4. If any of your research calls for fieldwork on property outside of theuniversity, you need to obtain writtenpermission of the landowner orappropriate governmental agency priorto the start of any work.3
Ethology <strong>Lab</strong>oratory ManualHandling, Marking and Care of Animals:The handling and marking of animals isnot the simple task it may at first appear to be.You will be receiving ample instruction on theproper care and handling of animals during thelaboratory portion of this course. Additionally, ifit is relevant to the experiment, you will also beinstructed on the proper methods used to markanimals for future identification and on necessarylong-term care of animals. In your individualprojects, you will need to determine if there arespecialized handling, marking, and carerequirements for your animals. If you have anyquestions or concerns about your animals, do nothesitate to ask the instructor for additional help.Guidelines to Consider When Planning Your Independent Project:Of crucial importance to your independent project is the selection of the species to be studied. TheAugust Krogh Principle consists of guidelines that can help the ethologist to determine whatspecies is most useful, efficient, and cost-effective for a given study. The following guidelines arepresented in the form of questions you will wish to answer before the selection of an animal speciesfor your independent project:A. Is the animal species easily seen in its natural habitat or is it readily availablefor study in captive conditions? This suggests that you need a species that isabundant, and you must also be certain to accommodate any temporal aspects ofshipping or processing in the organization of your experiment.B. Is the selected type of animal one that is tolerant of human presence? Associatedideas with this question include: Can the animal be kept safely and easily incaptivity (if so desired)? Does the animal breed well in captivity? Does the animalneed a specialized diet? Is it a financially feasible animal for your study?C. What are the life-history characteristics of your selected species? Such traits asgestation time, age of sexual maturity, age of independence, and lifespan must bediscerned to make certain the planned study is feasible with a selected animal.4
<strong>Lab</strong>oratory 5 Analysis of Behaviordiscrete steps. For example, if we were toexamine the litter sizes produced in rats we mightobtain the following data:Rat No: 1 2 3 4 5Litter Size 5 8 6 9 7Since fractions of rats do not exist, we would notanticipate finding a measure of 8.34 rats. Thesetypes of variables are called discrete variables.Any count of something that cannot bereasonably divided are examples of discretevariables.Finally, other variables cannot bemeasured on a scale in which the intervals orunits have a consistent relationship to each other.However, these variables can be related to eachother in regards to overall magnitude. Whenvariables are of this type, they are referred to asranked variables. For example, the peckingorder seen in many bird societies is an exampleof ranked variables.Determining the type of variablescollected will help in their analysis. Prior toactual statistical analysis, additional insight canbe obtained through graphical representation ofcollected data.Histograms: Often ethology involves thecollection of large quantities of data. Taken as aseries of numbers, these data may be difficult toanalyze and interpret. For example, say thefollowing list represents the number of Planarianworms collected in 100, one meter square plots:Planarian Worms in Each One Meter Square Plot Sampled0 1 0 2 0 0 1 2 1 1 3 40 1 2 5 1 0 2 1 1 2 1 31 2 3 4 3 4 2 1 0 5 5 20 0 2 0 1 0 0 0 2 0 1 01 3 4 2 1 0 0 1 0 1 1 02 3 5 0 0 0 1 2 3 4 3 43 3 0 2 0 4 5 0 0 0 1 10 1 0 0 1 0 1 0 0 1 1 20 1 0 17
Ethology <strong>Lab</strong>oratory ManualClearly, the data obtained are rather cumbersometo discuss in the above form. If you scan the data,at first appearance there seem to be many plotshaving two or three plants each, but many alsocontain no Planarian worms at all. To beginanalysis of this data, it is advantageous to groupthe data into a frequency distribution. For thisexample, we would determine how many plots hadno Planarian worms, how many contained 1worm, how many contained 2, etc. In this way wecould tabulate the results in the manner shown inthe table below. This representation is moremeaningful:a given audience and is especially useful inresearch articles and poster presentations. Shownbelow is such a graph, which is referred to as ahistogram. In this case, the number of planarian isplotted along the “x” axis and the number of timesthe variable occurred (the frequency) is the “y”axis.Planarian Worms per Plot# of PlanarianWorms / PlotFrequency0 351 282 153 104 75 5With this compilation, we can easily see that 35plots contained no Planarian worms, 28 containedonly one and so on. An even more useful way torepresent frequency distributions is throughpresentation in the form of a bar graph. A bargraph makes information even more accessible toYou will have the chance to create your ownhistogram at the end of this exercise.Other Simple, Descriptive Statistics:Other simple ways to describe data are ones thatyou are likely familiar with already. But a briefreview will help to refresh these topics. Thearithmetic mean ( ) is the most common measureof central tendency in data that exist as continuousvariables. Also called simply the mean or the8
Ethology <strong>Lab</strong>oratory Manualgrey coated animals (using our initial 3:1hypothesis). Our question is, is this observeddiscrepancy too large to be simply attributed tochance (if it is too large, we could conclude thatour original expectation of a 3:1 ratio is incorrectand that coat color is inherited in a differentmanner)? To determine whether our datacorrespond to this initial hypothesis, we use theChi-Square Test, where we subtract eachobserved value from its expected value, square theresult, and divide this quantity by the expectedvalue. We then add together the results for eachcategory. Chi-Square is summarized in thefollowing formula:In our example we can compute the following...2observed expected (o - e) / e78 75 0.1222 25 0.36table you look across that level of freedom untilyou find a value that is just larger than ourcalculated value (in this case 2.706). Looking atthe top of this value on the chart, we see that thereis at least a 10% chance our difference is simplyby chance alone. Because most hypothesis areconsidered invalidated only if there is a 5% chanceor less the data observed is due to chance, we canconclude that we have no statistically relevantreason to reject our initial hypothesis that the ratioof coat color inheritance is 3:1.The Students t-Test:The t-test is a test of significance of thedifference between two population means. Aprerequisite of this form of statistical analysis isthat the data must exist as at least discretevariables (rank variables are not eligible for thistest). The t-test is conducted by calculating thevalue of t and comparing it with a table similar tothe Chi-Square Test above. To calculate the valueof t for this test, the formula is...2summation of X = 0.48Now we can consult a Chi-Square Critical ValuesTable. In problems using Chi-Square, we need todetermine the degrees of freedom present in ourdata. This degrees of freedom = the number ofgroups minus one (d.f. = n-1). In this case there isone degree of freedom and when you look at thewhere 1 and 2 are the sample means, n 1 and n2are the sample sizes, and s and s2 21 2are thesample variances. The degrees of freedom is givenby n 1 + n 2 - 2. The hypothesis is rejected if thecalculated value of t is equal to or greater than thetabulated value of t.10
<strong>Lab</strong>oratory 5 Analysis of BehaviorThe following example shows the use ofthe t-test statistic: Female voles were collectedfrom two locations and their total length weremeasured. Sample A had a mean length of 21.84mm, a variance of 4.2 mm , and n = 172. SampleB had a mean length of 23.45 mm, a variance of4.5 mm, and n = 135. We want to know if themean length of these two populations isstatistically different. In this case the hypothesiswe are testing is that the length of sample Aindividuals does not differ from sample Bindividuals. Substituting our variables into theequation we obtain...t = 6.7 ; d.f. = 305To find the tabular value of t, look in the tableprovided under alpha = 0.05 (or standardacceptance point of 5%). The table value is 1.960.Since our calculated value is far greater than this,we can reject our initial hypothesis that thepopulations are equal.Questions:1. If money, time, and all the hassles of life were no object, what type of behavior and in what type ofanimal(s) would you most like to study?11
Ethology <strong>Lab</strong>oratory Manual2. From your response to question #1 above, what type of analysis of behavior is your preferredstudy?3. Describe how the study you listed in question #1 fits into the real world using the guidelines of theAugust Krogh Principle. If the experiment fits in with the principle, how does it do so? If it doesnot, why does it not fit?4. What is one question you think would be feasible to answer about some aspect of animalbehavior.... given your lifestyle, time commitments, monetary constraints, and animal availability?What test animal would be a good choice for answering this type of question?5. From your answer in question #4 above, give an example of a continuous variable, discretevariable, and a ranked variable that could be examined.6. From data collected on the board, construct histograms of the height, age, and sex of individuals inthe class. Use the graph paper provided.12
<strong>Lab</strong>oratory 5 Analysis of Behavior7. Using the data provided earlier involving Planarian worms, conduct a Chi-Square Goodness of Fittest using the following criteria:Groups you wish to examine = # plots with no worms, # plots with 1 worm, # plots with 2 worms, #plots with 3 worms, # plots with 4 or more wormsExpected values (provided) = (# plots with no worms = 24.4), (#plots with 1 worm = 34.4), (#plotswith 2 worms = 24.3), (#plots with 3 worms = 11.4), and (#plots with 4 or more worms = 5.36)8. You have been given the fat metabolism rate (described as fmr units) for two populations of birds,one from the tropics and the other from the tundra. The population from the tropics had an hourlyfat metabolism of 7.3 fmr, and a variance of 0.68 fmr. The population from the tundra had a meanhourly fat metabolism of 11.5 fmr, and a variance of 0.72 fmr. The sample size of the tropicalpopulation was 120, whereas the sample size of the tundra population was 100. Conduct a t-teststatistical test on these data to support or reject the hypothesis that the hourly fat metabolism ratesof both populations are equal.13
Ethology <strong>Lab</strong>oratory ManualSources of Additional Information:Alcock, J. 1993. Animal Behavior. Sinaer Associates: Sunderland, Massachusetts. 625 pp.Darwin, C. 1964 (a facsimile of the first edition). On the Origin of Species. Harvard University Press:Cambridge, Massachusetts. 518 pp.Hampton, R. E. 1994. Introductory Biological Statistics. William C. BrownPublishers:Dubuque, Iowa. 233 pp.Woolf, C.M. 1968. Principles of Biometry. D.Van Nostrand Company Inc.: Princeton, New Jersey. 359 pp.14