suggested answers for homework 2
suggested answers for homework 2
suggested answers for homework 2
- No tags were found...
Create successful ePaper yourself
Turn your PDF publications into a flip-book with our unique Google optimized e-Paper software.
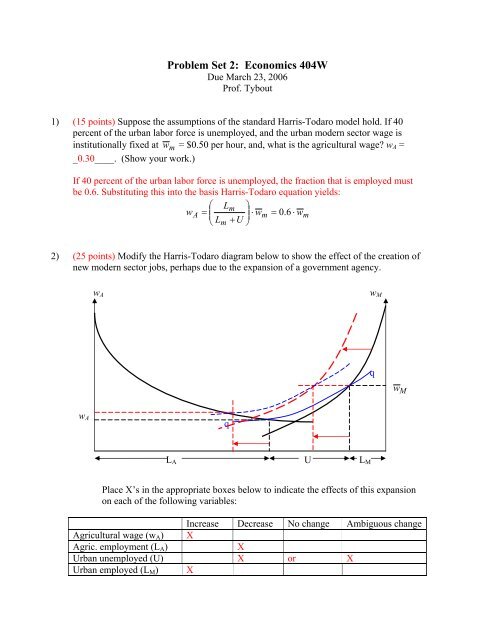
Problem Set 2: Economics 404WDue March 23, 2006Prof. Tybout1) (15 points) Suppose the assumptions of the standard Harris-Todaro model hold. If 40percent of the urban labor <strong>for</strong>ce is unemployed, and the urban modern sector wage isinstitutionally fixed at w m = $0.50 per hour, and, what is the agricultural wage? w A =_0.30____. (Show your work.)If 40 percent of the urban labor <strong>for</strong>ce is unemployed, the fraction that is employed mustbe 0.6. Substituting this into the basis Harris-Todaro equation yields:⎛ Lm⎞wA= ⎜ ⋅ wm= ⋅ wmLmU⎟ 0 . 6⎝ + ⎠2) (25 points) Modify the Harris-Todaro diagram below to show the effect of the creation ofnew modern sector jobs, perhaps due to the expansion of a government agency.w Aw Mqw Mw AqL AUL MPlace X’s in the appropriate boxes below to indicate the effects of this expansionon each of the following variables:Increase Decrease No change Ambiguous changeAgricultural wage (w A ) XAgric. employment (L A )XUrban unemployed (U) X or XUrban employed (L M ) X
3) (20 points) The diagram below represents a couple’s choice of family size (number ofchildren), given its budget constraint: Q = w(L − λ ⋅ n)+ π − d ⋅ nConsumption (Q)•Children (n)Variables that appear in the household budget constraint are:Q = goods consumed by the couple (the price of goods is normalized to 1)n = number of childrenw = market wage <strong>for</strong> mother’s laborL = total hours available to mother (to be divided between child-rearing and incomegeneration)λ = hours needed to care <strong>for</strong> one childπ = father’s earningsd = direct cost of children (food, clothing, health care, etc.)Modify the diagram to show how an increase in the direct cost of children affects thiscouple’s choice of consumption and number of children. (The increase in direct costsmight be due, <strong>for</strong> example, to a move to the city, where childcare is more costly.)Briefly explain your analysis.An increase in the direct cost of children doesn’t affect the intercept of the budgetconstraint ( wL + π ) because people without children can still consume the same volumeof goods. But it does increase the slope of the constraint, − ( λ w + d ), because each childnow means more <strong>for</strong>egone consumption. This inward pivot of the constraint causes anincome effect and a substitution effect, both of which act to discourage couples fromhaving large families.
4) (20 points) The following table shows the possible net earnings outcomes from two oneperiodinvestment projects that are available to investors.earnings outcome 1(probability = ½ )earnings outcome 2(probability = ½ )Project A -$4 $12Project B -$9 $21What is the expected earning from each project? That is, if each project were repeatedmay times, how much would it earn on average? Project A __$4___ Project B _$6___0.5 ⋅ ( −4)+ 0.5 ⋅ (12) = 40.5⋅( −9)+ 0.5⋅(21) = 6If investors’ preferences are characterized by the utility function U = ln(X), and eachinvestor begins with $10, what is the expected utility associated level achieved byinvestors in each project? Expected utility <strong>for</strong> investors in project A __2.44__ Expectedutility <strong>for</strong> investors in project B. _1.72__ (Note: an investor who chooses project A willend up with $10 - $4 = $6 with probability ½, and he will end up with $10 + $12 = $22with probability ½. Analogous comments apply <strong>for</strong> investment B.) Briefly explain theeconomic intuition behind the difference in your two <strong>answers</strong>.0.5 ⋅ ln(10 − 4) + 0.5 ⋅ ln(10 + 12) = 2.440.5⋅ln(10 − 9) + 0.5⋅ln(10 + 21) = 1.72Even though project B yields higher returns, on average, it is less attractive to investorsthan project A. The reason is that their preferences reflect diminishing marginal utility.(If you graph ln(X) against X, you will see that its slope becomes increasingly flat as Xrises.) Thus the large downside losses that can occur with project B are very unattractive,and more than offset the large upside gains that can occur.Continue to assume that all investors’ preferences are characterized by the utility functionU = ln(X), and each investor begins with $10. If projects like A are the only projectsavailable in country A, will investors commit to them, or will they simply hang on totheir $10? (invest in A, hang on to $10) ___invest in A___. If projects like B are the onlyprojects available in country B, will investors commit to them, or will they simply hangon to their $10? (invest in B, hang on to $10) _hang on to $10_.Hanging on to $10 yields investor a certain utility of ln(10) = 2.30. This is less than theexpected utility associated with project A (2.44), but more than the expected utilityassociated with project B (1.72).
5) (20 points) For the country you have chosen to specialize in, respond to each of thefollowing questions. (You are encouraged to work with other members of your countryteam.) For some countries, some of the questions below may prove difficult to answer. Ifyou cannot find the in<strong>for</strong>mation requested, simply explain the research strategy you havefollowed and list the sources you have consulted. You will not be graded down if youhave made a reasonable ef<strong>for</strong>t to find the <strong>answers</strong>.Country name _____________________________________________a) Does your country have a reputation <strong>for</strong> heavy regulation of industry? You maywish to consult: http://rru.worldbank.org/DoingBusiness/default.aspxb) Is corruption a major problem in your country? (You may wish to consult:http://www.transparency.org/cpi/2003/dnld/framework.pdf )c) How easy is it to en<strong>for</strong>ce contracts in your country? (You may wish to consult:http://rru.worldbank.org/DoingBusiness/default.aspx )d) How volatile have macro conditions been recently in your country? Calculatestandard deviations <strong>for</strong> inflation rates, GDP growth, and real exchange rates, thenassess their magnitude. Note: one good source <strong>for</strong> macro data is the IMF’sInternational Financial Statistics:http://www.lias.psu.edu/scripts/linklias.exe?Where=Go+There&What=IFSONLINE


