Homework Assignment #1: Answer Key
Homework Assignment #1: Answer Key
Homework Assignment #1: Answer Key

You also want an ePaper? Increase the reach of your titles
YUMPU automatically turns print PDFs into web optimized ePapers that Google loves.
Econ 497A<br />
Energy Economics and Energy Security<br />
Professor Ickes<br />
Fall 2011<br />
<strong>Homework</strong> <strong>Assignment</strong> <strong>#1</strong>: <strong>Answer</strong> <strong>Key</strong><br />
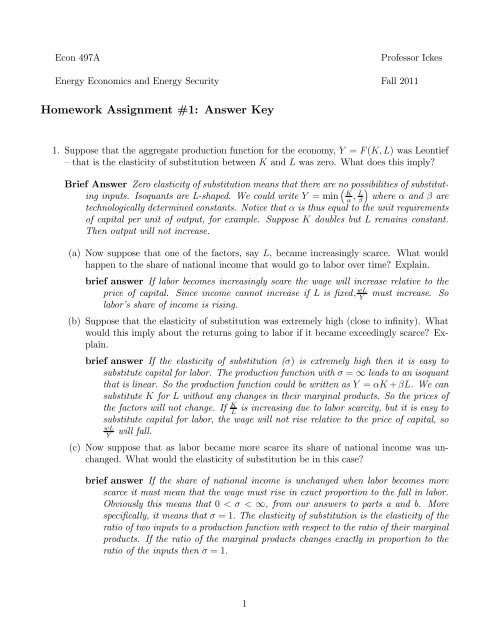
1. Suppose that the aggregate production function for the economy, = ( ) was Leontief<br />
— that is the elasticity of substitution between and was zero. What does this imply<br />
Brief <strong>Answer</strong> Zero elasticity of substitution means that there are no possibilities of substituting<br />
inputs. Isoquants are L-shaped. We could write =min ³ <br />
´ <br />
where and are<br />
technologically determined constants. Notice that is thus equal to the unit requirements<br />
of capital per unit of output, for example. Suppose doubles but remains constant.<br />
Then output will not increase.<br />
(a) Now suppose that one of the factors, say , became increasingly scarce. What would<br />
happen to the share of national income that would go to labor over time Explain.<br />
brief answer If labor becomes increasingly scare the wage will increase relative to the<br />
priceofcapital. Sinceincomecannotincreaseif is fixed must increase. So<br />
<br />
labor’s share of income is rising.<br />
(b) Suppose that the elasticity of substitution was extremely high (close to infinity). What<br />
would this imply about the returns going to labor if it became exceedingly scarce Explain.<br />
brief answer If the elasticity of substitution () is extremely high then it is easy to<br />
substitute capital for labor. The production function with = ∞ leads to an isoquant<br />
that is linear. So the production function could be written as = + . Wecan<br />
substitute for without any changes in their marginal products. So the prices of<br />
the factors will not change. If is increasing due to labor scarcity, but it is easy to<br />
<br />
substitute capital for labor, the wage will not rise relative to the price of capital, so<br />
will fall.<br />
<br />
<br />
(c) Now suppose that as labor became more scarce its share of national income was unchanged.<br />
What would the elasticity of substitution be in this case<br />
brief answer If the share of national income is unchanged when labor becomes more<br />
scarce it must mean that the wage must rise in exact proportion to the fall in labor.<br />
Obviously this means that 0 ∞, from our answers to parts a and b. More<br />
specifically, it means that =1 The elasticity of substitution is the elasticity of the<br />
ratio of two inputs to a production function with respect to the ratio of their marginal<br />
products. If the ratio of the marginal products changes exactly in proportion to the<br />
ratio of the inputs then =1<br />
1
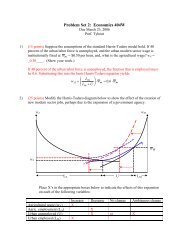
2. (This question appears more difficult than it really is. Just read carefully, and follow along.<br />
There are no mysteries here, but some interesting ideas.) Consider an economy with a production<br />
function, = ( ) 1−− ,where is resources used in production, all other<br />
variables are as usual, and are positive and + 1. Labor supply grows at the constant<br />
rate, , and grows at the constant rate . We consume resources over time, so the growth<br />
rate of ( ∆ )=−, where is a positive constant. From the production function it follows<br />
<br />
that the growth rate of income is given by:<br />
= + +(1− − )[ + ] (1)<br />
where isthegrowthrateofincomeattime, etc. We are interested in a balanced growth<br />
path where all the variables are growing at a constant rate and and grow at the same<br />
rate. Using (1) solve for the balanced growth rate of income, <br />
in terms of the parameters<br />
of the model. Show that <br />
is increasing in , for example.<br />
brief answer By definition on a balanced growth path and aregrowingatthesamerate.<br />
So = so using this in (1) we have:<br />
<br />
= <br />
+ +(1− − )[ + ]<br />
= <br />
− +(1− − )[ + ] (2)<br />
where the second line follows from the definitions of the growth rates in the problem.<br />
Solving (2) for <br />
yields:<br />
<br />
<br />
− <br />
= (1− − )[ + ] − <br />
(1 − − )[ + ] − <br />
=<br />
1 − <br />
addition after class, Sept 22 I really should not have asked you do show that <br />
is increasing<br />
in First, you would need calculus which is not required for the course, and<br />
second if you did differentiate (3) with respect to you would find it is negative not<br />
positive. What I meant to ask is show that <br />
is increasing in or and decreasing in<br />
That would have been a better and easier question. I will grade accordingly.<br />
(a) What happens to <br />
<br />
if increases. Why How does <br />
vary with <br />
brief answer If increases resources are declining at a faster rate. From (3) it is<br />
apparent that <br />
falls. We can also see that if rises, so growth is more sensitive<br />
to resources, then <br />
also falls.<br />
(b) The growth rate of output per worker is just − , so using your expression for <br />
<br />
what is the expression for the growth rate of output per worker on the balanced growth<br />
path, <br />
<br />
Is this necessarily positive Explain.<br />
brief answer Start with (3), and note that − = − , so<br />
<br />
− ≡ − +(1− − )[ + ]<br />
<br />
= − <br />
1 − <br />
− +(1− − )[ + ]<br />
= − 1 − <br />
1 − <br />
1 − <br />
2<br />
(3)
=<br />
− +(1− − )[ + ] − (1 − )<br />
1 − <br />
=<br />
− +(1− − ) − <br />
1 − <br />
=<br />
(1 − − ) − ( + )<br />
1 − <br />
(4)<br />
from (4) it is apparent that the numerator can be positive or negative. If → 0<br />
then <br />
<br />
is necessarily positive. If 0 then <br />
<br />
could be negative if resources<br />
growth is sufficiently negative, for example. That is if is large enough. Intuitively,<br />
if growth is sensitive to resources large and if resources are getting more scarce, it<br />
can offset the benefits of technical progress, .<br />
(c) Suppose there were resources were not fixed; instead suppose that they grow at the same<br />
rate as population, so ∆<br />
<br />
= . What would your expression for the balanced growth<br />
path of output per worker (call it e <br />
)looklikenow<br />
brief answer Now resources are growing, so replace − with in (4), so we have<br />
e (1 − − ) − ( − )<br />
<br />
=<br />
1 − <br />
(1 − − )<br />
= (5)<br />
1 − <br />
Resource growth is exactly offsetting the impact of labor growth in the expression.<br />
Now the growth rate of per-capita income on the balanced growth path is necessarily<br />
positive, because resources are always being augmented, and this offsets the negative<br />
impact of population growth on per-capita income growth.<br />
(d) Define the ”growth drag” from finite resources as the differencebetweengrowthinthe<br />
hypothetical case of part (c) and the actual case of part (b). That is = e <br />
− .<br />
What is equal to Why is this likely to be a pretty small number<br />
brief answer Using (4) and (5) we have<br />
=<br />
=<br />
(1 − − )<br />
−<br />
1 − <br />
( + )<br />
1 − <br />
(1 − − ) − ( + )<br />
1 − <br />
Parameters and are growth rates, numbers like 03 or something, is capital’s<br />
share something like .4 or something, and is by definition less than one. So the<br />
numerator is on the order of (2)(02 + 03) = 01 so is equal to something like<br />
1<br />
(01) ≈ 00167. Per-capita income growth tends to be much larger — at least an<br />
1−4<br />
order of magnitude; for example, in the US per-capita income growth has averaged<br />
about 2% since 1959. The key point is that the drag from resources is likely to be<br />
small, as long as is not very large.<br />
(e) Expression (1) seems to indicate that if income is growing today, it will continue to grow<br />
even as → 0. Why is this the case in this model What does the production function<br />
imply about the elasticity of substitution<br />
(6)<br />
3
ief answer It must mean that the elasticity of substitution is at least unity. We can<br />
substitute other inputs for declining resources without output falling. In fact, the<br />
production function we have chosen has =1. We have assumed that resources are<br />
notabindingconstraintongrowth. Butif1 then the share going to resource<br />
owners would rise as resources became more scarce — in other words, would increase<br />
as declined. So would not be a constant in (6), and thus your answer to part d<br />
understates the effect of declining resources in the case where substitution is difficult.<br />
We know from problem 1 that if production was Leontief then the share of national<br />
income that would go to resource owners would increase dramatically as → 0<br />
As your analysis in problem 1 shows, if =0then the share of income that goes<br />
tothescarceresourcegoesto100%,so −→ 1, and the drag approaches + ,<br />
which would overwhelm all sources of growth (it would still be true if 0 1).<br />
This is clearly a result that is consistent with the apocalyptic intuition about resource<br />
scarcity. When I wrote the production function as = ( ) 1−− I, in fact,<br />
assumed that =1(with such a production function, called Cobb-Douglas, the factor<br />
shares are independent of the capital labor ratio), as the shares and are constant.<br />
But, in fact, we know that the share of income going to resource owners has actually<br />
been falling in the US during the 20th century (real oil prices, for example, have<br />
been roughly constant and energy consumption per unit of GDP has been falling).<br />
So rather than 1 it seems almost certain that 1, and that the small drag<br />
computed in part d is closer to the truth.<br />
3. Consider the basic Hotelling model of exhaustible resources. Assume a competitive economy<br />
with many producers, a fixed cost of extraction, , and a choke price, . The rate of interest<br />
is given at rate . What happens to the extraction path of the resource (the plot of output,<br />
,againsttime)if:<br />
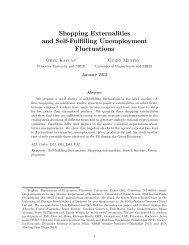
(a) the rate of interest falls.<br />
brief answer In class we analyzed a rise in , so this case is exactly opposite. If <br />
falls, it is all of a sudden better to keep a dollar’s worth of oil in the ground than a<br />
dollar in the bank. So oil production falls. This causes 0 to rise and 0 to fall. The<br />
Hotelling Rule requires that net rent grows at the rate of interest which is now lower.<br />
So clearly the time to exhaustion must rise. If price starts lower than before, and if<br />
it grows slower than before, it must take longer to reach Economically, the present<br />
value of future production has increased, so we should shift extraction towards the<br />
future (see figure 1).<br />
(b) the demand for the resource increases suddenly.<br />
brief answer If the choke price remains unchanged this means that the demand curve<br />
becomes flatter — greater demand at any price below In the case of the inverse<br />
demand curve used in class, = − , this means that falls. If the price path<br />
did not change we would extract more very period and total production would exceed<br />
. So 0 must rise to dampen down the quantity demanded. Since prices still grow<br />
at the rate it follows that 0 must also rise. If not, then we would reach before<br />
exhaustion. You can also see this from the expression we derived in class for output:<br />
= [1 − (1 + )− ],soif falls is higher. But this means that we must reach<br />
4
q t<br />
q 0<br />
initial optimal<br />
extraction path<br />
q <br />
0<br />
new optimal<br />
extraction path<br />
T<br />
T '<br />
t<br />
Figure 1: Shift in the Extraction Path<br />
exhaustion at a lower , so the new extraction path must have higher 0 and lower<br />
.<br />
(c) the choke price falls<br />
brief answer This means that is lower. If the price path were unchanged we would end<br />
up with extra oil which cannot be optimal. So 0 must fall and 0 must increase. The<br />
time to exhaustion must also fall, since reaches the new lower in less periods.<br />
So 0 rises and falls.<br />
(d) a tax on the sales (gross revenue) of the resource, per barrel is imposed on producers.<br />
brief answer This is a tax on revenues, not on rents. So the producer is now equating<br />
(1 − ) − = (1 − ) +1 − <br />
1+<br />
(7)<br />
thetaxisclearlynotneutral(asitwouldbeifthetaxwereonrents,thenwecould<br />
cancel out the (1 − ) terms). The impact of the tax is to lower the present value<br />
of current profits relative to future profits, as the left-hand side of (7) fall by more<br />
than the RHS. So the producer wants to produce less in the current period. So 0<br />
falls. Since production is moved to the future the time to exhaustion must rise, since<br />
prices still rise at the rate of interest.<br />
(e) a new discovery of oil takes place that doubles reserves.<br />
brief answer If reserves now equal 2, then production must rise. But if the choke<br />
price is unchanged and prices grow at the rate of interest, then 0 must rise and <br />
must increase as wellhso that the total amount of production Σ =0 −1 must rise. But<br />
we know that = i 2 1 − (1 + )<br />
−<br />
then the sum of production is given by:<br />
Σ =0 −1 = Σ =0<br />
−1 <br />
2 [1 − (1 + )− ]=<br />
so if doubles, and is given, the only thing that can rise is .<br />
5