Closing the Achievement Gap - Washington State School Directors ...
Closing the Achievement Gap - Washington State School Directors ...
Closing the Achievement Gap - Washington State School Directors ...

Create successful ePaper yourself
Turn your PDF publications into a flip-book with our unique Google optimized e-Paper software.
Table of ContentsForeword ........................................................................................................... vIntroduction ..................................................................................................... 1The Ad Hoc <strong>Achievement</strong> <strong>Gap</strong> Task Force ........................................... 1Guiding Principles of <strong>the</strong> Task Force .................................................... 2Overview of <strong>the</strong> Policy Action Guide ............................................................ 5Understanding <strong>the</strong> <strong>Achievement</strong> <strong>Gap</strong>............................................................ 7Definition................................................................................................. 7Evidence of <strong>the</strong> <strong>Achievement</strong> <strong>Gap</strong> ........................................................ 8Understanding <strong>the</strong> <strong>Achievement</strong> <strong>Gap</strong> inEach <strong>School</strong> District ............................................................................. 11All Students Can Learn: Evidence That <strong>the</strong> <strong>Gap</strong> Can Be Closed ............. 13<strong>Closing</strong> <strong>the</strong> <strong>Achievement</strong> <strong>Gap</strong>: Key Policy Issues....................................... 17Allocation and Alignment of Fiscal Resources ................................... 18Quality Teachers and Assignment ofQualified Staff to Low-Achieving Students........................................ 21Teaching and Learning.......................................................................... 24Cultural Competence ............................................................................ 27Time and Opportunity to Learn .......................................................... 30Learning Environment .......................................................................... 34Readiness <strong>Gap</strong> and Early Intervention ............................................... 36Parent Involvement and Community Collaboration ......................... 38Assessment and Accountability ........................................................... 41Conclusions .................................................................................................... 45O<strong>the</strong>r Policy Recommendations ................................................................... 49References ....................................................................................................... 53Presentations Made to <strong>the</strong> Task Force ......................................................... 57WASHINGTON STATE SCHOOL DIRECTORS’ ASSOCIATIONiii
ForewordAll children can learn. If we teach <strong>the</strong>m at high levels, <strong>the</strong>ywill achieve at high levels. We have evidence that this is truein school after school all across <strong>the</strong> country.There is also ample evidence that what we, as school board members,believe about children’s abilities makes all <strong>the</strong> difference. If we believe thatall children can learn, we will design our school systems to make this possible.We have recognized that children don’t come to our school doors in cookiecutter fashion. They reflect <strong>the</strong>ir homes, communities and cultures. Ourschools need to address <strong>the</strong> uniqueness of each child, celebrating <strong>the</strong>irbackgrounds, gifts and contributions, while providing <strong>the</strong> individualizedinstruction, time and attention each needs to be successful.We have learned that equity does not mean equal in measuring resources.Need should be <strong>the</strong> measure of our allocations. <strong>School</strong> board membersmust ask ourselves if we have aligned our resources so that all children,regardless of <strong>the</strong> learning assets and deficits <strong>the</strong>y bring with <strong>the</strong>m, have aneven chance to meet our standards.All of this requires courageous decision-making on <strong>the</strong> part of schoolboards. While reducing <strong>the</strong> achievement gap that exists among ethnic andincome groups was always a moral obligation, it is now <strong>the</strong> law, too. TheNo Child Left Behind legislation passed by Congress in 2001 holds alldistricts receiving federal dollars accountable for <strong>the</strong> achievement of studentsin each ethnic group, for children living in poverty, for English languagelearners and for children needing special education assistance.This guide presents some of <strong>the</strong> best thinking about <strong>the</strong> difficult and puzzlingwork of improving student achievement. Taken as whole, it gives acomplete picture of what it will take to close <strong>the</strong> achievement gap.WASHINGTON STATE SCHOOL DIRECTORS’ ASSOCIATIONv
My thanks to <strong>the</strong> members of <strong>the</strong> <strong>Achievement</strong> <strong>Gap</strong> Task Force for <strong>the</strong>irdiligence and thoughtfulness and passion for <strong>the</strong> success of all students.Thanks are also due to <strong>the</strong> WSSDA Board of <strong>Directors</strong> for forming andsupporting <strong>the</strong> Task Force, to <strong>the</strong> WSSDA Diversity-Multicultural AdvocacyTeam (D-MAT) for its advocacy of this project, to <strong>the</strong> WSSDA staffwho supported <strong>the</strong> Task Force, and to Debora Boeck, our skilled consultant.Best wishes to you all in this challenging and critically important workahead of us.CONNIE FLETCHERPresident, <strong>Washington</strong> <strong>State</strong> <strong>School</strong> <strong>Directors</strong>’ AssociationChair, WSSDA Ad Hoc <strong>Achievement</strong> <strong>Gap</strong> Task ForceviCLOSING THE ACHIEVEMENT GAP: A POLICY ACTION GUIDE
IntroductionEducators in <strong>Washington</strong> state have made significant advancesin improving education for all children. Establishing highstandards and being accountable through performance assessments arecritical beginnings in realizing a vision of world-class education. The goalis, and continues to be, for all children to meet or exceed <strong>the</strong> state’s highacademic standards.As documented in numerous state reports and national studies, not allchildren are reaching higher levels of achievement at <strong>the</strong> same rate. Indistricts across <strong>Washington</strong>, large groups of students are not meeting standards,creating a gap in achievement that is evident by group. Poverty andrace are substantial reasons for this gap.Establishing <strong>the</strong> Ad Hoc <strong>Achievement</strong> <strong>Gap</strong> Task Force and issuing thisreport mark <strong>the</strong> first steps in <strong>the</strong> <strong>Washington</strong> <strong>State</strong> <strong>School</strong> <strong>Directors</strong>’Association (WSSDA’s) efforts to close <strong>the</strong> achievement gap. Local schoolboard directors must take <strong>the</strong> next steps, through governance and policy, toclose <strong>the</strong> gap so that all children, regardless of race, family income or familybackground, can excel academically. The work of <strong>the</strong> Task Force and thisreport reflect WSSDA’s commitment to work collaboratively with o<strong>the</strong>rorganizations in a concerted and coordinated effort to end <strong>the</strong> disparities inachievement between groups of children.It is <strong>the</strong> paramount duty of<strong>the</strong> state to make ampleprovision for <strong>the</strong> educationof all children residingwithin its borders, withoutdistinction or preference onaccount of race, color, casteor sex.— Article IX, Section 1<strong>Washington</strong> <strong>State</strong>ConstitutionThe Ad Hoc <strong>Achievement</strong> <strong>Gap</strong> Task ForceThe Ad Hoc <strong>Achievement</strong> <strong>Gap</strong> Task Force was established in January 2001.The Task Force is comprised of <strong>Washington</strong> school board members directedto make recommendations to <strong>the</strong> WSSDA Board of <strong>Directors</strong>, and ultimatelyto all school boards in <strong>Washington</strong>, on <strong>the</strong> actions that would bestassist school boards in closing <strong>the</strong> achievement gap. The Task Force wascharged to accomplish <strong>the</strong> following:WASHINGTON STATE SCHOOL DIRECTORS’ ASSOCIATION1
Assess <strong>the</strong> achievement gap problem.Identify research, initiatives and o<strong>the</strong>r actions being taken by a varietyof agencies and institutions addressing this issue.Based on research, catalog school board policies, initiatives and actionsthat have contributed to ongoing success in reducing or eliminating<strong>the</strong> performance disparity among minorities or children inpoverty.Drawing on <strong>the</strong> Task Force members’ talents and abilities, and suchexternal resources as may be available, develop and report on bestpractices, model policies, or o<strong>the</strong>r school board actions that WSSDAand its members can implement to address <strong>the</strong> achievement gap issue.Over <strong>the</strong> course of 22 months, <strong>the</strong> Task Force listened to numerous presentationsfrom experts in <strong>the</strong> field and from school districts addressing equityand excellence. Task Force members reviewed research reports and articleson <strong>the</strong> achievement gap. These presentations and readings were followed byextensive discussion of policy issues and <strong>the</strong> development of recommendations,all of which are reflected in this report.The goal of <strong>the</strong> Task Force is to arm school board directors with <strong>the</strong> knowledge,understanding and tools to improve student learning for all childrenand close <strong>the</strong> achievement gap. In response to this goal, <strong>the</strong> Task Forcedeveloped <strong>the</strong> following guiding principles to serve as a foundation for itsissue analyses and recommendations.Guiding Principles of <strong>the</strong> Task ForceInequities persist in our society and in education, and school boards mustaccept a leadership role in mitigating <strong>the</strong>se inequities and closing <strong>the</strong>achievement gap that exists at all grade levels and in school districts of allsizes and locations in <strong>Washington</strong> state.<strong>Closing</strong> <strong>the</strong> achievement gap is critical to preserving American democracyand providing all students with <strong>the</strong> skills for economic self-sufficiency andopportunities to realize <strong>the</strong>ir potential.District policies should improve student learning and ensure that allstudents meet <strong>the</strong> essential academic learning requirements.Understanding <strong>the</strong> impact of race and poverty on student learning isessential to closing <strong>the</strong> achievement gap.<strong>School</strong>s cannot close <strong>the</strong> achievement gap alone. The responsibility isshared with schools, parents and larger community.All students can meet high standards when necessary opportunities,resources and support systems are provided.2CLOSING THE ACHIEVEMENT GAP: A POLICY ACTION GUIDE
All schools can close <strong>the</strong> achievement gap.The achievement gap can be significantly diminished or eradicated withoutlowering academic standards for any student.Students who have not achieved academic standards must have <strong>the</strong>iracademic progress accelerated to close <strong>the</strong> achievement gap.WASHINGTON STATE SCHOOL DIRECTORS’ ASSOCIATION3
Overview of <strong>the</strong> PolicyAction GuideThe <strong>Washington</strong> <strong>State</strong> <strong>School</strong> <strong>Directors</strong>’ Association (WSSDA)is publishing this report from <strong>the</strong> Ad Hoc <strong>Achievement</strong> <strong>Gap</strong>Task Force to bring attention and focus to creating equity and excellence inall schools and classrooms. The report is designed to provide a frameworkfor school board and community dialogue about <strong>the</strong> achievement gap andto assist school boards across <strong>Washington</strong> in taking action to reduce, andultimately eliminate, <strong>the</strong> disparity in achievement among groups of students.This policy action guide begins by providing a definition and overview of<strong>the</strong> achievement gap, giving readers an understanding of what <strong>the</strong> gap is,why it exists and how it is stubbornly chronic in too many schools. Researchis also presented that school boards can use to understand <strong>the</strong>achievement gap and <strong>the</strong> impact of poverty and race on student learning.The intent is that this information helps school board members betterunderstand <strong>the</strong> achievement gap in <strong>the</strong>ir own districts. Research about <strong>the</strong>achievement of students in <strong>Washington</strong> state and nationally is provided tofur<strong>the</strong>r knowledge about <strong>the</strong> gap. Also presented is research that “dispels<strong>the</strong> myth” and gives evidence that poor students and minority students canachieve at high levels when <strong>the</strong>y are taught at high levels.The next section of <strong>the</strong> policy action guide presents what <strong>the</strong> Task Forcehas identified as key policy issues school boards need to address in closing<strong>the</strong> achievement gap. For each policy issue, context and background ispresented, followed by recommendations for action by local school boards.<strong>School</strong> districts throughout <strong>Washington</strong> are actively working to improvestudent achievement and close <strong>the</strong> achievement gap, and examples are citedfor each of <strong>the</strong> policy areas. Finally, general conclusions and policy-levelWASHINGTON STATE SCHOOL DIRECTORS’ ASSOCIATION5
considerations are offered to o<strong>the</strong>r policy makers interested in addressing<strong>the</strong> achievement gap.<strong>School</strong> boards should use this guide as a foundation in developing anaction plan specific to <strong>the</strong>ir school district and community for closing <strong>the</strong>achievement gap.6CLOSING THE ACHIEVEMENT GAP: A POLICY ACTION GUIDE
Understanding <strong>the</strong><strong>Achievement</strong> <strong>Gap</strong>WSSDA’s overriding commitment is to all students meetingstate standards. To close <strong>the</strong> achievement gap, extra attentionmust be given to those students who, because of poverty or ethnicminority status, are not meeting <strong>the</strong> academic standards. This does notdiminish <strong>the</strong> dedication to achieving educational excellence for all students.Programs and strategies that close <strong>the</strong> achievement gap will help all studentslearn at higher levels.DefinitionFor <strong>the</strong> purposes of this report, <strong>the</strong> achievement gap is defined as:The difference in academic achievement between AfricanAmerican, American Indian and Hispanic students and<strong>the</strong>ir white and Asian peers and <strong>the</strong> difference in academicachievement between students, whose families areof low-income, and <strong>the</strong>ir peers from middle and upperincome families. The academic achievement gap is fur<strong>the</strong>rdefined in terms of performance on <strong>the</strong> <strong>Washington</strong>Assessment of Student Learning (WASL) and <strong>the</strong> IowaTest of Basic Skills (ITBS)/Iowa Test of EducationalDevelopment (ITED).This guide does refer, however, to <strong>the</strong> achievement gap on a national leveland <strong>the</strong>refore extends <strong>the</strong> definition to include differences in academicperformance as measured by o<strong>the</strong>r standardized tests. It is also importantto note that <strong>the</strong> Task Force recognized <strong>the</strong> limitations of this definition anduse of ethnic classifications that lump subgroups into one broad group.While, for example, not all Asian groups perform at <strong>the</strong> same achievementlevel, current data has not made it possible to fur<strong>the</strong>r disaggregate data byethnic subgroups.WASHINGTON STATE SCHOOL DIRECTORS’ ASSOCIATION7
The Task Force also recognizes that o<strong>the</strong>r factors have significant effects onstudent learning that contribute to <strong>the</strong> achievement gap. One of <strong>the</strong> mostsignificant factors is language. Evidence exists to show that schools withhigher percentages of English language learners (ELL) have lower achievementrates, just as schools with higher percentages of students qualifyingfor free or reduced-price lunch have lower achievement rates. Districtsthroughout <strong>Washington</strong> are working to increase <strong>the</strong> achievement of Englishlanguage learners, and this guide addresses <strong>the</strong> need to improve thoseefforts as part of <strong>the</strong> gap closing strategy.Evidence of <strong>the</strong> <strong>Achievement</strong> <strong>Gap</strong>“The differential achievement of poor and ethnically diverse students iswell documented and spans all grade levels.” (Poverty and Race ResearchAction Council, 2001). The achievement gap exists in school districts andschools across <strong>Washington</strong> and <strong>the</strong> nation and is not restricted to onlythose districts or schools with high percentages of students of color orstudents from low-income families. The data in this section serve to highlightwhat many already know—achievement gaps have existed for a longtime and show no sign of disappearing.According to <strong>the</strong> National Assessment of Educational Progress (NAEP), <strong>the</strong>test scores for <strong>the</strong> nation’s highest performing students have risen by threescale points since 1992, while <strong>the</strong> test scores of <strong>the</strong> nation’s lowest performingstudents have declined by seven scale points, causing <strong>the</strong> achievementgap to widen. According to <strong>the</strong> 2000 NAEP data, overall scores inreading and math increased; however, <strong>the</strong> differences between black andwhite students have increased in every subject area and every agegroup. The data also shows that <strong>the</strong> gap in test scores between whiteand black students persisted even when socio-economic status, levelof parent education and o<strong>the</strong>r factors were controlled.In <strong>Washington</strong>, <strong>the</strong> gap between whites and Asians and o<strong>the</strong>r ethnic groupsexists in most subjects and grades. According to <strong>the</strong> Office of Superintendentof Public Instruction (OSPI) data as presented to <strong>the</strong> Ad Hoc <strong>Achievement</strong><strong>Gap</strong> Task Force by Peter Bylsma, Director of Research and Evaluation:White students have higher performance levels than all minoritygroups except for Asians in 7th grade ma<strong>the</strong>matics.The performance of Asian students is fairly close to whites.Black, Hispanic and American Indian students have made lessprogress than whites or Asians.Whites and Asians have had about <strong>the</strong> same level of reduction in <strong>the</strong>percent of students not meeting standards.Black, Hispanic and American Indian students have made lessprogress in reducing <strong>the</strong> percent of students not meeting standards.8CLOSING THE ACHIEVEMENT GAP: A POLICY ACTION GUIDE
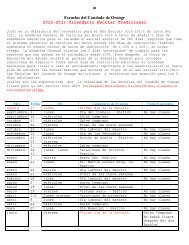
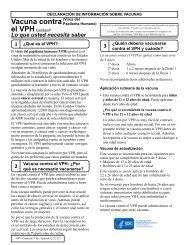
Data also show a clear pattern of achievement based on socio-economicstatus. For example:<strong>School</strong>s with higher levels of students from poor families have lowerscores and have shown less improvement.Clear patterns of achievement exist according to socio-economicstatus, regardless of subject matter or type of test.A stronger relationship exists between socio-economic status and mathand seventh grade achievement than between socio-economic statusand reading and fourth grade achievement.In <strong>the</strong> following table and graph, <strong>the</strong> relationship of socio-economic statusand achievement for <strong>the</strong> elementary grades is presented. The table andgraph clearly show that <strong>the</strong> higher <strong>the</strong> percentage of students qualifying forfree or reduced-price lunch in a school, <strong>the</strong> lower <strong>the</strong> overall achievementof <strong>the</strong> student population.Pattern of <strong>Achievement</strong> on ITBS and WASL TestsRelated to Families' Socio-Economic StatusLess than10–19.9%20–29.9%30–39.9%40–49.9%50–59.9%60% +10% F & RF & RF & RF & RF & RF & RF & RITBS Math2-year Avg.ITBS Math2000ITBS Reading2-year Avg.ITBS Reading2000WASL Math3-year Avg.WASL Math2000WASL Reading3-Year Avg.WASL Reading2000Avg. %Low Income76.669.5 64.1 61.9 57.9 54.5 43. 978.170.7 65.6 63.1 59.7 56.4 44. 669.263.4 59.0 55.8 52.1 48.6 37. 369.863.5 59.7 56.4 53.1 49.8 37. 758.046.7 39.3 37.0 32.0 26.8 20. 262.953.3 45.5 42.3 36.1 32.4 23. 879.370.3 64.8 61.3 56.6 51.3 40. 482.876.3 70.5 67.7 62.6 57.5 46. 65 .6% 15.3%25.3%34.5%44.6%54.9%74.5%WASHINGTON STATE SCHOOL DIRECTORS’ ASSOCIATION9
Pattern of <strong>Achievement</strong> on ITBS and WASL TestsRelated to Families’ Socio-Economic Status60% or more F & R“While our state’s WASLscores are rising across allgeographical communities,all ethnic groups and allincome levels, <strong>the</strong>re remainsan achievement gap.Students of color and thoseliving in poverty generallymeet our new standards ata lower rate than do o<strong>the</strong>rstudents. Similar resultsare observed in o<strong>the</strong>rstudent assessments, aswell. This is unacceptable.”— Bill WilliamsWSSDA Past President50 – 59.9 F & R40 – 49.9% F & R30 – 39.9% F & R20 - 29.9% F & R10 - 19.9% F & RLess than 10% F & R0 10 20 30 40 50 60 70 80 90ITBS Math 2 year Avg. ITBS Math 2000 ITBS Reading 2 year Avg.ITBS Reading 2000 WASL Math 3 year Avg. WASL Math 2000WASL Reading 3 Year Avg. WASL Reading 2000 Avg. % Low IncomeThe achievement gap is present in schools and districts throughout <strong>Washington</strong>.In its report to <strong>the</strong> <strong>Washington</strong> <strong>State</strong> Legislature, <strong>the</strong> Academic<strong>Achievement</strong> and Accountability Commission (<strong>the</strong> A+ Commission) reportedthat students of color, excluding Asian/Pacific Islander students,tended to be in schools that did not meet <strong>the</strong>ir fourth grade reading goalsmore often than in schools that did.The A+ Commission also found that, unlike special education and highlycapable students who are evenly distributed between schools that met <strong>the</strong>irfourth grade reading goals and those that did not, limited English profi10CLOSING THE ACHIEVEMENT GAP: A POLICY ACTION GUIDE
cient (LEP) students were disproportionately represented in schools thathad not met <strong>the</strong>ir reading goals.The data are similar for different socio-economic groups. The A+ Commissionfound schools that met <strong>the</strong>ir fourth grade reading goals had lowerpercentages of students receiving free or reduced-price lunch. In fact, <strong>the</strong>percentage of schools meeting <strong>the</strong>ir goals decreases as <strong>the</strong> percentage ofstudents receiving free or reduced-price lunches increases.Understanding <strong>the</strong> <strong>Achievement</strong> <strong>Gap</strong> in Each <strong>School</strong> DistrictTo provide leadership and policy guidance at <strong>the</strong> local level, school boardsneed to have a thorough understanding of <strong>the</strong> achievement gap in <strong>the</strong>irown school district. This means having a working knowledge of <strong>the</strong>district’s assessment results from <strong>the</strong> ITBS/ITED and WASL and knowing<strong>the</strong> right questions to ask regarding <strong>the</strong> test scores to determine <strong>the</strong> degreeto which some students are achieving and o<strong>the</strong>rs are not.With knowledge and understanding of what <strong>the</strong> achievement gap looks likein <strong>the</strong>ir schools, board members can engage staff and <strong>the</strong> community inmeaningful dialogue about why a gap exists and specific actions to take toclose <strong>the</strong> gap.The following questions can help guide <strong>the</strong> discussion about studentachievement to determine <strong>the</strong> extent to which <strong>the</strong> achievement gap existsin each school district.1. Based on <strong>the</strong> scores from <strong>the</strong> ITBS/ITED and WASL, what are <strong>the</strong>achievement rates for all students in <strong>the</strong> district at each grade leveltested? What has been <strong>the</strong> three-year trend of <strong>the</strong>se test scores?2. To what degree is <strong>the</strong>re a difference in <strong>the</strong> test scores of studentsacross socio-economic groups? To what degree is <strong>the</strong>re a difference in<strong>the</strong> test scores of students across ethnic groups?3. Do <strong>the</strong> scores over <strong>the</strong> past three years show any trend? Is <strong>the</strong> differencein <strong>the</strong> test scores across groups increasing or decreasing?4. What o<strong>the</strong>r patterns or trends exist in <strong>the</strong> achievement rates of ethnicminority and low-income students?5. Are <strong>the</strong>re patterns of achievement between groups across schools?What are <strong>the</strong> characteristics of schools with lower achievement? Whatdoes <strong>the</strong> Just For Kids data 1 show?6. What conclusions about student achievement can be drawn from <strong>the</strong>data, and what limitations are <strong>the</strong>re?1The <strong>Washington</strong> Just for <strong>the</strong> Kids is a Web-based data analysis and school performance and accountabilitysystem based on a very successful and highly acclaimed methodology developed by <strong>the</strong> Just for <strong>the</strong>Kids organization in Austin, Texas. The methodology takes into account a school’s socio-economicstatus, bilingual services, size, student mobility rate and o<strong>the</strong>r factors to identify high performingschools based on WASL and ITBS/ITED data. The Web site is www.spu.edu/orgs/research/justkids.asp.WASHINGTON STATE SCHOOL DIRECTORS’ ASSOCIATION11
7. What o<strong>the</strong>r assessment data exist at <strong>the</strong> school and classroom levelsto demonstrate student achievement trends in <strong>the</strong> district?The achievement gap plays out in a myriad of ways in addition to testscores. While investigating <strong>the</strong> gap in districts, it is important to consider<strong>the</strong> following:Dropout and College Rates. The report Postsecondary Opportunity and<strong>Achievement</strong> in <strong>Washington</strong> presents research showing that AfricanAmerican, Hispanic and Native American students in <strong>Washington</strong> aremore likely to drop out of high school and less likely to go directly toa four-year college from high school. According to <strong>the</strong> report, about 17percent of high school students drop out; however <strong>the</strong> rate for black,Native American and Hispanic students is between 27 percent and 36percent.Over-representation in Special Education. The A+ Commissionreported that American Indian and black students are over-representedin special education compared to <strong>the</strong>ir presence in <strong>the</strong> nonspecialeducation population. Data show that while four percent ofAmerican Indians are in special education, <strong>the</strong>y make up only 2.5percent of <strong>the</strong> non-special education population. Blacks make up 8.1percent of <strong>the</strong> special education population and only 5.5 percent of<strong>the</strong> non-special education population. Whites and Hispanics are eachequally represented in <strong>the</strong> special education and general educationpopulations, and Asians are under-represented.Under-representation in Gifted/Talented Programs and AdvancedPlacement Classes. Low expectations for students of color and thosewho are poor have a significant impact on achievement. Low expectationsfor students may be one reason that students of color and thosefrom poverty are under-represented in Advanced Placement (AP)classes and gifted and talented programs. In <strong>Washington</strong>, for example,only 661 American Indian, black and Hispanic students out of 11,447were enrolled in AP classes in 2001. Research shows that studentswith opportunities to learn at high levels have a much higher probabilityof completing a college degree.Discipline. Uneven administration of discipline results in students ofcolor being suspended and expelled more often than o<strong>the</strong>r students.Studies have shown this disparity in discipline based on race cannotbe explained just on socio-economic factors or <strong>the</strong> home lives ofchildren. A greater understanding of students from different culturesis needed by teachers and principals in applying fair and consistentdiscipline practices. As reported in <strong>the</strong> Seattle Post-Intelligencer, a SanFrancisco school has implemented a successful program to reduce <strong>the</strong>discipline gap by focusing on what adults can do to manage studentbehavior, ra<strong>the</strong>r than what students can do.12CLOSING THE ACHIEVEMENT GAP: A POLICY ACTION GUIDE
All Students Can Learn:Evidence That <strong>the</strong> <strong>Gap</strong> CanBe ClosedResearch has shown that schools, including those with highpercentages of children from poverty, those with high racialminority enrollments, and those with high percentages of English languagelearners are successfully closing <strong>the</strong> achievement gap. In 2002, <strong>the</strong> EducationTrust (www.edtrust.org) based in <strong>Washington</strong>, D.C. released <strong>the</strong> resultsof a comprehensive study of school-level test scores in 47 states and <strong>the</strong>District of Columbia from <strong>the</strong> year 2000. The report identified schools ineach state with math and/or reading achievement levels in <strong>the</strong> top one-thirdof all schools that also ranked in <strong>the</strong> top one-third of <strong>the</strong> state for povertylevels and/or African American and Latino enrollments. The study identified:3,592 high-performing, high-poverty schools2,305 high-performing, high-minority schools1,320 high-performing, high-poverty and high-minority schoolsNearly 50 percent of <strong>the</strong> schools identified above scored in <strong>the</strong> top onethirdin <strong>the</strong>ir states in both math and reading or language arts.In <strong>Washington</strong>, schools have made significant gains in <strong>the</strong> achievement of<strong>the</strong>ir students as measured by <strong>the</strong> <strong>Washington</strong> Assessment of StudentLearning. In 2000, <strong>the</strong> Partnership for Learning sponsored a University of<strong>Washington</strong> study that looked at schools that had been performing wellbelow state averages. Based on a comparison of <strong>the</strong>ir past and currentperformance, a number of schools with high percentages of students eligiblefor free or reduced-price lunch made significant gains on <strong>the</strong> WASL readingand math tests. A total of 33 elementary schools and 32 middle schoolswere included in <strong>the</strong> study and had, despite <strong>the</strong>ir demographics, madesignificant gains to surpass state averages.Dispelling <strong>the</strong> MythRevisited, <strong>the</strong> report issuedby The Education Trust,“provides persuasiveevidence that poor andminority children canachieve at high levels when<strong>the</strong>y are taught at highlevels.”— Kati Haycock, DirectorThe Education TrustWASHINGTON STATE SCHOOL DIRECTORS’ ASSOCIATION13
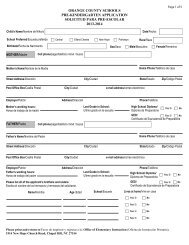
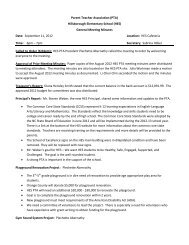
The <strong>Washington</strong> <strong>School</strong> Research Center’s Bridging <strong>the</strong> Opportunity <strong>Gap</strong>report of March 2002 identified 16 schools that demonstrated higherstudent achievement as measured by fourth grade WASL scores thanschools with similar demographics. Among <strong>the</strong> sixteen schools in <strong>the</strong> study,eight had 50 percent or more of <strong>the</strong>ir students qualifying for free or reduced-pricelunch and <strong>the</strong> o<strong>the</strong>r eight had 25-49 percent of <strong>the</strong>ir studentsqualifying for free or reduced-price lunch. These schools had as many as89 percent of <strong>the</strong>ir students meeting reading, writing and ma<strong>the</strong>maticsstandards.Whitney Elementary, in <strong>the</strong> Yakima <strong>School</strong> District (www.ysd.wednet.edu),for example, has 73 percent of its students on free or reduced-price lunch.In 1999, only 26 percent of <strong>the</strong> fourth grade students met standard on <strong>the</strong>WASL reading, math and writing. In 2000 that increased to 42 percent,and in 2001, 63 percent of <strong>the</strong> fourth graders met standard in <strong>the</strong>se threeareas.100%90%80%70%60%50%40%30%20%10%0%Larrabee Elementary in <strong>the</strong> Bellingham <strong>School</strong> District(www.bham.wednet.edu) is ano<strong>the</strong>r example. With 31 percent free orreduced-price lunch, <strong>the</strong>y were able to increase <strong>the</strong> percent of fourth gradersmeeting math, reading and writing standards from 56 percent in 1999to 81 percent in 2001. The average in 2001 for schools with 25-49 percentfree or reduced-price lunch was 51 percent of <strong>the</strong> students meeting <strong>the</strong>sestandards.14CLOSING THE ACHIEVEMENT GAP: A POLICY ACTION GUIDE
The two building graphs are from <strong>Washington</strong> <strong>School</strong> ResearchCenter, Bridging <strong>the</strong> Opportunity <strong>Gap</strong> report, 2002.Researchers interviewed teachers, principals, school leaders and a districtrepresentative in each of <strong>the</strong> highly successful schools. Based on <strong>the</strong> interviews,<strong>the</strong> following four factors were essential to <strong>the</strong>se effective schools:A caring and collaborative professional environmentStrong leadershipFocused and intentional instructionUse of assessment to inform instructionO<strong>the</strong>r factors identified by <strong>the</strong> educators as important but not necessarilypresent in every school were:Small school sizeDistrict supportLack of student and staff mobilityParent and community involvementProfessional developmentBridging <strong>the</strong> Opportunity <strong>Gap</strong> can be found at www.spu.edu/wsrc.WASHINGTON STATE SCHOOL DIRECTORS’ ASSOCIATION15
<strong>Closing</strong> <strong>the</strong><strong>Achievement</strong> <strong>Gap</strong>:Key Policy IssuesThe goal is to close <strong>the</strong> achievement gap. Economic status, raceand culture should not be predictors of academic achievement.To close <strong>the</strong> gap, school districts must direct resources to those with <strong>the</strong>greatest need and implement strategies to accelerate <strong>the</strong> learning of studentswho are underachieving. <strong>Closing</strong> <strong>the</strong> gap requires finding ways toclose <strong>the</strong> readiness gap so that no children enter kindergarten significantlybehind <strong>the</strong>ir peers. Serious attention must be given to creating learningenvironments that are intolerant of racism and exclusion and in which highexpectations are held for all students. All students, especially low-achievingand disadvantaged students, must be taught by highly qualified staff inpersonalized learning environments. Curriculum and teaching practicesmust recognize differences in ethnicity, language and culture and teachersmust be skilled in teaching students unlike <strong>the</strong>mselves. An emphasis mustbe placed on literacy and ma<strong>the</strong>matics. And, finally, reaching out to andempowering parents will be essential—schools cannot close <strong>the</strong>se gapsalone.The role of <strong>the</strong> school board is to work at <strong>the</strong> governance level to create <strong>the</strong>structure and policies for <strong>the</strong>se reforms to occur systemically. In <strong>the</strong> followingsection, <strong>the</strong> key policy issues, guidelines for discussing <strong>the</strong>se issues at<strong>the</strong> local board level, and recommendations for policy implementation arepresented. Examples of what some school districts are doing to address eachpolicy area are also presented.The Task Force did not prioritize <strong>the</strong>se policy issues. Each of <strong>the</strong> policyissues must be addressed to implement a comprehensive gap closing strategy.<strong>School</strong> boards are encouraged to review <strong>the</strong>ir current policies andpractices to determine which of <strong>the</strong>se policy issues should be prioritieswithin <strong>the</strong>ir own district.WASHINGTON STATE SCHOOL DIRECTORS’ ASSOCIATION17
Allocation and Alignment of Fiscal ResourcesIn <strong>Washington</strong> state, school districts are expected, for <strong>the</strong> mostpart, to improve student learning with existing resources. Given thisreality, districts must make new, critical choices about <strong>the</strong> use of<strong>the</strong>ir resources and target those limited dollars where <strong>the</strong>y will have <strong>the</strong>greatest impact.According to Odden and Archibald (2001), several commonalities exist in<strong>the</strong> resource allocation practices of schools engaged in successful reform.These commonalities include:<strong>School</strong>s allocate resources to where <strong>the</strong>y are most needed and have <strong>the</strong>greatest impact on student achievement.<strong>School</strong>s dramatically reduce or eliminate classroom pull-out strategiesand implement o<strong>the</strong>r practices, such as one-to-one tutoring throughextended day programs and instruction in small classes.Strategies implemented for low-achieving students, struggling studentsfrom low-income families, English language learners and those withmild learning disabilities are very similar and are delivered withpooled funds.An increasing number of districts eliminate or greatly reduce instructionalaide positions and use resources to implement o<strong>the</strong>r teacherprovidedinstructional strategies to accelerate <strong>the</strong> achievement ofstruggling students.Additional resources can also have a significant impact on student achievementwhen properly targeted. According to an NAEP study, resources mustbe allocated to specific programs, schools and/or grade levels and towardspecific students to be most effective (Improving Student <strong>Achievement</strong>: What<strong>State</strong> NAEP Test Scores Tell Us, 2000). Targeted class size reductions (forexample, smaller class sizes only for schools with a high percentage ofstudents eligible for free or reduced-price lunch or smaller class sizes onlyat primary grades) are policies for boards to consider.Equal does not necessarily mean equitable. Resources must be directedbased on need. Weighted student formulas acknowledge thatresources cannot be equally distributed if <strong>the</strong> needs of all students are to bemet. Many districts allocate resources to schools in such a way that morefunding per student goes to those schools with students with above averageneeds. For example, in Seattle Public <strong>School</strong>s (www.seattleschools.org),about 60 percent of <strong>the</strong> district’s state and local funding is allocated toschools on a weighted student formula, sending more money per studentfor special education, English language learners or students eligible for freeor reduced-price meals. Weighted student formulas can be used to addressdisproportional needs.18CLOSING THE ACHIEVEMENT GAP: A POLICY ACTION GUIDE
Questions to Guide <strong>the</strong> Policy Discussion1. To what degree are existing resources used to achieve <strong>the</strong> greatestimpact on student achievement? Are existing resources used to supportresearch-based, best practices for closing <strong>the</strong> achievement gap?2. How are resources allocated to different schools within <strong>the</strong> district?Do <strong>the</strong> schools with <strong>the</strong> most disadvantaged students have <strong>the</strong> level ofresources <strong>the</strong>y need to help close <strong>the</strong> achievement gap?3. What board policies currently exist that perpetuate resource inequities?What board policies currently exist that create barriers to directingresources to students with <strong>the</strong> greatest need?4. What are innovative models that o<strong>the</strong>r districts are using for aligningresources with <strong>the</strong> greatest needs?5. How can <strong>the</strong> school district’s allocation decisions be better aligned toimprove student learning and close <strong>the</strong> achievement gap?Policy Recommendations1. Create a district and community culture that reinforces <strong>the</strong> commitmentand belief that all district staff and <strong>the</strong> community members are responsibleto, and accountable for, <strong>the</strong> education of all students at every schoolin <strong>the</strong> district. From this philosophical foundation, work with staff and<strong>the</strong> community in evaluating <strong>the</strong> use of existing resources and <strong>the</strong> degreeto which resources are meeting <strong>the</strong> needs of students who must have<strong>the</strong>ir achievement accelerated to close <strong>the</strong> gap.2. Complete an evaluation of current policies and programs intended toaddress needs of underachieving students and determine whe<strong>the</strong>r currentresources are producing <strong>the</strong> desired benefits. Develop resource realignmentpolicies that support programs based on valid research and results,and implement program evaluation methods and timelines for reportingback to <strong>the</strong> board on program effectiveness.3. Investigate successful weighted student formulas used by o<strong>the</strong>r districtsand determine <strong>the</strong>ir appropriateness in helping <strong>the</strong> district meet its gapclosing goals.4. Base resource allocation decisions on a well thought out strategic plan forclosing <strong>the</strong> achievement gap, and target resources to meet <strong>the</strong> specificgap closing goals of <strong>the</strong> plan.5. Review and evaluate <strong>the</strong> use of new funding sources, such as I-728 andTitle I funding in terms of <strong>the</strong> alignment of <strong>the</strong>se resources with <strong>the</strong>greatest needs. Consider allocation decisions o<strong>the</strong>r than per-student todirect and concentrate <strong>the</strong>se resources where <strong>the</strong>y will have <strong>the</strong> maximumimpact on reducing <strong>the</strong> achievement gap.WASHINGTON STATE SCHOOL DIRECTORS’ ASSOCIATION19
What <strong>School</strong> Districts Are DoingIn <strong>the</strong> Federal Way <strong>School</strong> District (www.fwsd.wednet.edu), staff has createda way to reliably identify schools that are struggling to meet state anddistrict goals for student achievement and are in need of extra support,assistance or intervention. Staff created a rubric, or scoring guide, thatplaces schools along a three-point continuum. <strong>School</strong>s are rated usingachievement targets from <strong>the</strong> district’s strategic plan, and a school’s ratingis used in allocating both fiscal and human resources. Strategic plan goalsused for evaluation are:<strong>School</strong> meets or exceeds goals for WASL reading.80 percent of <strong>the</strong> school’s third grade students are reading at gradelevel as measured by <strong>the</strong> ITBS.<strong>School</strong> demonstrates continuous increase in student performance asmeasured by a 3-year rolling average on <strong>the</strong> WASL and ITBS/ITED.<strong>School</strong> increases <strong>the</strong> number of students meeting standard on STARscores from fall to spring.<strong>School</strong> has an “opportunity gap” under ten percent of students achievingbelow <strong>the</strong> average of <strong>the</strong> top-ten comparable schools.For schools identified as “intervention schools,” increased staff is allocatedto focus on increasing skills and reducing student-teacher ratios in gradesK-2. In addition, an Instructional Team Member is allotted at least a fulldayeach week to <strong>the</strong> school to work with teachers, and <strong>the</strong> school mayalso receive additional funds depending on achievement needs.The Edmonds <strong>School</strong> District (www.edmonds.wednet.edu) has used aweighted student formula to allocate funding to schools for many years.The formula was first developed to provide a differentiated level of learningsupport to individual schools. The formula is used to allocate a portion of<strong>the</strong> resources to schools and includes funding for Title I, LAP and specialeducation as well as <strong>the</strong> basic education dollars generated by special educationstudents. Under <strong>the</strong> formula, all schools receive some level of support,but <strong>the</strong> level of support is determined by a needs assessment. Criteria for<strong>the</strong> elementary school needs assessment includes <strong>the</strong> following:Student enrollmentPercentage of students receiving free or reduced-price lunchNumber of students scoring below <strong>the</strong> 25th percentile on districtdeveloped reading and math achievement testsPercentage of students not meeting standard in reading and math on4th grade WASLNumber of students with individual education plans (IEPs)Number of “ins and outs” to measure mobility20CLOSING THE ACHIEVEMENT GAP: A POLICY ACTION GUIDE
Percentage of students who were enrolled at <strong>the</strong> beginning of <strong>the</strong> yearand are still enrolled at <strong>the</strong> end of <strong>the</strong> yearPercentage of limited English proficient students eligible for ESLPercentage of students living in non-two-parent familiesBased on <strong>the</strong>se criteria, schools are rank ordered using a formula to determinea composite score. The higher <strong>the</strong> actual score, <strong>the</strong> higher <strong>the</strong> need,and funds are allocated accordingly.Quality Teachers and Assignment of QualifiedStaff to Low-Achieving StudentsQuality teachers are paramount to closing <strong>the</strong> achievement gap.<strong>School</strong> boards must ensure that all students have access to <strong>the</strong> mostbasic learning resource – quality teaching. According to Haycock(1998), <strong>the</strong> most important educational investment a state can make is inhighly qualified teachers.Extensive research from <strong>the</strong> Value-Added Research and Assessment Centerat <strong>the</strong> University of Tennessee demonstrates that,Groups of students with comparable abilities and initial achievement levelsmay have vastly different academic outcomes as a result of <strong>the</strong> sequence ofteachers to which <strong>the</strong>y are assigned. Based on <strong>the</strong>se results, students benefitingfrom regular yearly assignment to more effective teachers (even by chance)have an extreme advantage in terms of attaining higher levels of achievement.(Sanders and Rivers, 1996, p.6.)The study also demonstrated that lower achieving students benefited <strong>the</strong>most, average students next, and above average students <strong>the</strong> least fromincreased teacher effectiveness. Effective teachers produced significantlyhigher gains in student achievement among low achieving students thandid less effective teachers. Similar results were found in research conductedin <strong>the</strong> Boston Public <strong>School</strong>s and in <strong>the</strong> Dallas <strong>School</strong> District.Placing highly qualified teachers with students who are underachievingwill have <strong>the</strong> greatest impact on closing <strong>the</strong> achievement gap.Districts must consider how teachers are assigned. This includes how <strong>the</strong>yare assigned to schools in low-income neighborhoods versus moreadvantaged communities and how <strong>the</strong>y are assigned to classrooms andprograms that serve disadvantaged students versus those that serve achievingand highly achieving students.<strong>School</strong> boards and administrators can improve student achievementthrough <strong>the</strong> professional development of teachers. Improving teacher qualitymust be addressed in policies that provide for on-going professionaldevelopment. This includes teachers knowing how to use student academicperformance data to improve <strong>the</strong> teaching and learning.“In <strong>the</strong> hands of our bestteachers, <strong>the</strong> effects ofpoverty and institutionalracism melt away, allowing<strong>the</strong>se students to soar to <strong>the</strong>same heights as youngAmericans from moreadvantaged homes.”— Kati Haycock, DirectorThe Education Trust1998WASHINGTON STATE SCHOOL DIRECTORS’ ASSOCIATION21
The No Child Left Behind Act (www.nochildleftbehind.gov) requires thatall teachers in core academic subjects be highly qualified by <strong>the</strong> end of <strong>the</strong>2005-6 school years. The new law defines highly qualified teachers as thosewho not only possess full state certification but also have a solid contentknowledge of <strong>the</strong> subjects <strong>the</strong>y teach. High quality teachers must employeffective instructional and assessment strategies and methods in preparingstudents to meet state standards. Teachers must be able to do this for all<strong>the</strong> children <strong>the</strong>y teach.In providing professional development, key areas including pedagogy,content knowledge of subjects taught, use of assessment data to driveinstructional decisions and understanding <strong>the</strong> needs of a diverse studentpopulation are paramount. An ongoing policy issue centers on providingteachers with sufficient time to develop <strong>the</strong>se critical skills and knowledge.The assignment of teachers and instructional aides is also a critical factorin closing <strong>the</strong> achievement gap. Project STAR in <strong>the</strong> state of Tennessee wasa large-scale, randomized within-school research study focused primarily ondetermining <strong>the</strong> effects of class size. Secondary analysis addressed <strong>the</strong> useof instructional aides and <strong>the</strong> benefits of using assistants to improve studentachievement. The results from STAR, as well as from o<strong>the</strong>r researchstudies, have found that, in general, instructional aides are not effective inimproving <strong>the</strong> academic performance of students. Project STAR found nosignificant difference in student achievement between students in classeswith instructional aides and full-size classes without assistants.Questions to Guide <strong>the</strong> Discussion1. Do schools with <strong>the</strong> most needy students have <strong>the</strong> least experiencedteachers? Are Title I/LAP and o<strong>the</strong>r programs for disadvantaged orstruggling students staffed primarily with instructional aides providinglearning support?2. What practices are in place to recruit and retain qualified teachers?What is <strong>the</strong> district’s teacher turnover rate, and how is this affecting<strong>the</strong> district’s ability to meet <strong>the</strong> needs of low-achieving students andto have <strong>the</strong>m served by <strong>the</strong> most qualified teachers?3. What types of professional development do teachers need to help<strong>the</strong>m be more culturally competent? For example, does professionaldevelopment give teachers and o<strong>the</strong>r staff members opportunities totalk and learn about race and culture and <strong>the</strong> perceptions and biases<strong>the</strong>y may have encountered growing up? Does professional developmentprovide opportunities for staff to talk and learn about how race,poverty and culture affect teaching and learning?4. Is professional development for implementing strategies to close <strong>the</strong>achievement gap on-going, supportive and effective? Do teachers feelempowered in planning and conducting <strong>the</strong>ir professional develop-22CLOSING THE ACHIEVEMENT GAP: A POLICY ACTION GUIDE
ment? As a result of training, are new strategies really being implemented?5. Is <strong>the</strong>re collaboration with <strong>the</strong> teachers’ association to place <strong>the</strong> mostqualified teachers with students who need to accelerate <strong>the</strong>ir academicperformance and/or in schools with <strong>the</strong> highest percentage of childrenfrom low-income families or children of color?6. What is <strong>the</strong> district’s policy or practice for <strong>the</strong> use of instructionalaides? What evaluation data is <strong>the</strong>re that would inform decisionsabout <strong>the</strong> district’s use of instructional aides for improving studentachievement?Policy Recommendations1. Negotiate with <strong>the</strong> local teachers’ association on assignment and transferof teaching staff to maximize effective teaching where <strong>the</strong>re is most need.Make sure that schools have an equitable distribution of highly skilledteachers.2. Implement policies directing <strong>the</strong> superintendent to develop plans thatmove teachers to positions so <strong>the</strong>y are teaching in <strong>the</strong>ir areas of endorsementor areas of expertise. Assist teachers in acquiring endorsements andtraining for assignments where <strong>the</strong>y are needed.3. Develop recruitment programs that include specific and concerted effortsto attract and place highly qualified minority teachers.4. Investigate <strong>the</strong> district’s current use of instructional aides to provideadditional learning opportunities and/or remediation to struggling students.Give consideration to limiting or redirecting <strong>the</strong> role of aides inlight of <strong>the</strong> research. Students who are not achieving benefit most withinstruction from qualified teachers.5. Review professional development programs to ensure that <strong>the</strong>y addresscultural competence. Require multi-cultural education training for teachersand administrators.6. Create opportunities for teacher release time to be used for specifictraining in literacy and ma<strong>the</strong>matics and in <strong>the</strong> development of teachingskills in how to make learning effective, individual and long lasting.7. Develop policies and budget priorities for staff development that arealigned with <strong>the</strong> district’s student achievement goals and objectives.8. Develop policies and practices that support ongoing professional developmentfor all staff and especially mentoring and coaching for new andstruggling teachers.WASHINGTON STATE SCHOOL DIRECTORS’ ASSOCIATION23
What <strong>School</strong> Districts Are DoingThe Tacoma Public <strong>School</strong>s (www.tacoma.k12.wa.us) operates “ProjectQuality,” a partnership between <strong>the</strong> school district and <strong>the</strong> Tacoma EducationAssociation to develop and support accomplished teaching standardsthat reflect high expectations for teaching and learning in every classroom.They also shape <strong>the</strong> district’s recruitment, mentoring, professional developmentand evaluation activities.This past year, <strong>the</strong> Mukilteo <strong>School</strong> District (www.mukilteo.wednet.edu)completed a comprehensive review of its learning support program thatrelied heavily on <strong>the</strong> use of instructional aides in <strong>the</strong> delivery of instructionalsupport to struggling students and English language learners (ELL).With an increasing number of students, including ELL students, studentsfrom low-income families and students with special needs, <strong>the</strong> program wasserving a greater percentage of students. In some schools, <strong>the</strong> percentage ofstudents served exceeded 30 percent of <strong>the</strong> school’s student population.Program changes that will be implemented based on <strong>the</strong> review included(1) increasing reliance on <strong>the</strong> use of certificated teachers in <strong>the</strong> delivery ofinstruction to students so that <strong>the</strong> most qualified staff are serving <strong>the</strong>students in <strong>the</strong> learning support program who are <strong>the</strong> lowest achieving; and(2) reducing <strong>the</strong> number of instructional aides in <strong>the</strong> learning supportprogram and ensuring that existing instructional aides implementing instructiondo so under <strong>the</strong> direction of a certificated teacher with clearguidelines that clarify <strong>the</strong> role and responsibilities of instructional aides,classroom teachers, and learning support program personnel.Teaching and LearningNew conceptions of teaching and learning exist in <strong>the</strong> current visionof schooling with its emphasis on high standards, principles ofequity, and accountability. Teachers must teach to standards, usecurriculum aligned to standards, provide clear and focused instruction, andassess student performance toward meeting standards.Teaching and learning must give all students <strong>the</strong> opportunity to learn athigh levels. Academic rigor plays a significant role. Rigorous academiccoursework can mitigate <strong>the</strong> influence of <strong>the</strong> family’s socio-economic statusin a student’s life. High expectations for all students means providingopportunities to interact with peers who share high academic goals. Accessto all programs without educational segregation are methods to ensureopportunities for all students to learn at high levels. NAEP results clearlyshow that tracking or educational segregation, for example, has a negativeimpact on achievement. Those students who take more vocational classeshave lower standardized test results than students who enroll in academicorientedclasses.The Spokane <strong>School</strong> District (www.spokaneschools.org) conducted seniorexit interviews this past year, and students in Advanced Placement and24CLOSING THE ACHIEVEMENT GAP: A POLICY ACTION GUIDE
honors classes stated that <strong>the</strong>y felt prepared for <strong>the</strong>ir future, not because of<strong>the</strong> material covered but because of <strong>the</strong> “life lessons” of meeting deadlines,independent work and real-life applications used in learning, while moststudents in regular classes felt unprepared and asked for less busy work andmemorization and more application-based learning.Technology is <strong>the</strong> o<strong>the</strong>r key factor in <strong>the</strong> current teaching and learningframework. Recent ITBS scores showed that sixth graders who had a homecomputer scored 26 percentile points higher than those students without.Those with access to <strong>the</strong> Internet and/or e-mail scored 23 percentile pointshigher. Providing access to technology and integrating technology across<strong>the</strong> curriculum must be part of <strong>the</strong> teaching and learning framework at allgrade levels.Connecting students to learning through <strong>the</strong>ir passions and strengths isalso critical to student achievement. Rigorous curriculum and academicfocus does not mean a limited academic focus. The arts have an importantrole to play in a rigorous curriculum, and many districts are successfullyintegrating <strong>the</strong> arts across <strong>the</strong> curriculum. “The arts make sense to studentsbecause <strong>the</strong> arts allow <strong>the</strong>m to connect with topics, issues, ideas on agreater level of understanding. The arts help students internalize andprocess <strong>the</strong>ir world.” (Cynthia Chesak, Tukwila <strong>School</strong> District.)Teaching English Language Learners. Instructional methods must alsotake into account students’ first language. <strong>Closing</strong> <strong>the</strong> gap for Englishlanguage learners (ELL) is a challenge faced by many districts. The researchon English language learning is clear about what works. According to <strong>the</strong>Center for Research on Education, Diversity and Excellence (CREDE), allstudents benefit from academic instruction conducted in <strong>the</strong>ir first language.Those English language learners who are taught in <strong>the</strong>ir first languageend up being more successful in English-based instruction whencompared to ELL who are not taught academically in <strong>the</strong>ir first language.CREDE also found that instruction for English language learners needs tobe provided for at least four years and up to seven years for ELL learners tobe at <strong>the</strong> same level as those students who are native English speakers.Eighty percent of school districts in <strong>Washington</strong> state use ESL (English-asa-second-language)pull-out for English language learners, but it is <strong>the</strong> leasteffective and most expensive program to implement. Pull-out programstend to shift <strong>the</strong> responsibility for student learning to instructional aidesand o<strong>the</strong>rs. The most effective programs (in order of effectiveness) are:Two-way bilingual, dual languageLate exit bilingual and content ESLEarly exit bilingual and content ESLEarly exit bilingual and traditional ESLESL through academic contentESL pull-outWASHINGTON STATE SCHOOL DIRECTORS’ ASSOCIATION25
Questions to Guide <strong>the</strong> Discussion1. Has <strong>the</strong> district developed a teaching and learning framework forsupporting standards-based education? Is <strong>the</strong> curriculum aligned to<strong>the</strong> standards and do teachers use classroom-based assessments tosteer <strong>the</strong>ir instruction?2. Is <strong>the</strong> learning framework focused on providing all students withopportunities to learn at high levels? Is <strong>the</strong> curriculum based onchallenging content that requires application and demonstration oflearning?3. What policies and practices are in place that encourage and supportminority and low-income students’ access to, and success in, challengingcourses, such as Advanced Placement, honors or InternationalBaccalaureate classes?4. To what degree do teachers’ expectations for students in poverty,students of color or English language learners affect decisions aboutstudent placement or <strong>the</strong> tracking of students?5. What is <strong>the</strong> instructional program model for English language learners?To what degree is ESL pull-out used as a program option? Do <strong>the</strong>schools provide English language learners with sufficient support forlearning academic subjects?6. How is technology used across <strong>the</strong> curriculum? What is being done toincrease access to technology for all students?7. To what degree does <strong>the</strong> district use programs like <strong>the</strong> arts to engagestudents and provide <strong>the</strong>m vehicles for applying academic learning?Policy Recommendations1. Develop a board philosophy and set of principles guiding <strong>the</strong> implementationof standards-based instruction, curriculum aligned to standards and<strong>the</strong> use of best practices in classrooms.2. Review current curriculum development and adoption policies and reviseas needed to ensure that curriculum decisions are made to supportstandards and current trends in educational reform. Use equity checklistsor rubrics in <strong>the</strong> review of all curriculum.3. Implement policies that provide for a rigorous curriculum for all students.Ensure that all students have opportunities to enroll in honors, AdvancedPlacement and International Baccalaureate programs.4. Review <strong>the</strong> district’s program structure and staffing for English languagelearners to determine its alignment with best practices and implementneeded program changes with a focus on reducing ESL pull-out as <strong>the</strong>model for instruction.26CLOSING THE ACHIEVEMENT GAP: A POLICY ACTION GUIDE
What Districts Are DoingBellevue <strong>School</strong> District (www.belnet.bellevue.k12.wa.us) is working toraise standards for all students and lower <strong>the</strong> dropout rate by using AdvancedPlacement (AP) as an anchor for <strong>the</strong> overall improvement of studentachievement. In six years, <strong>the</strong> district has gone from scattered APcourse offerings to a district where all high schools offer a full AP or InternationalBaccalaureate program and district curriculum development is tiedat all levels with AP curriculum and tests. More than 70 percent of <strong>the</strong>district’s current senior class has taken at least one Advanced Placementcourse.Technology can be a great equalizer for students. The Bridgeport <strong>School</strong>District (www.bridgeport.wednet.edu) is a model for using technology toreduce <strong>the</strong> differences among students. Bridgeport went from 80 percentwhite in <strong>the</strong> mid-nineties to 86 percent Hispanic and at <strong>the</strong> same timeexperienced enrollment and funding declines. The district addressed <strong>the</strong>sechanges by retooling its schools with technology. Bridgeport began bygetting donated computers to families and <strong>the</strong>n working with AmeriCorpsand Wilderness Technology to promote a “make it and take it” program inwhich students build a computer for <strong>the</strong>mselves and take it home. With afederal grant, <strong>the</strong> district is connecting <strong>the</strong> school and homes to <strong>the</strong>Internet.The Manson <strong>School</strong> District (www.manson.org) operates a successful duallanguage program at <strong>the</strong> elementary level. The program merges <strong>the</strong> mostsuccessful aspects of second language learning with a challenging academicprogram. Students will learn to read and write first in <strong>the</strong>ir dominantlanguage and be part of <strong>the</strong> Manson Elementary Language Leveling program.They will learn about o<strong>the</strong>r subjects in English and Spanish. Instructionwill be divided so that <strong>the</strong>y will learn about half <strong>the</strong> time in eachlanguage. Lessons will not be repeated in each language but will build onone ano<strong>the</strong>r.Cultural CompetenceRace and class inequities are deeply embedded in society’s institutions.Institutions, just as <strong>the</strong> people in <strong>the</strong>m, must be culturallycompetent. This means that schools and school districts reflectpolicies, practices and structures that promote equity and respect for diversity.It also means that educators must understand <strong>the</strong> culture of poverty.As explained by Ruby Payne, in A Framework for Understanding Poverty,children bring with <strong>the</strong>m “hidden rules” and patterns of thought, socialinteraction, cognitive strategies and o<strong>the</strong>r patterns of <strong>the</strong> class in which<strong>the</strong>y were raised, and many are very different than those operating inschools driven by middle class patterns and rules.To close <strong>the</strong> achievement gap, <strong>the</strong>re must be understanding of <strong>the</strong> impact oflanguage, culture, race and poverty on student achievement. Students fromWASHINGTON STATE SCHOOL DIRECTORS’ ASSOCIATION27
economically disadvantaged families and communities often have differentbasic values and needs, and it is <strong>the</strong>se differences that often create conflictat school. Behaviors of students from cultures different from those of <strong>the</strong>teacher are often not understood and can be misinterpreted by school staffwho have had very different life experiences.The vast majority of teachers in <strong>Washington</strong> state are mono-cultural andmonolingual while student bodies are increasingly culturally diverse, bilingual,and English language learners.Students of color and students from poverty often bring experiences and anunderstanding of history and knowledge that <strong>the</strong>y do not see representedin <strong>the</strong> teaching and learning taking place in <strong>the</strong> classroom. For example,relevancy of curriculum for American Indian students is questioned when<strong>the</strong>y do not see <strong>the</strong>ir culture and languages represented in <strong>the</strong> curriculum.All staff must be trained in how <strong>the</strong>ir own culture and behavior affectsculturally and linguistically different students. These behaviors and culturaldifferences include how families perceive schooling, values and expectationsof <strong>the</strong> culture and simple things, like gestures and mannerisms.Staff need <strong>the</strong> skills to teach children to be “bi-cultural,” to succeed inschool and <strong>the</strong> workplace while remaining culturally proficient in <strong>the</strong>irhomes and neighborhoods.Attitude plays a key role in how individuals interact with each o<strong>the</strong>r. Biasedattitudes of particular cultural and socio-economic groups significantly altera school’s learning environment. A negative attitude breeds a negativeschool climate, and positive attitudes send clear messages that all are valued.Care must be taken to not let biased attitudes establish differentachievement expectations for students from different backgrounds.Questions to Guide <strong>the</strong> Discussion1. What dialogue on education and race have been held in <strong>the</strong> schoolsand communities? Do staff understand <strong>the</strong> impact of culture and raceon learning? Have <strong>the</strong>y been educated about <strong>the</strong> culture of povertyand its effects on learning?2. What false assumptions are held about English language learners,children and families in poverty, and students who are culturallydifferent? What false assumptions operate about parent’s willingnessto be involved in <strong>the</strong>ir children’s education? What unresolved issuesabout race and class exist that are known to influence education?3. How culturally competent is <strong>the</strong> educational system, board and staff?What can be done to be more culturally responsive?28CLOSING THE ACHIEVEMENT GAP: A POLICY ACTION GUIDE
Policy Recommendations1. Develop and adopt policies that express <strong>the</strong> board’s philosophy aboutequity and cultural competence. Affirm <strong>the</strong> board’s philosophy aboutequity and excellence through a statement of core beliefs that is posted inall schools. Be explicit in <strong>the</strong> policy about undoing racism.2. Join leaders in <strong>the</strong> community, including <strong>the</strong> faith-based community, tocall for a dialogue on race and <strong>the</strong> culture of poverty. Form communitystudy circles and book clubs to educate staff and o<strong>the</strong>rs on differentcultures and race issues.3. Provide for and support ongoing professional development to ensure thatstaff are culturally competent and hold high expectations for all students.4. As a board, meet with students on a regular basis to hear <strong>the</strong>ir voices andengage <strong>the</strong>m in helping to create a learning environment free of racism.What <strong>School</strong> Districts Are Doing<strong>School</strong> boards can adopt aggressive policies about eliminating racism. TheTukwila <strong>School</strong> Board (www.tukwila.wednet.edu) recognized <strong>the</strong> increasingcomplexity of assuring equity and excellence and <strong>the</strong> destructive nature ofracism by individuals and institutions, and sought to undo racism through<strong>the</strong> adoption of a school board policy. The board adopted five principlesthat commit <strong>the</strong> district to:Undoing racism and eliminating prejudice, bigotry and discriminationin schoolsEliminating disparities in achievement and in <strong>the</strong> administration ofdisciplineProviding educational experiences that reflect racial, cultural, andlinguistic diversityProviding comprehensive training to staff to respond to diversityEnsuring a supportive school environment in which each student hasan advocateThe Federal Way <strong>School</strong> District (www.fwsd.wednet.edu) created a taskforce that spent a full summer developing action plans to address its persistentacademic achievement gap between black, Hispanic, American Indianand <strong>the</strong>ir white and Asian peers. An Office of Equity and <strong>Achievement</strong> wascreated and specific goals for closing <strong>the</strong> gap were developed.Seattle Public <strong>School</strong>s (www.seattleschools.org) developed <strong>the</strong> DistrictAction Plan to Eliminate Disproportionality following recommendationsfrom a district Action Committee on Disproportionality. The committeewas formed in response to data showing African American students beingsuspended or expelled twice as often as white high school students andWASHINGTON STATE SCHOOL DIRECTORS’ ASSOCIATION29
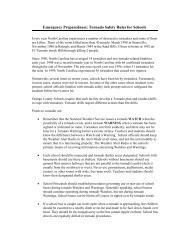
“We need to look inside ourdistrict. What’s important isthat we do not makeassumptions about anychild.”— Diane TurnerFederal Way <strong>School</strong> Districtthree times as often as white students in middle school; significantly higherdropout rates for students of color; and much higher percentages of studentsof color scoring below <strong>the</strong> 25th percentile on <strong>the</strong> ITBS.Throughout <strong>the</strong> entire school year, conversations on race will occur thatbegan with an August symposium focused on <strong>the</strong> elimination ofdisproportionality. The district’s action plan also addressed <strong>the</strong> need toimplement strategies to address and eliminate stereotyping and o<strong>the</strong>r biasesin special programs. The bilingual, highly capable and special educationprograms have been or will be reviewed.Time and Opportunity to LearnTime is a resource. A strong correlation exists between time on taskand improved academic performance. On a national level, <strong>the</strong>Commission on Time and Learning has found that—Ensuring that all students learn to high standards will require flexibilityand innovation in <strong>the</strong> use of common core learning time, as well as<strong>the</strong> rest of <strong>the</strong> time students spend both during and beyond <strong>the</strong> schooldayIncreasing <strong>the</strong> amount and duration of intensive, engaging and challenginglearning activities geared to high standards can increase studentmotivation and achievementThe benefits of extending learning time, including common coreinstructional time, can be maximized by concurrent changes in curriculumand instruction, such as accelerated learning, and engaging,interactive instruction based on challenging contentTo close <strong>the</strong> achievement gap, those students who are <strong>the</strong> fur<strong>the</strong>st behindmust have increased opportunity to learn to “catch up” and close <strong>the</strong> gap.The table below illustrates that if opportunity to learn in reading is heldconstant to meet <strong>the</strong> three-year 25 percent reduction goal in <strong>the</strong> number ofstudents not meeting standard, most American Indian, black and Hispanicstudents will not meet standard until well past 2008.Trend Needed to Meet 25% Improvement Goal — Grade 4 Reading2000200120022003200420052006200720082009201020112012AmericanIndianAsian/PacificIslanderBlack/AfricanAmericanHispanicWhite46.951.8 56.2 60.2 63.8 67.1 70.1 72.9 75.4 77.6 79.7 81.5 83. 266.769.7 72.5 75.0 77.3 79.4 81.3 83.0 84.5 86.0 87.2 88.4 89. 547.752.5 56.8 60.8 64.4 67.6 70.6 73.3 75.7 77.9 80.0 81.8 83. 539.444.9 50.0 54.6 58.7 62.5 65.9 69.0 71.9 74.4 76.8 78.9 80. 871.874.4 76.7 78.9 80.8 82.5 84.1 85.6 86.9 88.1 89.2 90.2 91. 1Source: OSPI, Research & Evaluation30CLOSING THE ACHIEVEMENT GAP: A POLICY ACTION GUIDE
If it is accepted that students in <strong>the</strong> lowest quartile will make only normalannual growth, those students will continue to stay in <strong>the</strong> lowest quartile,and <strong>the</strong> gap will never close. Students only “catch up” by making morethan a year’s worth of growth. Extended learning time and targetedremediation are <strong>the</strong> strategies needed to increase <strong>the</strong> rate of growth forstudents in <strong>the</strong> lowest quartile. Extended learning time can be in terms oflonger school days, longer school years, after-school tutorials, Saturdayenrichment, or summer school.In-school instructional time must be used to accelerate achievement forthose students in <strong>the</strong> lowest quartile. Grade-level reading should perhaps be<strong>the</strong> main priority in closing <strong>the</strong> achievement gap, and <strong>the</strong>refore receive amore significant share of <strong>the</strong> instructional day. A student who is two tothree years behind in reading, for example, will require time beyond <strong>the</strong>time devoted to reading for <strong>the</strong> general population to come up to gradelevel. How time is used during <strong>the</strong> school day for <strong>the</strong>se students must beexamined. The best use of existing time may be <strong>the</strong> same number of schoolcalendar days used in more strategic ways.It is also important to ensure that opportunities to learn are carefullystructured to provide additional time for targeted remediation withoutstudents losing out on learning taking place in <strong>the</strong> classroom. In a highperformingelementary school, in-class instruction is designed for maintenanceof grade-level skills and exposure to grade-level material while <strong>the</strong>extended day program is for remediation. <strong>School</strong>s that provide real-timeremediation strategies so that students stay on track, keep students fromfalling far<strong>the</strong>r and far<strong>the</strong>r behind. Finally, targeted remediation and extendedlearning opportunities should be implemented along with assessmentsystems that measure annual rates of growth, especially in readingand math. Level Tests that measure spring to spring achievement are usedby many districts.Questions to Guide <strong>the</strong> Discussion1. How do <strong>the</strong> schools currently structure <strong>the</strong>ir school day and schoolyear to maximize academic learning time?2. Is modifying <strong>the</strong> calendar for learning something that should bediscussed by schools in <strong>the</strong> district? How is <strong>the</strong> district addressing <strong>the</strong>challenge of summer learning loss for students?3. What assessment procedures do <strong>the</strong> schools have in place to identifystudents in need of specific, targeted remediation?4. What developmental and remedial learning opportunities do <strong>the</strong>schools currently provide during <strong>the</strong> school day, after school and in<strong>the</strong> summer? How are <strong>the</strong>y staffed and are adequate resources targetedto those programs and strategies? What assessment data exists toshow how successful <strong>the</strong>se current programs are?WASHINGTON STATE SCHOOL DIRECTORS’ ASSOCIATION31
5. To what degree have new ways to increase academic learning time forstudents most in need been examined and implemented?6. To what extent is <strong>the</strong> district providing extended learning opportunitiesfor primary age students who are not reading at grade level?7. What possibilities have been explored regarding <strong>the</strong> school calendarand modifications of <strong>the</strong> existing calendar? Are <strong>the</strong> opportunities tolearn for students in need of remediation placed at <strong>the</strong> most strategictimes throughout <strong>the</strong> year? What would <strong>the</strong> most effective academiccalendar of 180 days look like?Policy Recommendations1. Develop and adopt policies that direct <strong>the</strong> resource of time to closing <strong>the</strong>achievement gap, including a clear focus on using extended time effectivelybased on assessment of students’ needs. Allocate resources forremediation and acceleration of students’ annual growth targeted tostudents in <strong>the</strong> lowest quartile.2. Ensure that policies and practices establish clear links between <strong>the</strong>extended time programs and <strong>the</strong> regular academic program.3. Implement policies that develop and use collaboration among schools,parents, and communities to widen <strong>the</strong> pool of resources, expertise, andactivities available to extended day programs, such as recruiting parentsand community members as individual tutors and mentors. Explorecollaborations with traditional afterschool programs to provide extendedacademic learning opportunities.4. Direct staff to search for outside funding to support extended learningopportunities, including state, federal and private sources.5. In implementing new policies or practices to increase learning opportunitiesand time directed at closing <strong>the</strong> achievement gap, be sure to includea thoughtful evaluation plan to measure program effectiveness. Includeassessments that measure rate of annual growth in reading and ma<strong>the</strong>matics.What <strong>School</strong> Districts Are DoingThe South Whidbey <strong>School</strong> District (www.sw.wednet.edu/schools/americorps/am_home.html) has expanded learning opportunities for studentsthrough partnerships with several community groups. The districtand South Whidbey Youth Center have collaborated for many years toprovide afterschool tutoring services to students. In addition to <strong>the</strong>afterschool tutoring provided by <strong>the</strong> youth center, <strong>the</strong> district has a strongpartnership with AmeriCorps. The South Whidbey AmeriCorps membersprovide significant services to students, working with students and teachers32CLOSING THE ACHIEVEMENT GAP: A POLICY ACTION GUIDE
during <strong>the</strong> school day and after school to extend learning. AmeriCorpsmembers:Tutor students one-on-one or in small groupsPromote family literacyEngage students in cross-age and peer tutoring“Host” community volunteers serving as reading tutorsDevelop community partnerships to sustain reading activitiesGrants from <strong>the</strong> U.S. Department of Education (www.ed.gov), and nowfrom <strong>the</strong> Office of Superintendent of Public Instruction (www.k12.wa.us)from <strong>the</strong> 21st Century Learning Center Program, have made it possible fornumerous school districts in <strong>Washington</strong> to provide before and after-schoollearning opportunities. These discretionary grant funds are used by districtsat elementary through high school to provide tutoring, enrichment,and safe and healthy activities for children far beyond <strong>the</strong> school day.Successful programs are well integrated with <strong>the</strong> school’s curriculum andviewed by staff as an opportunity to extend teaching and learning.Yakima <strong>School</strong> District (www.ysd.wednet.edu) has operated one school on amodified school calendar for a number of years, with two o<strong>the</strong>r schools in<strong>the</strong>ir first year on a modified calendar. Research regarding student achievementof students attending schools with modified calendars shows thatstudents retain more and <strong>the</strong>re is less re-teaching. For <strong>the</strong> lowest achievers,greater gains appear to be made by students in modified school calendarprograms compared to students in similar schools operating on a traditionalcalendar. Yakima’s Garfield Elementary has demonstrated success by improvingachievement using <strong>the</strong> modified calendar. The chart below shows<strong>the</strong> school’s improvement through rising WASL scores in all areas.100806040200WASHINGTON STATE SCHOOL DIRECTORS’ ASSOCIATION33
“<strong>Closing</strong> <strong>the</strong> achievementgap requires a comprehensiveapproach to studying<strong>the</strong> overall school experience.If it were just amatter of achievement,<strong>the</strong>n your approach wouldbe to only focus onimproving teaching andcurriculum. We’ve learnedthat that will not beadequate.”— Thomas Fowler-FinnSuperintendent of <strong>School</strong>sFort Wayne, IndianaLearning EnvironmentA school’s learning environment has a significant impact on studentachievement. The learning environment provides <strong>the</strong> conditions andclimate in which learning takes place. It affects expectations, perceptionsand behavior of both students and teachers. <strong>School</strong> environmentsthat foster high expectations and respect spawn resilient youth who areengaged and self-motivated.“<strong>School</strong> can be a culturally foreign place for many students and for o<strong>the</strong>rsit is a place where <strong>the</strong>y are invisible. Small schools and personalized learningenvironments are proving to be significant in increasing <strong>the</strong> academicachievement of high school students.” (Tom Vander Ark, Executive Director;Bill and Melinda Gates Foundation.) Personalized learning environmentsare characterized by staff who demonstrate caring and who valuestudent experiences and strengths. They treat all students as smart andcapable. As expectations rise by adopting rigorous standards, educatorsmust also be steadfast in <strong>the</strong> belief that all students can learn, and mustprovide personalized learning environments that support students in thatachievement.<strong>School</strong> size appears to play an important role. According to <strong>the</strong> recentlongitudinal study by <strong>the</strong> National Institute of Health, schools becomemore bureaucratic and connections between staff and students become lesspersonal as school size grows. In fact, according to <strong>the</strong> study, school size ismore significant than class size in terms of student connectedness.A learning environment that supports learning at high levels is also anequitable school. National and <strong>Washington</strong> state data show that manyschools have uneven discipline standards that result in students of colorbeing suspended and expelled at higher rates. Clearly, if students are notpresent, <strong>the</strong>y cannot learn.Effective schools have environments that deliver equitable counseling andguidance, support services, and citizenship experiences that support equityand diversity, promote resiliency, and increase self-understanding andpositive identity development for all youth. Effective schools are characterizedby connection, cohesion and safety. Resilience promoting strategiesand asset-based models focused on assets like school engagement, positiveperceptions of teachers, and greater expectancies for success are related tohigher academic achievement.According to Ruby Payne, author of A Framework for Understanding Poverty,<strong>the</strong> key to achievement for students from poverty is relationships. “Whenstudents who have been in poverty (and have successfully made it intomiddle class) are asked how <strong>the</strong>y made <strong>the</strong> journey, <strong>the</strong> answer nine timesout of 10 has to do with relationship – a teacher, counselor or coach whomade a suggestion or took an interest in <strong>the</strong>m as individuals.” (Page 143.)34CLOSING THE ACHIEVEMENT GAP: A POLICY ACTION GUIDE
Questions to Guide <strong>the</strong> Discussion1. Have <strong>the</strong> schools’ learning environments been assessed? How? Is itknown if students and staff perceive <strong>the</strong>ir school to be a positive placeto learn? Do students view <strong>the</strong>ir teachers as approachable and caring?To what degree are students connected to <strong>the</strong>ir school and engaged inschool activities?2. What do discipline statistics say about practices? Are certain groupsof students over-represented in discipline actions taken?3. What is being done to counteract <strong>the</strong> negatives of large school size?To what degree is <strong>the</strong> district exploring restructuring to smallerschools or creating smaller learning environments? Is <strong>the</strong> districtconsidering school size in both short and long term facility planning?4. Is staff educated in <strong>the</strong> asset building model and risk and protectivefactor research and are <strong>the</strong>y applying this information in <strong>the</strong>ir practices?5. What is <strong>the</strong> staff’s attitude toward students? Do staff members prejudgestudents and <strong>the</strong>ir potential based on race, culture or economicstatus?“Independent of race,ethnicity, family structureand poverty status,adolescents who areconnected to <strong>the</strong>ir parents,to <strong>the</strong>ir families and to <strong>the</strong>irschool community arehealthier than those whoare not.”— Reducing <strong>the</strong> Risk:Connections that Make aDifference in <strong>the</strong> Lives of YouthPolicy Recommendations1. Track discipline reports and analyze discipline data to determine if patternsexist that reveal differences in discipline along racial, cultural andsocio-economic lines. Revise policies and/or procedures and provide stafftraining to make needed changes based on findings.2. In district and school improvement plans, include specific goals andindicators of achievement associated with effective schools, such as (a) acaring and supportive school culture; (b) valuing and incorporating highexpectations for all students; and (c) assessing improvements in studentattendance, staff attendance and student involvement in school athleticsand activities. Measure school climate.3. Implement policies for a personalized learning environment in everyschool in which every student has a mentor or an adult advocate.4. Implement policies that require schools to conduct periodic assessmentsof school climate through analysis of student attendance, disciplineactions, and staff turnover and through surveys of students, staff andparents.What <strong>School</strong> Districts Are DoingMead Middle <strong>School</strong>, in <strong>the</strong> Mead <strong>School</strong> District (www.mead.k12.wa.us),is implementing an alternative middle school with a grant it received from<strong>the</strong> Office of <strong>the</strong> Superintendent of Public Instruction. With a GatesFoundation grant <strong>the</strong> school will combine with <strong>the</strong> alternative middleWASHINGTON STATE SCHOOL DIRECTORS’ ASSOCIATION35
“Where <strong>the</strong>re are differentlevels of exposure to readingin <strong>the</strong> pre-school years,basic literacy can catch upin school. The more complexaspects of literacy are muchmore difficult to catch upand children with low socioeconomicstatus (SES) fallbehind faster. Pre-schoolliteracy efforts require morethan decoding skills: richoral language opportunities,extended conversations;and exposure toreading. There is a correlationbetween SES andexposure to a rich languageenvironment. Kids musthave wide access to books,print media, writingexperiences and o<strong>the</strong>rexpressive activities, plusdecoding skills.”— Novick and CarrNorthwest RegionalEducational Laboratories(www.nwrel.org)school grant to allow Mead Middle <strong>School</strong> to accelerate <strong>the</strong> creation ofsmaller, more individualized teaching and learning environments. Twoschools are emerging—one alternative district-wide school for students withspecial circumstances, and one “new” middle school.Royal Middle <strong>School</strong> (www.royal.wednet.edu), in rural Grant County, isreinventing itself with a focus on reading and is creating a personalizedlearning plan for every student. The school is ensuring that each studenthas <strong>the</strong> attention of a caring adult by starting an adult advocate/mentorprogram. Students will have <strong>the</strong> same mentor group throughout <strong>the</strong>ir threeyears in middle school.Readiness <strong>Gap</strong> and Early InterventionSuccess in school is influenced by numerous factors including whathappens before children come to school and what occurs while <strong>the</strong>yare in school. “While <strong>the</strong> board’s legal responsibility is to <strong>the</strong> K-12system, <strong>the</strong>re is a large body of research that suggests higher levels ofachievement will not be possible for all students if we limit our focus towhat happens in school.” (Brumbaugh,1997). Researchers report thatmany minority and disadvantaged students enter kindergarten developmentallybehind <strong>the</strong>ir peers and that gaps in achievement grow as <strong>the</strong>y continuein school. According to <strong>the</strong> National Association for <strong>the</strong> Education ofYoung Children, a five-year difference in literacy related skills exists amongchildren entering kindergarten with some children already independentreaders and o<strong>the</strong>rs having <strong>the</strong> skills of a typical three-year old.To address this readiness gap, school boards need to work to extend highquality,academically focused early childhood education to children at-riskof school failure. <strong>School</strong> boards can advocate and partner with communityagencies to get more children of color and low-income families participatingin pre-kindergarten programs. Priority should be on language and readingskills targeting preschool through primary age children. The earlier <strong>the</strong>intervention, <strong>the</strong> more likely <strong>the</strong> achievement gap for individualchildren will be closed.In addition, policies that support full-day kindergarten can provide aneffective early intervention when targeted at meeting <strong>the</strong> needs of studentswho enter kindergarten not having had quality preschool experiences orenriched language stimulation (Hopkins and Katims, 2002). A longitudinalstudy of a full-time kindergarten program in six Edmonds schools fundedby <strong>the</strong> Better <strong>School</strong>s Fund was conducted by Hopkins and Katims whofound that “for all 17 skills measured, a higher percentage of first-gradestudents who had previously attended a full-time kindergarten met orexceeded target than students who had previously attended a half-timekindergarten program.”(page 13.) These differences continued when <strong>the</strong>students were given <strong>the</strong> second grade oral reading assessment a year later.36CLOSING THE ACHIEVEMENT GAP: A POLICY ACTION GUIDE
Many districts have opted to use I-728 funds to support full-day kindergartenprograms.Questions to Guide <strong>the</strong> Discussion1. What policies currently exist that support partnerships and effectivetransition between preschool and child care programs and K-12schools?2. What policy and program benefit analysis has been conducted todetermine whe<strong>the</strong>r <strong>the</strong> district should provide full-day kindergarten?3. Does <strong>the</strong> district determine each student’s level of reading and mathreadiness in <strong>the</strong> fall of kindergarten and have spring math and literacytargets to use in determining which students need early intervention?4. What early intervention programs are in place? What programs areneeded?5. What can <strong>the</strong> school board do to impact decisions about early childhoodeducation and readiness to learn?6. Can <strong>the</strong> district expend resources for high quality pre-school, at leastfor at-risk learners?“The single most importantthing that can be done [toprevent retention] is toteach students to read wellin <strong>the</strong> early grades and tostick with <strong>the</strong> effort insteadof waiting to do somethingwhen <strong>the</strong>y enter fourthgrade.”— Lorrie ShepardUniversity of ColoradoPolicy Recommendations1. Implement policies that require early assessment of reading and ma<strong>the</strong>matics,with intervention programs aligned to reading and math targetsfor all students who have not met <strong>the</strong> necessary level of reading and mathreadiness.2. Develop policies that create clearly articulated practices between elementaryschools and preschools, child care agencies and family organizationsthat support readiness to learn.3. Provide <strong>the</strong> community leadership to develop awareness of <strong>the</strong> issues andneeds of young children and families, including <strong>the</strong> need to close <strong>the</strong>readiness gap.4. Establish a board liaison position with <strong>the</strong> local network of early childhoodservice providers and work to develop joint policies that supportpreventative programs and early intervention.5. Support family literacy programs and incorporate family literacy intoschool-based programs for students in K-3 from disadvantaged homes andthose who are English language learners.6. Develop policies to support full-day kindergarten for students most inneed or in schools with high percentages of students from low-incomefamilies or English language learners. Consider <strong>the</strong> use of I-728 funds forfull-day kindergarten programs.WASHINGTON STATE SCHOOL DIRECTORS’ ASSOCIATION37
What <strong>School</strong> Districts Are DoingKennewick <strong>School</strong> District (www.ksd.org) has implemented an early interventionprogram based on <strong>the</strong> belief that by helping children come tokindergarten prepared, <strong>the</strong>re is much less need for remediation. The focusof <strong>the</strong> program is “Kindergarten Readiness” and is implemented in collaborationwith <strong>the</strong> Reading Foundation. It provides <strong>the</strong> necessary pre-literacyacquisition that guarantees successful readers. The goal is to make allparents aware of how important it is to read to <strong>the</strong>ir children from birththrough third grade. At <strong>the</strong> heart of <strong>the</strong> program is a simple media-drivenmessage: “The most important twenty minutes of your day is reading withyour child.” The foundation also has parenting modules for kindergartenreadiness.Research based on longitudinal data from <strong>the</strong> Kennewick <strong>School</strong> District asreported by <strong>the</strong> National Children’s Reading Foundation(www.readingfoundation.org/local/local foundations.asp) found that “studentsat risk of failure can be identified in <strong>the</strong> first months of kindergartenby deficit pre-literacy skills” and that <strong>the</strong>se same children can be re-identifiedat first, second and third grade on <strong>the</strong> basis of <strong>the</strong>ir low reading skills.This research makes a strong case for <strong>the</strong> Reading Foundation’s recommendationto increase <strong>the</strong> number of children entering kindergarten with basicpre-literacy skills.The Lakewood <strong>School</strong> District (www.lwsd.wednet.edu) is working to improveliteracy skills for preschool children in low-income families. With anEven Start Family Literacy grant <strong>the</strong> district is focusing on improvingliteracy in <strong>the</strong> home while making parents “full partners” in <strong>the</strong>ir children’seducation. The goal is to increase <strong>the</strong> literacy skills of young children andassist <strong>the</strong> adults in <strong>the</strong> children’s lives in <strong>the</strong>ir own education and selfsufficiency.The district is partnering with <strong>the</strong> Snohomish County LiteracyCoalition, Snohomish County Health District and Snohomish CountyHuman Services.Parent Involvement and CommunityCollaborationParent and community involvement goes well beyond volunteeringin <strong>the</strong> classroom. Involvement means parents supporting <strong>the</strong>irchildren’s education by reading to <strong>the</strong>m at an early age, findingopportunities to learn and explore at home and in <strong>the</strong> community, placing ahigh value on education and ensuring that children are well fed, well restedand at school on time every day.Family stability is clearly associated with student achievement. On <strong>the</strong>2002 questionnaire responded to by third and sixth grade students taking<strong>the</strong> spring ITBS, students in both third and sixth grade who were enrolled38CLOSING THE ACHIEVEMENT GAP: A POLICY ACTION GUIDE
in more than one school during <strong>the</strong> year, scored on average 19 percentilepoints lower than students who did not experience those changes.Research shows that parent involvement is a complex activity, especiallyamong low-income families (Lewis, 2001). These parents often see a limitedrole for <strong>the</strong>mselves in <strong>the</strong>ir child’s education and <strong>the</strong>ir involvement in<strong>the</strong> school.The voices of disenfranchised parents and community members must beheard and <strong>the</strong>y must be empowered as advocates for <strong>the</strong>ir children. Engagingfamilies in culturally appropriate ways is critical to establishing <strong>the</strong>separtnerships.Community engagement is increasingly important as <strong>the</strong> general publicexpects more from <strong>the</strong>ir schools. The challenge is to engage <strong>the</strong> communityin ways that support student achievement and continuous improvement.Community engagement must occur at all levels, not just at <strong>the</strong> individualschool level. District-wide community engagement is necessary to securebroad-based support for district goals and initiatives, including districtdecisions about allocation of resources which may vary from school toschool based on need.<strong>School</strong> boards that engage <strong>the</strong> community in visioning, strategic planningand in o<strong>the</strong>r meaningful decision-making roles generally find greater communitysupport for <strong>the</strong> schools. As school boards work to eliminate <strong>the</strong>achievement gap, this partnership becomes even more important. There aremany examples of districts successfully inviting <strong>the</strong> community to participatein program planning and service delivery. Many districts successfullytap <strong>the</strong> resources of <strong>the</strong> community to provide extended learning opportunities,meet <strong>the</strong> needs of students who are not achieving and address culturaland language differences. The National <strong>School</strong> Boards Association(NSBA) has published a helpful guide to assist boards – The CommunityConnection: Case Studies in Public Engagement, available at www.nsba.org.Questions to Guide <strong>the</strong> Discussion1. How can community-based organizations, municipalities, social servicesand o<strong>the</strong>r agencies assist <strong>the</strong> school board in addressing <strong>the</strong>achievement gap?2. How is <strong>the</strong> board educating <strong>the</strong> community and parents about standardsand <strong>the</strong> WASL to gain community support for <strong>the</strong>m as a validmeans to show real student achievement?3. To what degree are parents taught about how <strong>the</strong> school system worksand how to be an advocate for <strong>the</strong>ir children?4. How is <strong>the</strong> district addressing language differences in parent engagementpractices? Are <strong>the</strong> strategies effective?“Parents exposed tohomelessness and currentlyresiding in a shelter ortransitional housing around<strong>the</strong> Jackson communitywere interviewed. Parentstold interviewers that (1)<strong>the</strong>y see all too well what ishappening to <strong>the</strong>ir childrenthrough homelessness; (2)<strong>the</strong>y were concerned abouthow poorly <strong>the</strong>ir childrenare doing in school; andmost important, (3) <strong>the</strong>ywere desperate to see <strong>the</strong>irchildren be able to succeed.Parents greatly feared <strong>the</strong>irchildren using drugs,becoming gang involved orgetting pregnant, but <strong>the</strong>ydid not know how toprevent it. Nor did parentsbelieve that <strong>the</strong>y werecapable of helping <strong>the</strong>irchildren be successful inschool or in life. Parentshad a sense that it wasbetter to let o<strong>the</strong>r peoplecare for <strong>the</strong>ir children andthat it was best to stayaway, as if <strong>the</strong>y were notgood enough to be involvedin <strong>the</strong>ir children’s care orschooling. They clearly didnot see <strong>the</strong>mselves as aresource to <strong>the</strong>ir children.”— Kathy BurgoyneCommunity in <strong>School</strong>sSnohomish CountyWASHINGTON STATE SCHOOL DIRECTORS’ ASSOCIATION39
5. To what degree are parents and community partners listened to forunderstanding how <strong>the</strong>y experience <strong>the</strong> district and schools?Policy Recommendations1. Develop and adopt a board philosophy about family outreach and involvement,including respecting family cultural values and norms and usingfamily strengths as <strong>the</strong> focus of parent involvement practices.2. Consistently use a variety of forms and means of communication toparents and <strong>the</strong> community and ensure that communication is provided toreach parents who do not speak English.3. Measure <strong>the</strong> effectiveness of <strong>the</strong> district’s current outreach strategies andparent involvement programs. Develop methods to continuously evaluateand hold <strong>the</strong> district accountable for effective parent involvement andcommunity engagement. Be ready to make changes if strategies andprograms have not demonstrated <strong>the</strong>mselves to be effective.4. Advocate and provide resources for home visits, especially to <strong>the</strong> homesof children entering kindergarten. Getting into <strong>the</strong>ir homes is a provenway to help families have a better understanding of <strong>the</strong> school’s expectationsand for staff to better understand families and cultures.5. Provide opportunities to enhance family-teacher relationships and to helpparents build a sense of community and partnership with o<strong>the</strong>r parents.6. Provide meaningful opportunities for parent and community participationin site teams, advisory committees and o<strong>the</strong>r decision-making groups.What <strong>School</strong> Districts Are DoingThe Finley <strong>School</strong> District (www.finleysd.org) adopted <strong>the</strong> GIMME FIVEprogram that asks every parent to provide a minimum of five volunteerhours within <strong>the</strong> school year. In <strong>the</strong> first seven months of <strong>the</strong> program,Finley had representation from 38 percent of its parents and 937 totalvolunteer hours. GIMME FIVE is a highly successful program that brings adiverse group of parents into <strong>the</strong> learning community.The Family Partnerships in <strong>the</strong> Seattle Public <strong>School</strong>s(www.seattleschools.org) seeks to increase <strong>the</strong> ability of schools to formeffective partnerships with all families. Each Family Partnership schoolutilizes <strong>the</strong> family involvement framework from John Hopkins University(www.scov.csos.jhu.edu). The framework includes six types of involvementthat help educators develop comprehensive programs of school-familycommunitypartnerships. The framework can be used by schools as a guidebut each school should choose those practices within <strong>the</strong> framework that40CLOSING THE ACHIEVEMENT GAP: A POLICY ACTION GUIDE
help achieve <strong>the</strong> school’s goals and meet <strong>the</strong> needs of its students andfamilies. A description of each type of involvement follows:Type 1 – Parenting: Assist families with parenting and child-rearing skills,understanding child and adolescent development, and setting home conditionsthat support children as students at each age and grade level. Assistschools in understanding families.Type 2 – Communicating: Inform families about school programs andstudent progress through effective school-to-home and home-to-schoolcommunications.Type 3 – Volunteering: Improve recruitment, training, work, and schedulesto involve families as volunteers and audiences at <strong>the</strong> school or ino<strong>the</strong>r locations to support students and school programs.Type 4 – Learning at Home: Involve families with <strong>the</strong>ir children in learningactivities at home, including homework and o<strong>the</strong>r curriculum-linkedactivities and decisions.Type 5 – Decision Making: Include families as participants in schooldecisions, governance, and advocacy through PTA/PTO, school councils,committees, and o<strong>the</strong>r parent organizations.Type 6 – Collaborating With <strong>the</strong> Community: Coordinate resources andservices for families, students, and <strong>the</strong> school with businesses, agencies,and o<strong>the</strong>r groups, and provide services to <strong>the</strong> community.The overall purpose of Seattle’s Family Partnerships is to improve studentachievement. Parent and community involvement is <strong>the</strong> means, not <strong>the</strong>end. The purpose of addressing parenting skills is to help families navigate<strong>the</strong> school system and achieve family literacy, not trying to change culturalor family practices.A key is establishing systems that support parents, as well as students, andto empower parents to support children’s learning. Relationship building is<strong>the</strong> first step to building trust so that parents can identify <strong>the</strong> services <strong>the</strong>yneed and <strong>the</strong> district can better meet <strong>the</strong>ir needs. One prospect is to colocateservices in <strong>the</strong> schools. Ano<strong>the</strong>r strategy is to sort school enrollmentby home language and <strong>the</strong>n use all means of making contact, includingholding meetings where <strong>the</strong> families are, not necessarily at school. The ideais to create cross-cultural competence for school personnel and for families.Assessment and AccountabilityAssessment and accountability are critical to closing <strong>the</strong> achievementgap. Assessments are <strong>the</strong> tools used to hold schools and districtsaccountable for student achievement. The state assessments(WASL and ITBS/ITED) are only one component, however, of an overallassessment system. <strong>School</strong>s that are implementing successful reforms havecomprehensive assessment systems for evaluating student achievement atWASHINGTON STATE SCHOOL DIRECTORS’ ASSOCIATION41
<strong>the</strong> classroom, grade level, school and district levels, including use of datato inform and individualize instruction, provide feedback to learners andmake program and resource decisions. The use of Level Tests to measureannual rate of growth in reading and ma<strong>the</strong>matics are currently used byseveral districts in <strong>Washington</strong> state.The state of Tennessee’s assessment and assessment information managementsystem provides for linking teachers to achievement of students in<strong>the</strong>ir classroom and for measuring gains students make during <strong>the</strong> schoolyear. According to researchers at <strong>the</strong> University of Tennessee’s Value-AddedResearch and Assessment Center, “if equity is defined as <strong>the</strong> opportunityand realization of each student to make appropriate academic growth eachyear, <strong>the</strong>n expectations for educators and students can be set in terms ofacademic growth rates” (Rivers and Sanders, 2000). More important,research has demonstrated that growth rates are primarily a function ofschools and teachers. Therefore, assessment systems should allow districtsto evaluate and monitor <strong>the</strong> variability among schools and teachers and use<strong>the</strong>se data to address <strong>the</strong> variability in teacher effectiveness and also toavoid assigning students to multiple ineffective teachers.With <strong>the</strong> passage of <strong>the</strong> No Child Left Behind (NCLB) Act 2001(www.nochildleftbehind.gov) increased flexibility will be accompanied bymuch greater accountability. <strong>State</strong>s, districts and schools will be held accountablefor <strong>the</strong> improvement in academic achievement of all studentsand for all students achieving proficient standards in core subject areas.Starting in 2002-3, states will be required to annually assess <strong>the</strong> Englishproficiency of English language learners. All students in grades 3-8 will betested annually in math and reading/language arts and at least once ingrades 10-12 beginning in 2005-6. Results of <strong>the</strong>se indicators will be <strong>the</strong>primary indicator of whe<strong>the</strong>r schools and districts are making adequateyearly progress. By 2007-8, students will be tested in science at prescribedgrade levels.In addition to <strong>the</strong>se testing requirements, <strong>the</strong> NCLB act will require schooldistricts receiving Title I funding to issue a report card including:<strong>Achievement</strong> results in math and reading<strong>Achievement</strong> results separated by race/ethnicity, disability, socioeconomiclevel, gender, migrant status, and English language learnerGraduation ratesNumber and names of schools identified as needing improvementbecause of insufficient annual yearly progressTeacher qualificationsWSSDA’s Hot Topics issue of July 2002 provides a comprehensive summaryof <strong>the</strong> requirements for districts under <strong>the</strong> new No Child Left Behind Act(wssda.org, under “Hot Topics”).42CLOSING THE ACHIEVEMENT GAP: A POLICY ACTION GUIDE
Finally, accountability must also include a continuous and vigilant effort toachieve equity, reduce disproportionality and guarantee equal access toquality through changes in policies and practices and a continuous reviewof <strong>the</strong> district’s progress. Boards must set clear goals to close <strong>the</strong> achievementgap, hold staff responsible for meeting those goals and set a time linefor goal accomplishment. Establishing a structure, such as an office ofequity and achievement, is recommended, as is regularly scheduled, publicreporting of progress.Questions to Guide <strong>the</strong> Discussion1. Does <strong>the</strong> district disaggregate data and report it in such a way to helpschools, teachers and <strong>the</strong> community understand <strong>the</strong> achievementgap?2. How is <strong>the</strong> district assessing annual student growth and using assessmentdata to determine which students need to have <strong>the</strong>ir academicachievement accelerated?3. Do <strong>the</strong> schools address <strong>the</strong> achievement gap in <strong>the</strong>ir school improvementplans?4. How is <strong>the</strong> district assessing progress and using <strong>the</strong> data to close <strong>the</strong>achievement gap?5. Is <strong>the</strong> present system for evaluation or placement of students denyingstudents access to challenging academic coursework?Policy Recommendations1. Develop and adopt policies that require schools to measure <strong>the</strong> growth ofstudents from <strong>the</strong>ir individual starting places but set goals that assurethat each child reaches standard.2. Establish measurable goals for closing <strong>the</strong> achievement gap for eachschool and for <strong>the</strong> district as a whole and report progress to <strong>the</strong> public ona regular basis.3. Use measures to evaluate <strong>the</strong> effectiveness of strategies implemented byschools to close <strong>the</strong> achievement gap.4. Establish a comprehensive data management system to provide continuousfeedback for improvement and assist <strong>the</strong> district in its work to close<strong>the</strong> achievement gap. This will require data systems that can disaggregatedata by race, gender, socio-economics and primary language as well asassessments that measure annual rate of progress.What <strong>School</strong> Districts Are DoingThe Lake <strong>Washington</strong> (www.lk-wash.wednet.edu) and Vancouver(www.vansd.org) school districts have made significant investments inWASHINGTON STATE SCHOOL DIRECTORS’ ASSOCIATION43
technology and professional development to effectively use real-time dataas part of <strong>the</strong> teaching and learning process so that teachers can address<strong>the</strong> individual needs of <strong>the</strong>ir students. In Vancouver schools, staff developedan assessment system internally to access student data and disaggregateit by several factors. They are working on real-time entry of data andaccess by classroom teachers. Lake <strong>Washington</strong> invested in a commercialassessment system that is standards-based and allows teachers to correlateclassroom work or tests with state standards and <strong>the</strong>n immediately disaggregate<strong>the</strong> data to analyze student performance. Parents and students canaccess data, and student work can be stored.44CLOSING THE ACHIEVEMENT GAP: A POLICY ACTION GUIDE
ConclusionsChanges of <strong>the</strong> past quarter century, including increasing diversity,are remaking this society. Many of <strong>the</strong>se changes havecontributed to growing economic and racial disparities. These societalchanges require educational leaders to restructure education. And thoughmany social and economic factors in society are outside <strong>the</strong> control ofschool boards, education remains <strong>the</strong> single, best hope to end society’sracial and economic disparities.Educational leaders must make <strong>the</strong> necessary changes in policies, structuresand practices to address <strong>the</strong>se changes and <strong>the</strong> disparities that exist. Allschool boards must invest in a plan for closing <strong>the</strong> achievement gap. Thispolicy action guide can be <strong>the</strong> foundation on which school boards build<strong>the</strong>ir plans for closing <strong>the</strong> gap.Progress is being made. On <strong>the</strong> 2002 ITBS, all ethnic groups made gains inreading. African American students made <strong>the</strong> greatest gains in both readingand ma<strong>the</strong>matics. The most sizable gains were made by non-white studentsin ma<strong>the</strong>matics.Progress also continues with respect to student access to rigorouscoursework. OSPI reports that <strong>the</strong> number of low-income and minoritystudents in Advanced Placement classes is also increasing. <strong>Washington</strong>realized a 42 percent increase from <strong>the</strong> previous year in <strong>the</strong> number ofHispanic students taking AP classes while nationally <strong>the</strong> increase was only16 percent. For black students, <strong>the</strong> increase this past year was 24 percent in<strong>Washington</strong> and only 11 percent nationally. Over <strong>the</strong> past three years,<strong>Washington</strong> doubled <strong>the</strong> number of low-income students enrolled in APclasses from 655 to 1,308.The progress must continue. <strong>Closing</strong> <strong>the</strong> gap is a developmental processthat will require districts to make substantial changes in resource alloca-“Though <strong>the</strong> number ofcases is small, <strong>the</strong>re areschools where no achievementgap exists, and <strong>the</strong>reare students who achieve athigh levels despite <strong>the</strong>incredible odds against<strong>the</strong>m. These bright spots ofsuccess provide us with awindow through which wecan examine what might bepossible if we lived in asociety that truly valuedchildren and was genuinelycommitted to equity andhigh quality for all.”— Pedro Nogueraand Antwi AkomHarvard UniversityWASHINGTON STATE SCHOOL DIRECTORS’ ASSOCIATION45
tion, learning environments, programs and staffing. To implement <strong>the</strong>sechanges, school boards must first provide <strong>the</strong> structure that supports andbuilds capacity for change. The structure must be in place to sustain effortsof systemic change that will result in closing <strong>the</strong> achievement gap. Policiesare <strong>the</strong> vehicle school boards use to establish <strong>the</strong> structure and createchange.If society really believes that all children can learn and that economicstatus, race and culture should not be predictors of academic achievement,<strong>the</strong>n policy makers cannot rationalize or protect current policies or practicesthat do not support <strong>the</strong>se beliefs. The necessary capacity must becreated for <strong>the</strong> schools to close <strong>the</strong> achievement gap by addressing <strong>the</strong> keypolicy issues identified in this report. The role of policymaker has neverbeen so important.46CLOSING THE ACHIEVEMENT GAP: A POLICY ACTION GUIDE
<strong>State</strong>wide 3rd Grade ITBS Results: 1999-20021999Ma<strong>the</strong>matics Reading R/M Composite200020012002199920002001200219992000200120020 10 20 30 40 50 60 70 80All StudentsAmerican IndianAsian/Pacific IslanderBlack/African AmericanHispanicWhiteWASHINGTON STATE SCHOOL DIRECTORS’ ASSOCIATION47
<strong>State</strong>wide 6th Grade ITBS Results: 2000-20022000Reading Ma<strong>the</strong>matics Language Arts Core200120022000200120022000200120022000200120020 10 20 30 40 50 60 70 80All StudentsAmerican IndianAsian/Pacific IslanderBlack/African AmericanHispanicWhite48CLOSING THE ACHIEVEMENT GAP: A POLICY ACTION GUIDE
O<strong>the</strong>r PolicyRecommendationsTo solve <strong>the</strong> complex problem of <strong>the</strong> achievement gap, <strong>the</strong>re mustbe cooperation of policy makers at many levels. The WSSDAAd Hoc <strong>Achievement</strong> <strong>Gap</strong> Task Force offers <strong>the</strong> following recommendationsto be considered by o<strong>the</strong>r policy groups.Higher EducationCollaborate and connect K-12 education and higher education toaddress issues of disproportionality. This partnership can begin withteacher preparation programs that are developed in partnership withK-12 education so that future teachers are well qualified to teachstudents from diverse backgrounds. The Task Force supports <strong>the</strong>concept of creating “professional development schools” in which preserviceteachers are trained in schools that reflect <strong>the</strong> diversity ofstudents and <strong>the</strong> challenges of education reform. These professionaldevelopment schools would have preservice teachers work with expertpractitioners and give veteran teachers opportunities to renew <strong>the</strong>irown professional development.Support high quality professional development for new and experiencedteachers in cooperation with K-12. Higher education can play asignificant role in helping teachers deepen and broaden <strong>the</strong>ir skills andknowledge in working with diverse learners.Incorporate cultural competence and <strong>the</strong> home-parent partnership inteacher preparation curricula.Encourage policies that support a program of incentives and generousscholarships for highly qualified individuals who want to teach in highpoverty and ethnically diverse schools.WASHINGTON STATE SCHOOL DIRECTORS’ ASSOCIATION49
Train teachers to meet <strong>the</strong> demands of diverse student populations,including required coursework in teaching English language learners.Family Support and LiteracyTo close <strong>the</strong> readiness gap, adult literacy initiatives must be shifted tofamily literacy programs. Developing literacy and language withinfamilies recognizes <strong>the</strong> significant influence that parents have on <strong>the</strong>irchild’s development and supports families in providing that positiveinfluence.Family and community stability continues to influence children’ssuccess in schools. Research related to dropping out of school showsthat students who move frequently tend to drop out of school at fargreater rates. The academic achievement of students from highlymobile families also tends to be lower. Family support policies shouldrecognize <strong>the</strong> benefits of family and community stability to childrenand provide support systems and incentives for families to remain in<strong>the</strong>ir community, especially during <strong>the</strong>ir children’s early school experience.Early Childhood EducationInvest in expanding quality preschool programs, particularly for disadvantagedchildren, and providing full-day kindergarten programs.Research on both quality preschool and full-day kindergarten providescompelling evidence that both strategies significantly increase studentsuccess in school.Improve <strong>the</strong> preschool experiences for three- and four-year olds byemphasizing <strong>the</strong> teaching of cognitive skills with preschool teachershighly qualified to do so. Support continued work to align K-12 EssentialAcademic Learning Requirements and benchmarks with birth tofive education.Support <strong>the</strong> position of <strong>the</strong> National Association for <strong>the</strong> Education ofYoung Children and <strong>the</strong> International Reading Association calling fora professional preparation system to ensure that staff in early childhoodprograms and teachers in primary schools have specializededucation that informs <strong>the</strong>m about developmental patterns in earlyliteracy learning and about research-based ways of teaching earlyreading and writing.K-12 EducationSupport legislation to create small schools. As reported by Anne Lewisin ADD IT UP: Using Research to Improve Education for Low-income andMinority Students, several studies have found that as schools increasedin size so did <strong>the</strong> negative effects of poverty on student achievement.“The well-documented correlation between poverty and low achieve50CLOSING THE ACHIEVEMENT GAP: A POLICY ACTION GUIDE
ment is as much as ten times stronger in larger schools than in smallerones.”Increase support for smaller class size, especially in grades K-4 andpass legislation for funding full-day kindergarten. Smaller class size,especially at <strong>the</strong> primary level, continues to be associated with higheracademic achievement, especially for disadvantaged children. TheNSBA Policy Research of Fall, 1999, Sizing it Right: Class Size-reductionand Student <strong>Achievement</strong>, reported that Wisconsin’s SAGE programwhich targets schools with 50 percent or more poverty and limits classsize to 15 for grades K-3, found like <strong>the</strong> Tennessee STAR study, thatstudents significantly outperformed <strong>the</strong>ir peers in o<strong>the</strong>r classrooms.Moreover, <strong>the</strong> black-white achievement gap narrowed while it widenedin o<strong>the</strong>r classrooms. The most recent longitudinal results from <strong>the</strong>STAR project also provided clear evidence that past attendance in asmall class raised <strong>the</strong> average score on <strong>the</strong> ACT or SAT exam.Support legislation for increased funding and more predictable fundingfor K-12 education that eliminates crisis budget planning.Improve <strong>the</strong> disaggregation of student achievement data to avoidmaking overgeneralizations of ethnic groups and to assist in moreappropriate planning and decision-making for individual students.Support research and demonstration projects, along with disseminationstrategies, to identify and replicate promising school and districtwidepractices that effectively close <strong>the</strong> achievement gap.WASHINGTON STATE SCHOOL DIRECTORS’ ASSOCIATION51
ReferencesBrumbaugh, S. (1997). “The Link Between <strong>School</strong> Readiness and Student<strong>Achievement</strong>.” Updating <strong>School</strong> Board Policies. National <strong>School</strong> BoardsAssociation, vol.27, nos. 3 and 4.Bylsma, Pete. (2001). Analysis of Student Outcomes by Race/Ethnicity andSocioeconomic Status. Report presented by <strong>the</strong> Director of Research andEvaluation, Office of <strong>the</strong> Superintendent of Public Instruction.Finn, J., (March 2002). “Small Classes in American <strong>School</strong>s: Research,Practice and Politics.” Phi Delta Kappan, vol.83, no. 7.Fowler-Finn, T., Superintendent, Fort Wayne Community <strong>School</strong>s, FortWayne, Indiana. (www.fwcs.k12.in.us).Haycock, Kati. (Summer 1998). “Good Teaching Matters…A Lot.” ThinkingK-16, Publication of Education Trust, vol. 3, no.2.Haycock, Kati. (2001). “Dispelling <strong>the</strong> Myth, Revisited,” The EducationTrust. (www.edtrust.org/main/documents/DTMreport.pdf)Hopkins, P. & Katims, N. (Summer 2002) “A Longitudinal Study of FulltimeKindergarten.” Leadership Information, Publication of <strong>School</strong> Informationand Research Service, vol.1.no.3.No Child Left Behind, WSSDA Hot Topics. (July 2002). A publication of<strong>the</strong> <strong>Washington</strong> <strong>State</strong> <strong>School</strong> <strong>Directors</strong>’ Association. (wssda.org)Lewis, A. in collaboration with Paik, S. (2001). Add It Up: Using Research toImprove Education for Low-income and Minority Students. <strong>Washington</strong>, DC:Poverty & Race Research Action Council.McNeely, C., Nonnemaker, J. & Blum, R. ( April 2002) “Promoting <strong>School</strong>Connectedness: Evidence from <strong>the</strong> National Longitudinal Study ofAdolescent Health.” Journal of <strong>School</strong> Health, vol. 72, no. 4.WASHINGTON STATE SCHOOL DIRECTORS’ ASSOCIATION53
National Assessment of Educational Progress. (www.nces.ed.gov/nationsreportcard/).National Association for <strong>the</strong> Education of Young Children, Learning to Readand Write: Developmentally Appropriate Practices for Young Children, 1998.(www.naeyc.org/resources/position_statements/psread98.pdf)National Education Commission on Time and Learning. Report: Prisoners ofTime. (www.ed.gov/pubs/Prisonersoftime).No Child Left Behind, (www.nochildleftebehind.gov)Noguera, P. & Akom, A. (June 2000). “The Significance of Race in <strong>the</strong>Racial <strong>Gap</strong> in Academic <strong>Achievement</strong>.” In Motion Magazine.(www.inmotionmagazine.com/pnaa.html).Odden, A. & Archibald, S. (2001). Reallocating Resources: How to BoostStudent <strong>Achievement</strong> Without Asking for More. Thousand Oaks, CA:Corwin.Padrón,Y. & Waxman, H. et al. (Nov. 2000). Improving Classroom Instructionand Student Learning for Resilient and Non-resilient English Language Learners.Santa Cruz, CA. Center for Research in Education, Diversity andExcellence (CREDE).Payne, Ruby K. (1998). A Framework for Understanding Poverty. Highlands,TX: RFT Publishing.Reducing <strong>the</strong> Risk: Connections that Make a Difference in <strong>the</strong> Lives of Youth.Division of General Pediatrics and Adolescent Health, University ofMinnesota, Box 721, 420 Delaware Street SE, Minneapolis, MN55455.Sadowski, M. (May - June 2001). “<strong>Closing</strong> <strong>the</strong> <strong>Gap</strong> One <strong>School</strong> at a Time.”Harvard Education Letter Research Online. (www.edletter.org).Sanders, W.L. and Rivers, J.C. (November 1996). Cumulative and ResidualEffects of Teachers on Future Student Academic <strong>Achievement</strong>. Knoxville, TN,Value-Added Research and Assessment Center, University of Tennessee.Seattle Post-Intelligencer – Special Reports. <strong>School</strong> Discipline: An Uneven Hand.(www.seattlepi.nwsource.com/morespecialreports).<strong>State</strong> of <strong>Washington</strong> Academic <strong>Achievement</strong> and Accountability Commission.(December 2001). Report to <strong>the</strong> <strong>Washington</strong> <strong>State</strong> Legislature: FourthGrade Reading Improvement in <strong>School</strong> Districts and <strong>School</strong>s.The College Board. 2001 AP Summary Report, Public <strong>School</strong>s, All <strong>State</strong>s byEthnic Group. (www.collegeboard.com).<strong>Washington</strong> <strong>School</strong> Research Center. (2001). A Research Report: Bridging <strong>the</strong>Opportunity <strong>Gap</strong>: How <strong>Washington</strong> Elementary Students are Meeting <strong>Achievement</strong>Standards. Seattle Pacific University.54CLOSING THE ACHIEVEMENT GAP: A POLICY ACTION GUIDE
Waymack N. & Drury, D. (Summer/Fall 1999). “Sizing It Right: Class-sizeReduction and Student <strong>Achievement</strong>.” National <strong>School</strong> Boards AssociationPolicy Research Brief. vol.1.no.1.WASHINGTON STATE SCHOOL DIRECTORS’ ASSOCIATION55
Presentations Made to <strong>the</strong>Ad Hoc <strong>Achievement</strong> <strong>Gap</strong>Task ForceApril 2001Pete Bylsma, Office of <strong>the</strong> Superintendent of Public Instruction (OSPI)Presentation on disaggregated WASL dataJohn Pope and Gia Tran of OSPIPresentation on <strong>the</strong> OSPI Unity ProjectJune 2001Ricardo Sanchez, Director of <strong>the</strong> Latino/a Educational <strong>Achievement</strong> Project(LEAP)Presentation on Project LEAP to improve educational achievementSteve Nelson, Director of Planning, <strong>the</strong> Northwest Regional EducationLaboratory (NWREL)Review of research identifying factors in students’ lives and in schoolsthat impact learningJerry Miller, Issaquah <strong>School</strong> DistrictPresentation on <strong>the</strong> “culture” of poverty based on Ruby Payne’s researchand book A Framework for Understanding PovertyLynn Fielding, Kennewick <strong>School</strong> Board and Task Force MemberPresentation on early childhood learning readinessAugust 2001Richard Catalano, Social Development Research Group, University of<strong>Washington</strong>Risk and protective factor researchWASHINGTON STATE SCHOOL DIRECTORS’ ASSOCIATION57
Gary Wilson Principal and Linda Hahn, Assistant Principal, LochburnMiddle <strong>School</strong>, Clover Park <strong>School</strong> District and Linda Fisher, Principal,Stevenson Elementary <strong>School</strong>, Bellevue <strong>School</strong> DistrictPresentations on high achieving, low socio-economic schoolsWendy Roedell, Puget Sound ESDEarly childhood learning standards: overview of <strong>the</strong> importance of earlychildhood educationGene Schmidt, Superintendent, Bridgeport <strong>School</strong> District and The LearningSpace’s Administrator of <strong>the</strong> YearPresentation on <strong>the</strong> digital divideRebecca Novick and Maureen Carr, NWRELPresentation on issues in literacy: A review of <strong>the</strong> advancement of“standard” literacy in us history to cognitive literacy expected todayGeneva Gay, University of <strong>Washington</strong>, Center for Multicultural EducationThe importance of multicultural education: Assumptions that needrethinkingSeptember 2001Thomas Cone, Assistant Superintendent, Vancouver <strong>School</strong> DistrictPersonalized plans for students with screening, diagnosis and a prescriptionfor mastery and <strong>the</strong> use of alternative state measures for demonstratingstudent growthAndrew Griffin, Office of <strong>the</strong> Superintendent of Public Instruction (OSPI)Review of Superintendent Terry Bergeson’s announcement of <strong>the</strong> 2001WASL resultsJanuary 2002Cherri Brondstetter, Wenatchee <strong>School</strong> District Teacher and RichardGomez, OSPIEffectiveness of dual language programs and o<strong>the</strong>r best practices forEnglish language learnersStephen Fink, University of <strong>Washington</strong>, Center for Educational LeadershipCEL’s mission of closing <strong>the</strong> achievement gap by providing training in<strong>the</strong> necessary will and savvy to make <strong>the</strong> changes needed58CLOSING THE ACHIEVEMENT GAP: A POLICY ACTION GUIDE
March 2002Pat Wasley, Dean of <strong>the</strong> University of <strong>Washington</strong>’s <strong>School</strong> of EducationMission and vision of <strong>the</strong> <strong>School</strong> of EducationGeri Lim, CFO Seattle Public <strong>School</strong>sSeattle Public <strong>School</strong>s’ weighted student formula and <strong>the</strong> district’ssystem for allocating “central office resources”John Bowden, A+ CommissionDisaggregated data of student learning and program placementKathleen Plato, OSPIAdvanced Placement and <strong>the</strong> achievement gapPriscilla Zimmerman and Cynthia Chesak, Tukwila <strong>School</strong> DistrictHow <strong>the</strong> arts assist in meeting <strong>the</strong> essential academic learning requirementsApril 2002Bunker Frank, <strong>State</strong> Board of Education; Jan Storm, Washougal <strong>School</strong>District, Mike Loretz, Title I Distinguished Educator in Oregon; BenWright, Principal at Seattle’s Thurgood Marshall Intermediate <strong>School</strong>; JeanSmart, a former Edmonds Principal now with <strong>the</strong> Seattle District; andBarbara Greenberg of <strong>the</strong> Task Force and <strong>the</strong> Yakima <strong>School</strong> BoardModified school calendars and advantages to year round calendarsJune 2002Adie Simmons, Seattle Public <strong>School</strong>s and <strong>the</strong> Family Partnerships ProgramParent and community involvementWASHINGTON STATE SCHOOL DIRECTORS’ ASSOCIATION59
Notes