BASIC CONCEPTS OF MEASUREMENTS
BASIC CONCEPTS OF MEASUREMENTS
BASIC CONCEPTS OF MEASUREMENTS

You also want an ePaper? Increase the reach of your titles
YUMPU automatically turns print PDFs into web optimized ePapers that Google loves.
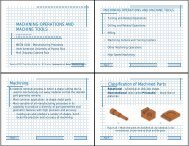
MECN 4600 Design of Experiment and InstrumentationINTRODUCTION<strong>BASIC</strong> <strong>CONCEPTS</strong> <strong>OF</strong> <strong>MEASUREMENTS</strong>The process or the act of measurement consists of obtaining a quantitative comparisonbetween a predefined Standard and Measurand.The word Measurand is used to designate the particular physical parameter beingobserved and quantified; that is, the input quantity to the measuring process. (A physicalquantity, property or condition to be measured)A Measurement is an act of assigning a specific value to a physical variable. Thatphysical variable becomes the Measured Variable.The standard of comparison must be of the same character as the measurand, and usuallyis prescribed and defined by a legal or recognized agency or organization.Example:NIST : The National Institute of Standards and Technology.NBS : The National Bureau of Standards.ISO : The International Organization for Standardization.ANSI : The American National Standards Institute.The engineer is not only interested in the measurement of physical variables but alsoconcerned with their control. The two function are closely related, however because onemust be able to measure a variable such as temperature or flow in order to control it. Theaccuracy of control is necessarily dependent on the accuracy of measurement.Created by Amílcar A. Rincón Charris 1
MECN 4600 Design of Experiment and InstrumentationMeasurement is also a fundamental element of any control process.Statistical techniques are available for analyzing data to determine expected errors anddeviations from the true measurements. The engineer must be familiar with thesetechniques in order to analyze the data effectively.The Generalized Measurement SystemMost measurement system may consist of part or all of four general stages:a) A sensor – Transducer Stage.b) An Intermediate Stage or signal – Conditioning Stage.c) A Terminating Stage – Output Stage.d) Feedback – Control Stage.Sensor – Transducer StageThe primary function of the first stage is to detect or to sense the physical variable(Measurand) and performs either a mechanical or an electrical transformation to convertthe signal into a more usable form.The sensor is a physical element that employs some natural phenomenon by which itsenses the variable being measured. The transducer converts this sensed information intoa detectable signal form, which might be electrical, mechanical, optical, etc. In mostcases, however, the physical variable is transformed into an electric signal because this isthe form of signal that is most easily measured.Signal – Conditioning StageThe purpose of the second stage is to take the transducer signal and modifies byamplification, filtering or other means so that a desirable output is available.Output StageProvides an indication of the value of the measurement. The output equipment might be asimple readout display a marked scale or might contain devices that can record the signalfor later analysis. Examples of these devices are tape recorders, chart recorders andcomputer disk drives.Feedback – Control StageIn those measurement systems involved in process control a fourth stage the feedbackcontrol stage, contains a controller that interprets the measured signal and makes adecision regarding the control of the process. This decision results in a change in aprocess parameter that affects the magnitude of the sensed variable.It is very important to realize that the accuracy of control cannot be any better than theaccuracy of the measurement of the control variable.Therefore one must be able to measure a physical variable accurately before one can hopeto control the variable.Created by Amílcar A. Rincón Charris 2
MECN 4600 Design of Experiment and InstrumentationA schematic diagram of the generalized measurement system is shown below.The overall schematic of the generalized measurement systems is quite simple and as onemight suspect the difficult problems are encountered when suitable devices are sought tofill the requirements of each of the boxes on the schematic diagram.Definition of TermsThe following terms are often employed to describe the quality of an instruments reading.Range (Campo de Medida)The region between the limits within which a quantity is measured, received ortransmitted, expressed by starting the lower and upper range values.Example: 0 to 150 o F, 20 to 200 psi.Span (Amplitud o Alcance)The algebraic difference between the upper and lower range values.For example:a) Range 0 to 150 o F , span 150 o F.b) Range -20 to 200 o F, span 220 o F.c) Range 20 to 150 psi, span 130 psi.Created by Amílcar A. Rincón Charris 3
MECN 4600 Design of Experiment and InstrumentationElevated Zero Range (Rango con elevación de cero)A range in which the zero value of the measured variable, measured signal, is greaterthan the lower range value.Example:-25 to 50 psi.Suppressed Zero Range (Rango con supresión de cero)A range in which the zero value of the measured variable is less than the lower rangevalue.Example:20 to 100 psi.Measured Variable (Variable Medida)A quantity property or condition that is measured. Sometimes referred to as themeasurand. Example: Temperature, Pressure, rate of flow.Measured Signal (Señal Medida)The electrical, mechanical, pneumatic or other variable applied to the input of a device. Itis the analog of the Measured Variable produced by a transducer.Example:In a thermocouple thermometer, the measured signal is an emf which is the electricalanalog of the temperature applied to the thermocouple.In a flow meter, the measured signal may be a differential pressure which is the analog ofthe rate of flow through the orifice.In a electric tachometer system, the measured signal may be a voltage which is theelectrical analog of the speed of rotation of the part coupled to the tachometer generator.Output Signal (Señal de Salida)A signal delivered by a device, element or system.Accuracy (Exactitud)The accuracy of an instrument indicates the deviation of the reading from a known valueaccuracy is typically expressed as:1. Percentage of full scale reading (upper range value). Example:A 100 Kpa pressure gage having an accuracy of ± 1 % would be accurate of± 1 Kpa over the entire range of the gage.Created by Amílcar A. Rincón Charris 4
MECN 4600 Design of Experiment and Instrumentation2. Percentage of span. Example:A pressure gage has span of 200 Kpa, Accuracy of ± 0.5%.To one reading of 150 Kpa is taken, then the true value of measurement will bebetween0.5x200150 ± = 150 ± 1100or 149 Kpa and 151 Kpa.3. Measured Variable Accuracy of ± 1 Kpa, over all ranges of the Instrument.4. Percentage of the actual reading. Thus, for a ± 2% of reading voltmeter, wewould have an inaccuracy of ± 0.04 volts for a reading of 2 volts.PrecisionThe difference between the instruments reported values during repeated measurements ofthe same quantity. Typically, this value is determined by statistical analysis of repeatedmeasurement.RepeatabilityIs the ability of an instrument to reproduce the same measurement each time the same setof conditions is repeated. This does not imply that the measurement is correct, but ratherthat the measurement is the same each time.Example:The concept of accuracy and repeatability in measurements can be illustrated by thethrow of darts.Created by Amílcar A. Rincón Charris 5
MECN 4600 Design of Experiment and InstrumentationIn summarya) Poor Repeatability means poor Accuracy.b) Good Accuracy means good repeatability.c) Good Repeatability does not necessarily mean good Accuracy.Repeatability does not include Hysteresis.Sensitivity (Sensibilidad)The change of an instrument or transducer output per unit change in the measuredquantity. A more sensitive instrument reading changes significantly in response tosmaller changes in the measured quantity. Typically an instrument with higher sensitivitywill also have better repeatability and higher accuracy.ResolutionThe smallest increment of change in the measured valve that can be determined from theinstrument readout scale.Dead Band (Banda Muerta)In process instrumentation the range through which an input signal may be varied uponreversal of direction, without initiating an observable change in output signal. Dead bandis usually expressed in percent of span.HysteresisAn instrument is said to exhibit hysteresis when there is a difference in readingsdepending an whether the value of the measured quantity is approached from above orbelow. Hysteresis results from the inelastic quantity of an element or device. In otherword, it may be the result of mechanical friction, magnetic effects, elastic deformation, orthermal effects. Hysteresis is expressed in percent of span. Dead band term is included inthe hysteresis.Created by Amílcar A. Rincón Charris 6
MECN 4600 Design of Experiment and InstrumentationExample 1A temperature transducer has a range of 20 o to 250 o C. A measurement results in a valueof 55 o C for the temperature. Compare the errors if the accuracy is:a) ± 0.5 % FS.b) ± 0.75 % of span.c) ± 0.8 % of reading.What is the possible temperature in each case?Solution:o0.5%(250 C)oa) Error = ±= ± 1.25 C100%Thus, the actual temperature is in the range 53.75 o C and 56.25 o C.o0.75%.(250 − 20) Cob) Error = ±= ± 1.725 C100%Thus, the actual temperature is in the range 53.275 o C and 56.725 o C.o0.8%(55 C)c) Error = ±= ± 0. 44100%Thus, the actual temperature is in the range 54.46 o C and 55.44 o C.Example 2Two pressure instruments with a range of 0 to 100 psi are measuring a process value of50 psi. The accuracy of both devices is ± 1% FS. Data obtained from five measurementsare listed in the following table; determine which instrument has a greater degree ofrepeatability.Measurement Instrument A (psi) Instrument B (psi)1 49.9 49.92 49.7 49.63 50.1 50.44 49.8 49.75 50.2 50.5Solution:From the measurements shown, it can be seen that the instrument A is more repeatable.The measurements from both instruments are within the tolerance expressed by the ± 1%accuracy stated ( ± 1 psi).Created by Amílcar A. Rincón Charris 7
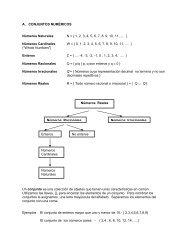
MECN 4600 Design of Experiment and InstrumentationExample 3A force sensor measures a range of 0 to 150 N with a resolution of 0.1% FS. Find thesmallest change in force than can be measured.Solution:Because the resolution is 0.1% FS, we have a resolution of:Resolution =0.1%(150N)100%= 0.15NWhich is the smallest measurable change in force.StandardsIn order that investigator in different parts of the country and different parts of the worldmay compare the results of their experiments on a consistent basis. It is necessary toestablish certain standard units of length, mass, time, temperature, pressure, etc. TheNational Institute of Standards and Technology (NIST) have the primary responsibilityfor maintaining these standards in the United States.A Dimension defines a physical variable that is used to describe some aspect of aphysical system. The fundamental value associated with any dimension is given by aUnit.A Unit defines a measure of a dimension.DimensionLengthMassTimeUnitMeterKilogramSecondFundamental Dimension: Length, Mass, Time, Temperature, Electrical Current,Luminous Intensity.Derived Dimension: Acceleration, Area, Density, Velocity and Force.A Primary Standard defines the value of a unit it provides the means to describe the unitwith a unique number that can be understood throughout the world. The primary standardthen assigns a unique value to a unit by definition.Created by Amílcar A. Rincón Charris 8
MECN 4600 Design of Experiment and InstrumentationThe standard of length:The meter is defined as the length of a platinum-Iridium bar maintained to certainspecified condition at the International Bureau of Weights and Measured.1 foot = 0.30480060 meters.1 inch = 0.02540005 meters.The standard of Mass:The kilogram is defined as the mass of a particular platinum-Iridium bar which ismaintained under very specified conditions at the International Bureau of Weights andMeasured.1 lbm = 0.45359237 Kg.The standard of time:The second has been defined as 1/86400 of a mean solar day. The solar day is measuredas the time interval between two successive transits of the sun across a meridian of theearth.Standards of TemperatureThe basic unit of temperature, the Kelvin, K, is defined as the fraction 1/273.16 of thethermodynamic temperature of the triple point of water, the temperature at which thesolid, liquid, and vapor phases of water exist in equilibrium.o C = K – 273.15o F = o R – 459.67o F = 1.8 o C + 32Electrical StandardsAll electrical units originate from the definition of the Ampere. One ampere is the currentthat produce a magnetic force of 2*10 -7 N/m on a pair of thin parallel wires carrying thatcurrent and separated by 1 m. The remaining electrical units, such as volts and ohms, canall be derived from the value of the ampere and the basic units of mass, length and time.Created by Amílcar A. Rincón Charris 9
MECN 4600 Design of Experiment and InstrumentationSTANDARD GRAPHICS SYMBOLS FOR PROCESS CONTROLAND INSTRUMENTATIONIn the measurement and control field a standard set of symbols is used to prepare drawingof control systems and processes. The symbols used in these drawing are generally basedon Instrument Society of America (ISA) and American National Standards Institute(ANSI), standard ANSI / ISA S5.1.A typical application for this standard is Process and Instrumentation Diagrams (P&ID).This type of drawing shows the interconnection of process equipment and theinstrumentation used to control loops.Created by Amílcar A. Rincón Charris 10