Predicting Cardiovascular Risks using Pattern Recognition and Data ...
Predicting Cardiovascular Risks using Pattern Recognition and Data ...
Predicting Cardiovascular Risks using Pattern Recognition and Data ...

You also want an ePaper? Increase the reach of your titles
YUMPU automatically turns print PDFs into web optimized ePapers that Google loves.
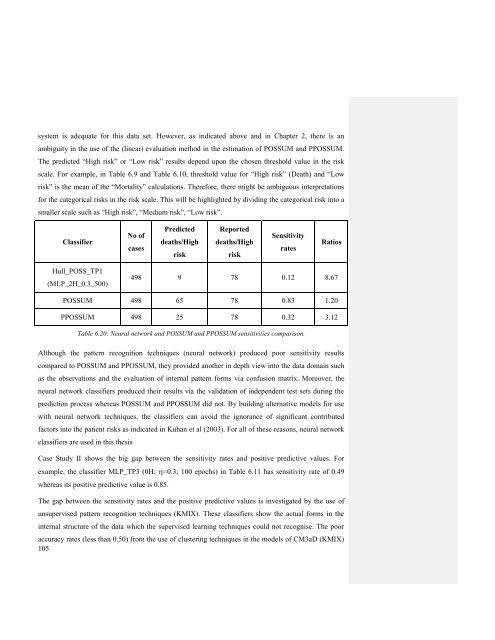
system is adequate for this data set. However, as indicated above <strong>and</strong> in Chapter 2, there is anambiguity in the use of the (linear) evaluation method in the estimation of POSSUM <strong>and</strong> PPOSSUM.The predicted “High risk” or “Low risk” results depend upon the chosen threshold value in the riskscale. For example, in Table 6.9 <strong>and</strong> Table 6.10, threshold value for “High risk” (Death) <strong>and</strong> “Lowrisk” is the mean of the “Mortality” calculations. Therefore, there might be ambiguous interpretationsfor the categorical risks in the risk scale. This will be highlighted by dividing the categorical risk into asmaller scale such as “High risk”, “Medium risk”, “Low risk”.ClassifierNo ofcasesPredicteddeaths/HighriskReporteddeaths/HighriskSensitivityratesRatiosHull_POSS_TP1(MLP_2H_0.3_500)498 9 78 0.12 8.67POSSUM 498 65 78 0.83 1.20PPOSSUM 498 25 78 0.32 3.12Table 6.20: Neural network <strong>and</strong> POSSUM <strong>and</strong> PPOSSUM sensitivities comparison.Although the pattern recognition techniques (neural network) produced poor sensitivity resultscompared to POSSUM <strong>and</strong> PPOSSUM, they provided another in depth view into the data domain suchas the observations <strong>and</strong> the evaluation of internal pattern forms via confusion matrix. Moreover, theneural network classifiers produced their results via the validation of independent test sets during theprediction process whereas POSSUM <strong>and</strong> PPOSSUM did not. By building alternative models for usewith neural network techniques, the classifiers can avoid the ignorance of significant contributedfactors into the patient risks as indicated in Kuhan et al (2003). For all of these reasons, neural networkclassifiers are used in this thesisCase Study II shows the big gap between the sensitivity rates <strong>and</strong> positive predictive values. Forexample, the classifier MLP_TP3 (0H; =0.3; 100 epochs) in Table 6.11 has sensitivity rate of 0.49whereas its positive predictive value is 0.85.The gap between the sensitivity rates <strong>and</strong> the positive predictive values is investigated by the use ofunsupervised pattern recognition techniques (KMIX). These classifiers show the actual forms in theinternal structure of the data which the supervised learning techniques could not recognise. The pooraccuracy rates (less than 0.50) from the use of clustering techniques in the models of CM3aD (KMIX)105