queensland - National Drug and Alcohol Research Centre
queensland - National Drug and Alcohol Research Centre
queensland - National Drug and Alcohol Research Centre

You also want an ePaper? Increase the reach of your titles
YUMPU automatically turns print PDFs into web optimized ePapers that Google loves.
<strong>queensl<strong>and</strong></strong>Rebecca Rainbow, Lucy Kennedy, Joanne Cassar, <strong>and</strong> Rosa AlatiQLD DRUG TRENDS 2009Findings from theIllicit <strong>Drug</strong> Reporting System (IDRS)Australian <strong>Drug</strong> Trends Series No. 45
QUEENSLANDDRUG TRENDS2009Findings from theIllicit <strong>Drug</strong> Reporting System(IDRS)Rebecca Rainbow, Lucy Kennedy, Joanne Cassar<strong>and</strong> Rosa AlatiQueensl<strong>and</strong> <strong>Alcohol</strong> <strong>and</strong> <strong>Drug</strong> <strong>Research</strong> <strong>and</strong> Education <strong>Centre</strong>Australian <strong>Drug</strong> Trends Series No. 45ISBN 978-0-7334-2866-1©NDARC 2010This work is copyright. You may download, display, print <strong>and</strong> reproduce this material in unaltered form only (retaining thisnotice) for your personal, non-commercial use or use within your organisation. All other rights are reserved. Requests <strong>and</strong>enquiries concerning reproduction <strong>and</strong> rights should be addressed to the information manager, <strong>National</strong> <strong>Drug</strong> <strong>and</strong> <strong>Alcohol</strong><strong>Research</strong> <strong>Centre</strong>, University of New South Wales, Sydney, NSW 2052, Australia.
TABLE OF CONTENTSLIST OF TABLES ............................................................................................................. IIILIST OF FIGURES ........................................................................................................... IIIACKNOWLEDGEMENTS ..................................................................................................... VIIIABBREVIATIONS...................................................................................................................IXEXECUTIVE SUMMARY ..........................................................................................................X1 INTRODUCTION ........................................................................................................ 11.1 Study aims ................................................................................................................ 12 METHOD................................................................................................................... 22.1 Survey of injecting drug users (IDU)....................................................................... 22.2 Survey of Key Experts (KE) ..................................................................................... 32.3 Other indicators ....................................................................................................... 33 RESULTS.................................................................................................................... 53.1 Overview of the IDU sample.................................................................................... 53.2 <strong>Drug</strong> use history <strong>and</strong> current drug use .................................................................... 63.3 Polydrug use history of the sample.......................................................................... 83.4 An important note to the reader............................................................................... 84 HEROIN ...................................................................................................................114.1 Use...........................................................................................................................114.2 Preparation <strong>and</strong> Colour...........................................................................................124.3 Price.........................................................................................................................144.4 Availability...............................................................................................................164.5 Purity .......................................................................................................................174.6 Key Expert (KE) comments....................................................................................194.7 Summary of heroin trends...................................................................................... 205 METHAMPHETAMINE ..............................................................................................215.1 Use...........................................................................................................................215.2 Price........................................................................................................................ 235.3 Availability.............................................................................................................. 255.4 Purity ...................................................................................................................... 275.5 Key Expert (KE) comments................................................................................... 295.6 Summary of methamphetamine trends ................................................................. 306 COCAINE ..................................................................................................................316.1 Use...........................................................................................................................316.2 Price.........................................................................................................................316.3 Availability.............................................................................................................. 326.4 Purity ...................................................................................................................... 336.5 Summary of cocaine trends.................................................................................... 347 CANNABIS ............................................................................................................... 357.1 Use.......................................................................................................................... 357.2 Price........................................................................................................................ 367.3 Availability.............................................................................................................. 377.4 Potency................................................................................................................... 397.5 Key Expert (KE) comments................................................................................... 407.6 Summary of cannabis trends.................................................................................. 40i
8 OTHER OPIOIDS.......................................................................................................418.1 Methadone ............................................................................................................. 428.2 Buprenorphine ....................................................................................................... 438.3 Buprenorphine-Naloxone ...................................................................................... 448.4 Morphine................................................................................................................ 458.5 Oxycodone ............................................................................................................. 468.6 Key Expert (KE) comments................................................................................... 488.6 Summary of other opioids trends........................................................................... 489 OTHER DRUGS......................................................................................................... 499.1 Ecstasy ................................................................................................................... 499.2 Benzodiazepines .................................................................................................... 499.3 Pharmaceutical Stimulants .................................................................................... 509.4 Hallucinogens ........................................................................................................ 509.5 Inhalants..................................................................................................................519.6 <strong>Alcohol</strong> <strong>and</strong> tobacco................................................................................................519.7 Key Expert (KE) comments....................................................................................519.8 Summary of other drug trends ............................................................................... 5210 HEALTH-RELATED TRENDS ASSOCIATED WITH DRUG USE ...................................... 5310.1 Overdose................................................................................................................. 5310.2 Calls to telephone help lines .................................................................................. 5410.3 <strong>Drug</strong> treatment....................................................................................................... 5510.4 Hospital admissions............................................................................................... 5710.5 Injecting risk behaviours........................................................................................ 5910.6 Physical health problems ....................................................................................... 6210.7 Mental health problems, psychological distress, <strong>and</strong> personal wellbeing ............ 6410.8 Other risk behaviours............................................................................................. 6611.9 Summary of health-related trends.......................................................................... 6811 LAW ENFORCEMENT-RELATED TRENDS ASSOCIATED WITH DRUG USE ................... 6911.1 Reports of criminal activity among participants ................................................... 6911.2 Arrests..................................................................................................................... 6911.3 Expenditure on illicit drugs ................................................................................... 7311.4 Summary ................................................................................................................ 7412 IMPLICATIONS......................................................................................................... 75REFERENCES ...................................................................................................................... 76ii
LIST OF TABLESTable 1 Demographic characteristics of the IDU sample, 2008-2009 5Table 2 Participant injection histories, drug preferences, <strong>and</strong> injecting drug use in thepast month, 2008-2009 7Table 3 Polydrug use history of the sample, 2009 9Table 4 Forms of heroin used <strong>and</strong> most common form used in the preceding sixmonths amongst those reporting recent heroin use, QLD, 2009 13Table 5 Heroin preparation methods used by recent users in the preceding six months,2008 14Table 6 Participant reports of heroin price changes in the last six months, 2008-2009 15Table 7 Participant reports of changes in heroin availability in the preceding sixmonths, 2008-2009 16Table 8 Participant perceptions of heroin purity in the past six months, 2008-2009 18Table 9 Summary of heroin trends, QLD, 2008-2009 20Table 10 Price of most recent methamphetamine purchase by participants, 2008-2009 24Table 11 Participants’ reports of methamphetamine price changes in the last six monthsin QLD, 2009 25Table 12 Participants’ reports of methamphetamine availability in the preceding sixmonths, 2008-2009 26Table 13 Summary of methamphetamine trends, QLD, 2008-2009 30Table 14 Median price of most recent cocaine purchases by participants, 2008-2009 32Table 15 Summary of cocaine trends, QLD, 2009 34Table 16 Median price of participants’ most recent cannabis purchases 2008-2009 36Table 17 Participant reports of cannabis price changes in the last six months in QLD,2009 37Table 18 Participant reports of cannabis availability in the preceding six months, 2008-2009 38Table 19 Summary of cannabis trends, QLD, 2008-2009 40Table 20 Summary of trends for other opioids, QLD, 2008-2009 48Table 21 Patterns of ecstasy use among participants in the preceding six months inQLD, 2005-2009 49Table 22 Patterns of benzodiazepine (licit/illicit) use among participants in thepreceding six months in QLD, 2005-2009 49Table 23 Patterns of pharmaceutical stimulant (licit/illicit) use among participants in thepreceding six months in QLD, 2005-2009 50Table 24 Patterns of tobacco use among participants in the preceding six months inQLD, 2005-2009 51Table 25 Summary of trends in other drug use, QLD, 2009 52Table 26 Injection-related problems among participants in the preceding month, byproblem type, 2002-2009 61Table 27 Proportion of participants diagnosed with chronic conditions, median age ofdiagnosis, <strong>and</strong> proportion of participants receiving treatment in precedingyear, 2009 63Table 28 Summary of mental health problems experienced by IDU QLD, 2009 64iii
Table 29 K10 scores in the <strong>National</strong> Health Survey (2007) <strong>and</strong> the QLD IDRSinterviews, 2008 <strong>and</strong> 2009 65Table 30 Driving after licit <strong>and</strong> illicit drug use in the preceding six months, 2007-2009 66Table 31 Summary health-related trends associated with drug use, QLD, 2009 68Table 32 Summary of law enforcement trends associated with drug use, 2009 74iv
LIST OF FIGURESFigure 1 Age distribution of Queensl<strong>and</strong> IDRS participants, 2001-2009 6Figure 2 Prevalence <strong>and</strong> frequency of heroin use in the preceding six months, 2001-2009 11Figure 3 Median days of heroin use <strong>and</strong> injection in the preceding six months, 2001-2009 12Figure 4 Prevalence <strong>and</strong> frequency of homebake heroin use in the preceding sixmonths, 2002-2009 12Figure 5 Median prices of heroin estimated from most recent participant purchases,2001-2009 15Figure 6 Participant reports of current heroin availability, 2001-2009 16Figure 7 Weight <strong>and</strong> number of detections of heroin made at the border by theAustralian Customs Service, financial years 1998/1999-2008/2009 17Figure 8 Median purity of heroin seizures analysed in Queensl<strong>and</strong>, by quarter,2001/2002-2007/2008 19Figure 9 Number of heroin seizures analysed in Queensl<strong>and</strong>, by quarter, 2001/2002-2007/2008 19Figure 10 Percentage of participants reporting recent use of methamphetamine forms,2001-2009 23Figure 11 Weight <strong>and</strong> number of amphetamine-type stimulants * detections by theAustralian Customs Service, financial years 1998/1999-2008/2009 27Figure 12 Perceptions of speed powder, base <strong>and</strong> crystal methamphetamine purityamong participants who commented, 2009 28Figure 13 Median purity of methamphetamine seizures analysed in Queensl<strong>and</strong>, byquarter, 2001/2002-2007/2008 29Figure 14 Number of methamphetamine seizures analysed in Queensl<strong>and</strong>, by quarter,2001/2002-2007/2008 29Figure 15 Proportion of QLD IDU sample reporting cocaine use in the preceding sixmonths, 2001-2009 31Figure 16 Weight <strong>and</strong> number of cocaine detections made at the border by theAustralian Customs Service, financial years 1998/1999-2008/2009 32Figure 17 Median purity of cocaine seizures analysed in Queensl<strong>and</strong>, by quarter,financial years 2001/2002-2007/2008 33Figure 18 Number of cocaine seizures analysed in Queensl<strong>and</strong>, by quarter, financialyears 2001/2002-2007/2008 34Figure 19 Prevalence <strong>and</strong> frequency of cannabis use among participants, 2001-2009 35Figure 20 Weight <strong>and</strong> number of cannabis detections made at the border by theAustralia Customs Service, financial years 1998/1999-2008/2009 39Figure 21 Participant reports of current cannabis potency, 2009 39Figure 22 Participant reports of recent changes in cannabis potency, 2009 40Figure 23 Use <strong>and</strong> injection of illicit methadone <strong>and</strong> Physeptone ® among participantsin the preceding six months, 2003-2009 43Figure 24 Use <strong>and</strong> injection of illicit buprenorphine among participants in thepreceding six months, 2004-2009 44Figure 25 Use <strong>and</strong> injection of illicit buprenorphine-naloxone among participants inthe preceding six months, 2006-2009 45v
Figure 26 Use <strong>and</strong> injection of illicit morphine among participants in the precedingsix months 2003-2009 46Figure 27 Use <strong>and</strong> injection of illicit oxycodone among participants in the precedingsix months, 2005-2009 47Figure 28 Prevalence <strong>and</strong> frequency of hallucinogen use in the preceding six months,2001-2009 50Figure 29 Prevalence of inhalant use by participants, 2001-2009 51Figure 30 Number of overdoses attended by QAS where a drug was specified as theprimary problem, 2008/2009 54Figure 31 Number of enquiries to ADIS regarding licit <strong>and</strong> illicit opioids, 2001/2002-2008/2009 54Figure 32 Number of enquiries to ADIS regarding amphetamines, includingmethamphetamine, 2001/2002-2008/2009 55Figure 33 Number of enquiries to ADIS regarding cocaine, 2001/2002-2008/2009 55Figure 34 Number of enquiries to ADIS regarding cannabis, 2001/2002-2008/2009 55Figure 35 Proportion of participants reporting treatments other thanpharmacotherapy in past six months, 2001-2009 56Figure 36 Estimated number of pharmacotherapy clients for all opioidpharmacotherapy types in Queensl<strong>and</strong>, 1989-2008 57Figure 37 Rate per million of inpatient hospital admissions where opioids were theprincipal diagnosis per million persons aged 15-54 years, Queensl<strong>and</strong> <strong>and</strong>nationally, 1994/1995-2007/2008 57Figure 38 Rate of inpatient hospital admissions where amphetamines were theprincipal diagnosis per million persons aged 15-54 years, Queensl<strong>and</strong> <strong>and</strong>nationally, 1994/1995-2007/2008 58Figure 39 Rate of inpatient hospital admissions where cocaine was the principaldiagnosis per million persons aged 15-54 years, Queensl<strong>and</strong> <strong>and</strong> nationally,1994/1995-2006/2007 58Figure 40 Rate of inpatient hospital admissions where cannabis was the principaldiagnosis per million people aged 15-54 years, Queensl<strong>and</strong> <strong>and</strong> nationally,1994/1995-2006/2007 59Figure 41 Proportion of participants reporting sharing injecting equipment in themonth preceding interview, 2001-2009 59Figure 42 Total number of syringes dispensed in Queensl<strong>and</strong>, 1996/1997-2008/2009 60Figure 43 Total number of notifications for hepatitis B (incident <strong>and</strong> unspecified)hepatitis C (unspecified), Queensl<strong>and</strong> 1991-2009 60Figure 44 Usual location for injection in the month preceding interview, 2002-2009 61Figure 45 Main drug attributed to a dirty hit in the preceding month, 2004-2009 62Figure 46 Mean IDU sample <strong>and</strong> Australian general population scores on thePersonal Wellbeing Index 65Figure 47 Criminal activity in the month preceding interview <strong>and</strong> past year arrestamong participants, 2003-2009 69Figure 48 Number of heroin possession/use arrests by geographic area, 1997/1998-2007/2008 70Figure 49 Number of amphetamine-type stimulant (ATS) possession/use arrests bygeographic area, 1997/1998-2007/2008 70vi
Figure 50 Number of cl<strong>and</strong>estine laboratories detected in Australia, Queensl<strong>and</strong>, <strong>and</strong>other states, 2007/2008 71Figure 51 Number of cl<strong>and</strong>estine laboratories detected by QLD Police, 1998-2008 71Figure 52 Number of cocaine possession/use arrests by geographic area, 1997/1998-2007/2008 72Figure 53 Number of cannabis possession/use arrests by geographic area,1998/1999- 2007/2008 72Figure 54 Number of other opioid possession/use arrests by geographic area,1997/1998-2007/2008 73Figure 55 Mean amount of money spent by participants on illicit drugs on the daypreceding interview, 2001-2009 73vii
ACKNOWLEDGEMENTSIn 2009, the Illicit <strong>Drug</strong> Reporting System (IDRS) was funded by the Australian GovernmentDepartment of Health <strong>and</strong> Ageing (AGDHA). The IDRS team would like to thank Mr DariusEverett, Mr Joe Upston <strong>and</strong> Ms Kristina Geremia <strong>and</strong> colleagues of the AGDH&A for theirassistance throughout the year.The IDRS is coordinated by the <strong>National</strong> <strong>Drug</strong> <strong>and</strong> <strong>Alcohol</strong> <strong>Research</strong> <strong>Centre</strong> (NDARC) inSydney. The Queensl<strong>and</strong> IDRS team would like to acknowledge Dr Lucy Burns (ChiefInvestigator), Natasha Sindicich <strong>and</strong> Jennifer Stafford (<strong>National</strong> Coordinators), as well asAm<strong>and</strong>a Roxburgh for her assistance with the access <strong>and</strong> analyses of indicator data. We wouldlike to extend our sincere thanks to our colleagues at NDARC for their continued support,professionalism <strong>and</strong> collegiality in 2009.The success of the Queensl<strong>and</strong> IDRS essentially depends upon the ongoing support <strong>and</strong>cooperation of a large number of stakeholders each year. In particular, we would like toacknowledge <strong>and</strong> thank the following individuals <strong>and</strong> organisations:1. The 2009 IDRS participants for generously sharing their perceptions, <strong>and</strong> experienceswith us for the purposes of the survey;2. the Needle <strong>and</strong> Syringe Programs (NSP) in Queensl<strong>and</strong> whose assistance, cooperation,<strong>and</strong> generosity over the years has continued to make data collection for the projectpossible:a. The Brisbane Harm Reduction <strong>Centre</strong> at Bialab. Inala <strong>Alcohol</strong> <strong>and</strong> <strong>Drug</strong> Service NSPc. Logan-Beaudesert ATODS NSPd. Queensl<strong>and</strong> Injector’s Health Network (QuIHN) – Burleigh Heads NSP <strong>and</strong>Fortitude Valley NSPe. Youth <strong>and</strong> Family Services (YFS) Logan NSP3. the team of IDRS interviewers: Mel Gamble, Megan Garrett, Tina Belovic, HannahWilliams <strong>and</strong> Patricia Whipple;4. Gerard Glynn for his help with data entry;5. Leith Morris for her help with statistical analyses;6. the individuals from the health <strong>and</strong> law enforcement sectors who freely provided theirtime <strong>and</strong> knowledge to participate as key experts (KE) this year; <strong>and</strong>7. the health <strong>and</strong> law enforcement agencies that kindly provided indicator data.viii
ABBREVIATIONSABSABCIACCACSADHDAFPADISAIHWAODATSATSIATODSBBVCMCDDUDUMAEDRSHBVHCVHIVIDRSIDUKEK10MDMAMSICNCHECRNDARCNDLERFNNDSSNOPSADNSPNSWODORTOSTPGSIPWIQADRECQASQLDQPSRBTAustralian Bureau of StatisticsAustralian Bureau of Criminal IntelligenceAustralian Crime CommissionAustralian Customs ServiceAttention Deficit Hyperactivity DisorderAustralian Federal Police<strong>Alcohol</strong> <strong>and</strong> <strong>Drug</strong> Information ServiceAustralian Institute of Health <strong>and</strong> Welfare<strong>Alcohol</strong> <strong>and</strong> other drug(s)Amphetamine-type stimulantAboriginal or Torres Strait Isl<strong>and</strong>er<strong>Alcohol</strong>, Tobacco <strong>and</strong> Other <strong>Drug</strong>s Services (Queensl<strong>and</strong> Health)Blood-borne virusCrime <strong>and</strong> Misconduct Commission<strong>Drug</strong>s of Dependence Unit (Queensl<strong>and</strong> Health)<strong>Drug</strong> Use Monitoring in AustraliaEcstasy <strong>and</strong> Related <strong>Drug</strong>s Reporting SystemHepatitis B virusHepatitis C virusHuman immunodeficiency virusIllicit <strong>Drug</strong> Reporting Systeminjecting drug user(s)Key Expert(s)Kessler Psychological Distress Scale3,4-methylenedioxymethylamphetamine (‘ecstasy’)Medically Supervised Injecting <strong>Centre</strong><strong>National</strong> <strong>Centre</strong> in HIV Epidemiology <strong>and</strong> Clinical <strong>Research</strong><strong>National</strong> <strong>Drug</strong> <strong>and</strong> <strong>Alcohol</strong> <strong>Research</strong> <strong>Centre</strong><strong>National</strong> <strong>Drug</strong> Law Enforcement <strong>Research</strong> Fund<strong>National</strong> Notifiable Diseases Surveillance System<strong>National</strong> Opioid Pharmacotherapy Statistics Annual DataNeedle <strong>and</strong> Syringe Program(s)New South WalesOverdoseOpioid Replacement TherapyOpioid Substitution TreatmentProblem Gambling Severity IndexPersonal Wellbeing IndexQueensl<strong>and</strong> <strong>Alcohol</strong> <strong>and</strong> <strong>Drug</strong> <strong>Research</strong> <strong>and</strong> Education <strong>Centre</strong>Queensl<strong>and</strong> Ambulance ServiceQueensl<strong>and</strong>Queensl<strong>and</strong> Police ServiceR<strong>and</strong>om Roadside Breath Testix
EXECUTIVE SUMMARYIn 2009, confidence interval (CI) testing was carried out on injecting drug user (IDU)data where appropriate using a CI calculator (Tanberg, date unknown). This was toappraise whether differences between 2008 <strong>and</strong> 2009 data were statistically significant<strong>and</strong> meaningful. The vast majority of these tests yielded statistically non-significantresults, indicating stability in participant responses between 2008 <strong>and</strong> 2009 on themajority of variables presented in this report. In light of this, CI statistics are onlypresented in the main body of the report in instances where the difference in proportions(percentages) between 2008 <strong>and</strong> 2009 data were statistically significant.Demographic characteristics of participantsIn 2009, 103 participants were interviewed for the Illicit <strong>Drug</strong> Reporting System (IDRS) insouth-east Queensl<strong>and</strong>. However, 23 of these interviews could not be entered into the databasefor statistical analysis, resulting in a final sample size of 80. The mean age of the IDU samplewas 33 years <strong>and</strong> 70% were male. The majority of participants were unemployed (94%, asignificant increase from 72% in 2008), although 45% reported having trade or technicalqualifications <strong>and</strong> 8% reported having university or other tertiary qualifications. Thirty-ninepercent of the sample reported that they were currently involved in some sort of drug treatment,the most common form being opioid maintenance treatment.Patterns of drug use among participantsThe mean age of first injection was 19 years. Sixty-one percent of participants reportedmethamphetamine as the first drug injected, almost double the number reporting heroin as thefirst drug injected (33%). Fifty-three percent of participants nominated heroin as their drug ofchoice <strong>and</strong> 31% named some sort of methamphetamine. Heroin <strong>and</strong> methamphetamines werethe drugs injected most often in the preceding month by the majority of participants (46% <strong>and</strong>31% respectively) <strong>and</strong> they were also the last drugs injected by the majority of participants (39%<strong>and</strong> 33% respectively). In 2009, 35% of the sample reported a discrepancy between their drug ofchoice <strong>and</strong> the drug they injected most often in the previous month. Of those that reported adiscrepancy (n=28), one-fifth (20%) reported that this was due to the limited availability of theirdrug of choice, 17% reported their drug of choice was non-injectable, <strong>and</strong> 14% said it was due toprice.HeroinUse of heroin in the six months preceding interview remained stable between 2008 <strong>and</strong> 2009(74% <strong>and</strong> 75% of participants respectively). Amongst those reporting recent use, however, themedian number of days of use in the preceding six months increased from 48 in 2008 to 72 in2009. The proportion of participants reporting daily use in the preceding six months also rosesignificantly, from 5% in 2008 to 25% in 2009. Sixty-three percent of recent heroin usersreported that white/off-white powder or rock was the form they used most often in thepreceding six months, whilst 34% reported using brown powder or rock. The price of heroinremained stable at $50 for a cap <strong>and</strong> $400 for a gram. The majority of participants reported thatavailability had been stable too. In terms of heroin purity, the majority of the sample reportedthat it had been stable (29%), decreasing (32%), or fluctuating (20%) in the preceding sixmonths.x
MethamphetamineThe IDRS survey collects data on three different forms of methamphetamine:methamphetamine powder (‘speed’), methamphetamine base (‘base’) <strong>and</strong> crystalmethamphetamine (‘crystal’).Methamphetamine powder (speed)The proportion of participants reporting recent use of speed was stable between 2008 <strong>and</strong> 2009(47% in 2009); however, the median number of days of use in the preceding six monthsincreased to 24 in 2009 from 12 in 2008. Six percent of participants nominated speed as theirdrug of choice. The reported price of speed remained stable at $50 for a point <strong>and</strong> $200 for agram. Speed was reported by most respondents to currently be ‘easy’ (23%) or ‘very easy’ (50%)to obtain <strong>and</strong> current purity was most often reported to be ‘low’ (41%) or ‘fluctuating’ (23%).Methamphetamine base (base)The proportion of participants reporting recent use of base was stable between 2008 <strong>and</strong> 2009(41% in 2009) <strong>and</strong> the median number of days of use in the preceding six was also stable (22 in2009). Three percent of participants nominated base as their drug of choice. The reported priceof base remained stable at $50 for a point <strong>and</strong> $200 for a gram. Base was reported by mostrespondents to currently be ‘easy’ (41%) or ‘very easy’ (38%) to obtain <strong>and</strong> current purity wasmost often reported to be ‘high’ (22%) or ‘medium’ (28%).Crystal methamphetamine (ice)The proportion of participants reporting recent use of ice was stable between 2008 <strong>and</strong> 2009(47% in 2009) <strong>and</strong> the median number of days of use in the preceding six was also stable (10 in2009). Nine percent of participants nominated ice as their drug of choice. The reported price ofspeed remained stable at $50 for a point but increased for a gram between 2008 <strong>and</strong> 2009 from$275 to $350. Ice was reported by most respondents to currently be ‘easy’ (29%) or ‘very easy’(23%) to obtain (although 26% reported that it was ‘difficult’) <strong>and</strong> current purity was most oftenreported to be ‘high’ (40%) or ‘medium’ (23%).CocaineThe proportion of participants reporting recent use was stable between 2008 <strong>and</strong> 2009 (15% in2009) <strong>and</strong> the median number of days of use in the preceding six months was two. Noparticipant reported cocaine as his or her drug of choice <strong>and</strong> no participant reported having usedit on the day prior to interview. Only small numbers of participants commented on the price,purity, <strong>and</strong> availability of cocaine in the preceding six months, so the data is very difficult tointerpret <strong>and</strong> should be done so with caution. A gram was reported to cost $325 (n=2). Reportsof current availability were mixed <strong>and</strong> included: ‘very easy’, ‘easy’, <strong>and</strong> ‘difficult’ (n=5). Reportsof current purity were also mixed <strong>and</strong> included: ‘increasing’, ‘decreasing’, ‘stable’, <strong>and</strong>‘fluctuating’ (n=5).CannabisThe proportion of participants reporting recent use of cannabis was stable between 2008 <strong>and</strong>2009 (69% in 2009); however, the median number of days of use in the preceding six monthsincreased to 150 in 2009 from 72 in 2008. Forty-six percent of participants reporting recent usesaid they had used cannabis on a daily basis in the preceding six months. Seventeen percent ofthe sample nominated cannabis as their drug of choice. Participants commented on the price,purity <strong>and</strong> availability of two different forms of cannabis: outdoor-cultivated cannabis (bush) <strong>and</strong>xi
indoor-cultivated cannabis (hydro). The reported price of hydro was stable at $25 for a gram<strong>and</strong> $300 for an ounce. The reported price of a gram of bush was also stable at $20 but anounce had increased from $220 in 2008 to $280 in 2009. The majority of respondents reportedhydro was currently ‘easy’ (28%) or ‘very easy’ (64%) to obtain <strong>and</strong> had ‘high’ (58%) or ‘medium’(33%) potency. The majority of respondents also reported bush was currently ‘easy’ (24%) or‘very easy’ (56%) to obtain <strong>and</strong> had ‘high’ (41%) or ‘medium’ (35%) potency.Other opioidsThe IDRS survey also collects data on the illicit <strong>and</strong> licit use of other opioids including:methadone, buprenorphine, buprenorphine-naloxone, morphine, <strong>and</strong> oxycodone. Illicit use ofthese drugs is defined as the use of medication not obtained with a prescription in theparticipant’s name.MethadoneUse of licit methadone in the six months preceding interview was stable between 2008 <strong>and</strong> 2009(12% of participants in 2009). Fifty-six percent of recent licit methadone users reported dailyuse in the preceding six months. The proportion of participants reporting recent use of illicitmethadone decreased significantly from 24% in 2008 to 10% in 2009.BuprenorphineUse of licit buprenorphine in the six months preceding interview remained stable between 2008<strong>and</strong> 2009 (14% of participants in 2009); however, the median number of days of use increasedfrom 55 days in 2008 to 135 days in 2009. The proportion of participants reporting recent use ofillicit buprenorphine remained stable between 2008 <strong>and</strong> 2009 at 31%.Buprenorphine-naloxoneUse of licit buprenorphine-naloxone in the six months preceding interview remained stablebetween 2008 <strong>and</strong> 2009 (23% of participants in 2009); however, the median number of days ofuse decreased from 90 days in 2008 to 66 days in 2009. The proportion of participants reportingrecent use of illicit buprenorphine-naloxone remained stable between 2008 <strong>and</strong> 2009 at 22%.MorphineIn 2009, only data regarding the illicit use of morphine were included in the report. Theproportion of participants reporting recent use of illicit morphine remained stable between 2008<strong>and</strong> 2009 (51% in 2009). The median number of days of use in the preceding six months was 18.OxycodoneIn 2009, only data regarding the illicit use of oxycodone were included in the report. Theproportion of participants reporting recent use of illicit morphine remained stable between 2008<strong>and</strong> 2009 (34% in 2009). The median number of days of use in the preceding six months was 14,up from seven in 2008.Patterns of other drug useBenzodiazepinesRecent use of benzodiazepines (both licit/illicit) continued to be reported by the majority of thesample in 2009 (59%, 61% in 2008). The median number of days of use in the preceding sixmonths was 65. The overall proportion of participants reporting recent injection ofbenzodiazepines was relatively low, however, at 4% for licit benzodiazepines <strong>and</strong> 1% for illicitbenzodiazepines. The most common route of administration was swallowing for both licit <strong>and</strong>xii
illicit forms of the drugs. The most commonly used br<strong>and</strong> was Valium ® . A number of keyexperts (KE) suggested that benzodiazepine use amongst IDU is an emerging issue <strong>and</strong> oneworth monitoring in years to come.EcstasyTwenty-five percent of participants reported use of ecstasy in the six months preceding interview(17% in 2008). Fourteen percent of participants reported recent injection of ecstasy (15% in2008). The median number of days of use in the preceding six months was two.Pharmaceutical stimulantsRecent use of pharmaceutical stimulants continued to be reported by a small minority of theIDU sample in 2009. Five percent of participants reported use of pharmaceutical stimulants inthe six months preceding interview (4% in 2008). Three percent of participants reported recentinjection of pharmaceutical stimulants (1% in 2008).HallucinogensThirteen percent of participants reported use of hallucinogens in the six months precedinginterview. All those reporting recent use reported that swallowing was the route ofadministration. The most frequently used form was mushrooms.InhalantsNine percent of the sample reported use of inhalants in the six months preceding interview. Themost commonly used form was glue.<strong>Alcohol</strong> <strong>and</strong> tobaccoUse of alcohol in the six months preceding interview remained stable in 2009 (68%, 62% in2008). No participant in 2008 or 2009 reported recent injection of alcohol. The median numberof days of use in the six months preceding interview was 20. The vast majority of participants(95%) reported use of tobacco in the preceding six months. The median number of days of usewas 180 (i.e., daily).Health-related trends associated with drug useFifty-three percent of participants reported having overdosed on heroin at least once in theirlifetime <strong>and</strong> 18% of these participants reported overdosing on the drug in the previous year.Thirty-one percent of the sample reported lending a used needle in the preceding month, asignificant increase from 6% in 2008, <strong>and</strong> 73% reported re-using their own needle, a significantincrease from 49% in 2008. Sixty-eight percent nominated a private home as the usual locationfor injection in the preceding month, a significant decrease from 87% in 2008. Sixty-fourpercent reported scarring/bruising in the preceding month, a significant increase from 46% in2008. The drug most commonly reported as being responsible for a dirty hit was heroin.For the first time in 2009, participants were asked to respond to questions about chronic healthconditions <strong>and</strong> dental health. The most commonly reported conditions were back/neck pain(44%), liver disease (43%), asthma (29%), vision problems (29%), migraine (26%), skin problems(23%), <strong>and</strong> bronchitis (20%). The most commonly reported reasons for a visit to the dentistwere extractions <strong>and</strong> fillings. Participants also reported on mental health problems,psychological distress, <strong>and</strong> personal wellbeing. Forty-one percent reported having had a mentalproblem other than drug dependence in the preceding six months, most commonly depression<strong>and</strong> anxiety. Of those reporting a mental health problem, 42% had not attended a mental healthprofessional for treatment. The majority of the IDU sample scored in the ‘high’ to ‘very high’xiii
anges of distress on the Kessler 10 scale <strong>and</strong>, on average, the IDU sample were less satisfiedwith all aspects of personal wellbeing assessed on the Personal Wellbeing Index (PWI) than thegeneral Australian population.Law-enforcement trends associated with drug useForty-five percent of participants reported being arrested in the preceding 12 months. Propertycrime <strong>and</strong> use/possession of drugs were the most frequently reported reasons for arrest. At thetime of publication, QPS arrest data for the 2008/2009 financial year was not available <strong>and</strong> assuch the relevant section presents the same data reported in the 2008 Queensl<strong>and</strong> IDRS report.The average amount of money spent on illicit drugs on the day preceding interview was $108.ImplicationsPatterns in the use, price, purity, <strong>and</strong> availability of heroin largely remained stable between 2008<strong>and</strong> 2009 in Queensl<strong>and</strong>, although there was a significant increase in the proportion ofparticipants reporting daily use of heroin in the six months preceding interview. Patterns in theuse, price, <strong>and</strong> availability of methamphetamines also remained relatively stable between 2008<strong>and</strong> 2009.In terms of risk behaviours associated with injecting drug use, of some concern are theproportions of the 2009 IDU sample who reported lending a used needle, re-using their ownneedles, <strong>and</strong> using other injecting equipment after someone else. In terms of other riskbehaviours, it is concerning that the large majority of participants in 2009 that had driven in thesix months preceding interview had, at some point during that time, driven under the influenceof an illicit drug. Increasing awareness of the risks associated both with sharing injectingequipment <strong>and</strong> driving under the influence of illicit drugs is important because of the harmsassociated with these practices.Additionally, over half of the participants who reported a mental-health problem other than drugdependence in the six months preceding interview had not attended a mental health professionalfor treatment during that time. Given this, it might be beneficial to increase awareness amongstthe IDU population that under the Australian Government’s Better Access to Mental HealthCare initiative, eligible people can generally receive 12 subsidised sessions per calendar year witha registered psychologist when referred by a general practitioner or other appropriate medicalpractitioner (Australian Psychological Society, 2010).xiv
1 INTRODUCTIONThe Illicit <strong>Drug</strong> Reporting System (IDRS) is an ongoing research project that serves as a strategicearly-warning system for emerging trends <strong>and</strong> patterns in illicit drug use <strong>and</strong> associated harms.Since 1999, the IDRS has been conducted annually in every state <strong>and</strong> territory of Australia, <strong>and</strong> itis currently funded by the Australian Government Department of Health <strong>and</strong> Ageing(AGDH&A). The IDRS focuses primarily on four main illicit drugs: heroin, amphetamines,cocaine, <strong>and</strong> cannabis, but also monitors trends in other drugs <strong>and</strong> in drug-related harms.An important feature of the IDRS is that it aims to disseminate its findings in a timely fashion,highlighting current issues that require further attention rather than providing a more protracted,in-depth analysis of available data. Each year, key findings are presented at the <strong>National</strong> <strong>Drug</strong>Trends Conference in October, <strong>and</strong> the final report is published by the <strong>National</strong> <strong>Drug</strong> <strong>and</strong><strong>Alcohol</strong> <strong>Research</strong> <strong>Centre</strong> (NDARC) early the following year. In addition, NDARC produces anannual national report <strong>and</strong>, in collaboration with jurisdictional researchers, quarterly <strong>Drug</strong> TrendsBulletins highlighting issues of particular relevance. Selected findings from the IDRS are alsopublished in peer-reviewed journals.Data for the IDRS come from three complementary sources: (a) a survey of injecting drug users(IDU or participants) who are considered a ‘sentinel’ group in the community; (b) structuredinterviews with key experts (KE) working in the drug <strong>and</strong> alcohol field; <strong>and</strong> (c) pre-existing datasets. By triangulating information from these three sources, the IDRS is able to assess, with someconfidence, the reliability <strong>and</strong> validity of its findings.The participant survey component of the IDRS has been conducted in Queensl<strong>and</strong> since 2000,<strong>and</strong> with each passing year the value of the data set grows. Apparent trends from one year to thenext can increasingly be interpreted within a broader historical context, <strong>and</strong> longer-term trends indrug use <strong>and</strong> associated harms can be identified. Along with other complementary monitoringsystems such as the national Ecstasy <strong>and</strong> Related <strong>Drug</strong> Reporting System (EDRS) <strong>and</strong> the crimefocused<strong>Drug</strong> Use Monitoring in Australia (DUMA) study, the IDRS helps to paint acontextualised picture of drug use <strong>and</strong> drug-related issues in Australia.1.1 Study aimsAs in previous years, the aims of the 2009 Queensl<strong>and</strong> IDRS were to:• document the price, purity, <strong>and</strong> availability of heroin, amphetamines, cocaine, cannabis<strong>and</strong> other drugs in Queensl<strong>and</strong>; <strong>and</strong>• identify, assess, <strong>and</strong> report on emerging trends in illicit drug use <strong>and</strong> associated harms.1
2.2 Survey of KEBetween late August <strong>and</strong> early November 2009, 26 professionals working in the drug field wereinterviewed as KE for the Queensl<strong>and</strong> IDRS. KE are individuals whose work in the healthsector or law enforcement brings them into regular contact with people who inject illicit drugs<strong>and</strong> who are therefore in a position to provide information on trends <strong>and</strong> patterns in illicit druguse <strong>and</strong> associated harms. As law enforcement KE may not have direct contact with illicit drugusers throughout the course of their work, the eligibility criteria may be relaxed to some extent tofacilitate their participation in the study. Law enforcement KE can provide valuable informationon trends in drug-related crime such as the manufacture <strong>and</strong> supply of illicit drugs. In 2009, 17of the KE were from the health sector <strong>and</strong> nine were from law enforcement. The KE camefrom a wide-range of backgrounds <strong>and</strong> professions including but not limited to: NSP workers,counsellors, clinical psychologists, staff of drug treatment agencies, researchers, street-basedoutreach workers, forensic chemists, <strong>and</strong> law enforcement <strong>and</strong> intelligence officers.Interviews were conducted face-to-face or over the telephone. The information KE providedremains anonymous <strong>and</strong> confidential (i.e., their responses were de-identified). KE were asked tonominate a specific illicit drug that they felt was particularly problematic as the focus for thediscussion. Interviews took approximately 30 minutes to one hour to complete <strong>and</strong> included arange of open-ended <strong>and</strong> closed questions. The 2009 KE survey included sections on:1. socio-demographic characteristics of illicit drug users;2. drug use patterns <strong>and</strong> trends;3. the price, purity <strong>and</strong> availability of illicit drugs;4. health issues; <strong>and</strong>5. criminal <strong>and</strong> police activity.It is important to note that not all the KE data collected could be included in the IDRSreport. Sometimes the data is sensitive <strong>and</strong> has been provided for backgroundinformation only. On other occasions, it would not have been responsible to publish thedata from a single KE because they may have given information about a drug that noother KE spoke about, making the data difficult to validate. This does not mean, however,that the information is wasted as it can be used to alert IDRS researchers to newquestions that should be included in subsequent IDRS IDU surveys.2.3 Other indicatorsData collected from IDU surveys <strong>and</strong> KE interviews were supplemented by routinely collectedAustralian indicator data sources relating to illicit drug use <strong>and</strong> other drug-related issues. Theentry criteria for indicator data are:1. data should be available at least annually;2. data should include 50 or more cases;3. data should provide details of illicit drug use ;4. data should be collected in the main study site (i.e., Queensl<strong>and</strong>); <strong>and</strong>5. data should include details on at least one of the four main illicit drugs underinvestigation (i.e. heroin, methamphetamines, cocaine, <strong>and</strong> cannabis).3
The indicator data sources meeting the above criteria included in the 2009 IDRS study aredescribed below:• <strong>Alcohol</strong> <strong>and</strong> <strong>Drug</strong> Information Service (ADIS): telephone counselling statistics• Australian Bureau of Statistics (ABS): <strong>National</strong> Health Survey data• Australian Crime Commission (ACC): median purity of drugs seized by QPS <strong>and</strong> theAFP in Queensl<strong>and</strong>• Australian Customs Service (ACS): total weight <strong>and</strong> number of drugs seized inQueensl<strong>and</strong> by QPS <strong>and</strong> the AFP• Australian Institute of Health <strong>and</strong> Welfare (AIHW): Queensl<strong>and</strong> pharmacotherapy clientregistrations• <strong>National</strong> Hospital Morbidity Data: total number <strong>and</strong> rate per million persons where adrug was specified• <strong>National</strong> Notifiable Diseases Surveillance System (NNDSS): blood-borne virus (BBV)notifications by year• Queensl<strong>and</strong> Ambulance Service (QAS): overdose <strong>and</strong> poisoning data• Queensl<strong>and</strong> Needle <strong>and</strong> Syringe Program (QNSP): needles <strong>and</strong> syringes dispensed toNSP in Queensl<strong>and</strong>• Queensl<strong>and</strong> Police Service (QPS): cl<strong>and</strong>estine laboratory detections <strong>and</strong> drug-relatedarrests4
3 RESULTS3.1 Overview of the IDU sampleA total of 103 regular IDU were interviewed in Queensl<strong>and</strong> in 2009. However, 23 of theseinterviews could not be entered into the database for statistical analysis, resulting in a final samplesize of 80. The demographic characteristics of the sample are summarised in Table 1. In 2009,the mean age of the sample was 33 years (range=19-61 years, SD=9.2), <strong>and</strong> just over two-thirds(70%) were male. Almost all respondents (96%) reported English as the main language spoken athome <strong>and</strong> 9% identified as Aboriginal <strong>and</strong>/or Torres Strait Isl<strong>and</strong>er. The majority of participantsreported that they were single (50%), had a partner (23%), or were married/de facto (24%).Table 1: Demographic characteristics of the IDU sample, 2008-20092008N=1042009N=80Age (mean years, range) 37.7 (18-59) 33.3 (19-61)Sex (% male) 64 70Employment (%)Not employed/on a pensionFull timePart time/casualHome dutiesStudentReceived income from sex work last month (%) 3 11Aboriginal <strong>and</strong>/or Torres Strait Isl<strong>and</strong>er (%) 14 9Sexual identity (%)HeterosexualBisexualGay or lesbianOther84114293601School education (mean years completed) 10 10Tertiary education (%):NoneTrade/technicalUniversity/collegeCurrent relationship status (%)Married/de factoPartnerSingleSeparatedDivorcedCurrently in drug treatment # (%) 39 39Prison history (%) 52 57Source: QLD IDRS IDU interviews, 2008-2009# Refers to any form of drug treatment, such as pharmacotherapies, counselling, detoxification, etc721214014538182720464394140047458242350125
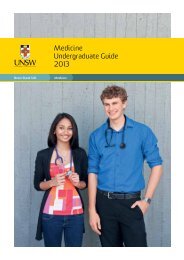
In 2009, the 38% of participants were aged 35 years <strong>and</strong> over (64% in 2008, see Figure 1). Fiftypercent of participants were aged 25-34 years (31% in 2008), <strong>and</strong> 13% were under 25 (6% in2008).Figure 1: Age distribution of Queensl<strong>and</strong> IDRS participants, 2001-2009% Participants7060504030201002001 2002 2003 2004 2005 2006 2007 2008 2009Under 25 years 25-34 years 35 years <strong>and</strong> overSource: QLD IDRS IDU interviews, 2001-2009The mean number of formal school years completed was 10 (range=8-12 years, SD=1.2). Fortyfivepercent of participants reported that they had trade or technical qualifications (38% in 2008),<strong>and</strong> 8% reported that they had university or other tertiary qualifications (18% in 2007). Theoverwhelming majority of participants interviewed in 2009 (94%, n=75) were unemployed,compared with 72% (n=75) in 2008. This was a statistically significant increase (22%; 95% CI ofdifference; -3, -1). One participant was currently employed full time <strong>and</strong> 4% were employed on acasual or part-time basis. Eleven percent of participants in 2009 (n=9) reported receiving incomefrom sex work in the previous month, compared with 3% in 2008 (n=3). This was a statisticallysignificant increase (8%; 95% CI of difference; -2, -1). In 2009, 57% of participants reportedhaving a prison history.Thirty-nine percent of participants (n=31) indicated that they were currently involved in someform of drug treatment. The most common form of drug treatment was opioid maintenancetreatment, with 42% of those in treatment engaged in buprenorphine-naloxone maintenancetreatment, 19% in buprenorphine maintenance treatment, <strong>and</strong> 23% in methadone maintenancetreatment. The median length of time participants had been participating in their currenttreatment was six months (range of one week to 10 years). Of those respondents currently intreatment, 52% (n=16) had been participating in treatment for six months or less. Twenty-threepercent (n=7) had been in treatment for between seven months <strong>and</strong> two years.3.2 <strong>Drug</strong> use history <strong>and</strong> current drug useThe injection histories of participants in the 2008 <strong>and</strong> 2009 samples are summarised in Table 2.The mean age of first injection amongst 2009 participants was 19 years (range=11-48 years,SD=6.6). Sixty-one percent of the respondents reported amphetamines as the first drug injected,almost double the number reporting heroin as first drug injected (33%). Heroin was the druginjected most often in the month prior to the interview (46%, 36% in 2008). Heroin was the lastdrug injected by 39% of respondents (37% in 2008), followed by speed powder (19%, 12% in2008).6
Table 2: Participant injection histories, drug preferences, <strong>and</strong> injecting drug use in thepast month, 2008-20092008N=1042009N=80Age first injection (mean years, range) 18.6 (9-41) 19 (11-48)First drug injected (%)Heroin4333Methamphetamine (any form)4961Cocaine21Morphine23Other02<strong>Drug</strong> of choice (%)HeroinCocaineMethamphetamine (any form)Speed powderBase methamphetamineCrystal methamphetamineCannabisOther<strong>Drug</strong> injected most often in last month (%)HeroinCocaineMethamphetamine (any form)Speed powderBase methamphetamineCrystal methamphetamineMorphineOther/have not injected in last monthLast drug injected (%)HeroinCocaineMethamphetamine (any form)Speed powderBase methamphetamineCrystal methamphetamineMorphineBuprenorphine *Frequency of injecting in last month (%)Weekly or lessMore than weekly, but less than dailyOnce per day2-3 times a day>3 times a daySource: QLD IDRS IDU interviews, 2008-2009* Includes burprenorphine-naloxone63018649812360281061222837028126101962529182355301863917184603113810131039033194101591827142715Heroin was nominated as the drug of choice for the majority of participants (53%) in 2009 (63%in 2008). Overall, 18% of participants nominated some form of methamphetamine as their drugof choice: 9% nominated crystal, 6% nominated speed <strong>and</strong> 3% nominated base as their drug ofchoice. Cannabis was nominated by 17% of the sample as their drug of choice.7
In 2009, 35% of the sample reported a discrepancy between their drug of choice <strong>and</strong> the drugthey injected most often in the previous month. Of those that reported a discrepancy (n=28),one-fifth (20%) reported that this was due to the limited availability of their drug of choice, 17%reported their drug of choice was non-injectable, <strong>and</strong> 14% said it was due to price. The mostcommon drugs used on the day prior to the interview were heroin (35%), cannabis (35%),alcohol (28%), benzodiazepines (13%), <strong>and</strong> morphine (13%). Five percent of the sample had notused any drugs on the day prior to interview.Fourteen percent of participants reported injecting once per day (18% in 2008), 27% reportedinjecting two to three times a day (23% in 2008), <strong>and</strong> 15% reported injecting more than threetimes a day (5% in 2008). Overall, 56% of the 2009 sample reported injecting once or more perday compared to 46% in 2008.3.3 Polydrug use history of the sampleTable 3 shows the polydrug use history of the sample in 2009. The vast majority of participantsreported recent use of tobacco (95%), heroin (75%), methamphetamine (70%), cannabis (69%),<strong>and</strong> alcohol (68%). Among those reporting recent use of each drug, the most frequently usedwere tobacco (n=76, median=180 days of use in the last six months), prescribed methadone(n=9, median=180 days of use), cannabis (n=55, median=150 days of use), <strong>and</strong> prescribedbuprenorphine (n=8, median=135 days of use).3.4 An important note to the readerThe ‘days used in the last six months’ column of Table 3 presents the median number ofdays used amongst those reporting recent use of each drug, <strong>and</strong> the ‘days injected in thelast six months’ column of presents the median number of days injected amongst thosereporting recent injection of each drug. Sometimes the number of people reportingrecent injection of a particular drug is low (e.g., prescribed buprenorphine, where n=2),so caution should be exercised when considering the median number of days the recentusers reported injecting the drug in the preceding six months. In the case ofbuprenorphine, one recent injector reported having injected buprenorphine on five daysin the preceding six months, whereas the other reported injecting the drug on 180 days(i.e., daily) in the last six months, resulting in a median number of 135 days injected. Thesame caution should be extended to ‘median number of days used in the last six months’when the proportion of recent users is low.As a guide, since the sample size in 2009 was 80, when a proportion is 12% or less (i.e.,the number of participants is less than 10), caution should be exercised when interpretingthe related results.8
Table 3: Polydrug use history of the sample, 2009<strong>Drug</strong> ClassEverused %Everinjected%Injectedlast 6mths %Daysinjectedlast 6mths *Eversmoked%Smokedlast 6mths %9Eversnorted%Snortedlast 6mths %Everswallowed%Swallowedlast 6mths + %Used^last 6mths %Days intreatment *last 6 mthsHeroin 89 89 75 72 43 6 15 1 21 6 75 72Homebake heroin 39 37 13 6 5 1 0 0 3 1 13 7Any heroin (inc. homebake) 89 89 75 72 43 6 15 1 22 6 75 72Methadone (prescribed) 47 24 6 20 44 12 12 180 180Methadone(not prescribed)36 25 6 2 22 5 10 1Physeptone (prescribed) 9 8 0 0 0 0 0 0 6 0 0 0 0Physeptone(not prescribed)19 17 4 2 0 0 0 0 5 0 4 2Any methadone (inc.Physeptone)60 41 13 6 55 17 22 26Buprenorphine(prescribed)43 18 3 93 1 0 0 0 38 9 10 135 135Buprenorphine(not prescribed)55 47 24 10 4 1 0 0 22 11 31 10Any buprenorphine (exc.buprenorphine-naloxone)70 51 25 10 4 1 0 0 46 19 38 17Buprenorphine-naloxone(prescribed)35 15 6 24 0 0 1 1 35 20 23 60 66Buprenorphine-naloxone(not prescribed)34 24 15 4 0 0 0 0 21 14 22 8Any buprenorphine-naloxone 51 29 19 24 0 0 1 1 43 29 35 42Morphine (prescribed) 26 19 8 20 0 0 0 0 14 3 9 10 10Morphine(not prescribed)60 57 38 24 0 0 0 0 17 6 38 18Any morphine 63 60 41 27 0 0 0 0 26 8 41 24Oxycodone(prescribed)20 15 9 24 0 0 0 0 10 5 10 63 24Oxycodone(not prescribed)51 48 33 15 1 0 0 0 10 4 34 14Any oxycodone 53 49 34 21 1 0 0 0 19 9 35 23Over the CounterCodeine32 1 0 0 0 0 0 0 30 22 23 21Other opioids (notelsewhere classified)19 10 6 50 1 1 0 0 7 7 13 10Source: QLD IDRS IDU interviews, 2009*Among those who had used/injected ^ Refers to any route of administration, i.e. includes use via injection, smoking, swallowing, <strong>and</strong> snortingDaysused^in last 6mths *
Table 3: Polydrug use history of the sample, 2009 (continued)DaysDaysEver Ever InjectedEver Smoked Ever Snorted Ever Swallowed Used^ Days ininjected inused injected last 6smoked last 6 snorted last 6 Swallowed last 6 last 6 treatment<strong>Drug</strong> classlast 6used^ in% % mths %% mths % % mths % % mthsmths *last 6% mths % last 6 mthsmths *Speed powder 89 87 47 24 17 4 32 1 39 6 47 24Base/point/wax 75 75 42 22 9 1 4 0 20 1 42 22Ice/shabu/crystal 85 81 45 11 30 11 5 0 18 4 46 10Amphetamine liquid 41 39 10 24 4 0 10 24Any form methamphetamine # 96 96 70 40 40 16 35 1 53 12 70 31Pharmaceutical stimulants(prescribed)10 4 0 0 0 0 0 0 8 1 1 3Pharmaceutical stimulants(not prescribed)23 9 3 4 1 0 1 0 16 3 4 5Any form pharmaceuticalstimulants30 10 3 4 1 0 1 0 23 4 5 4Cocaine 60 43 12 2 10 1 32 5 10 1 15 2Hallucinogens 60 15 0 0 5 0 0 0 54 13 13 1Ecstasy 69 34 14 2 0 0 16 4 62 17 25 3Benzodiazepines(prescribed)63 4 4 100 1 1 0 0 62 45 45 72Benzodiazepines (notprescribed)51 4 1 80 0 0 0 0 48 34 33 7Any form benzodiazepines 80 7 4 170 1 1 0 0 80 60 59 65<strong>Alcohol</strong> 95 4 0 0 95 70 68 20Cannabis 98 69 150Inhalants 24 9 7Tobacco 98 95 180Source: QLD IDRS IDU interviews, 2009*Among those who had used/injected^ Refers to any route of administration, i.e. includes use via injection, smoking, swallowing, <strong>and</strong> snorting# Category includes speed powder, base, ice/crystal <strong>and</strong> amphetamine liquid (oxblood), does not include pharmaceutical stimulants10
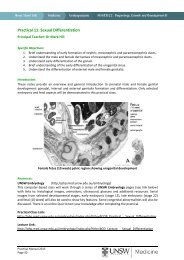
4 HEROINThis section examines patterns of heroin use among the 2009 Queensl<strong>and</strong> IDU sample.Characteristics of the heroin market in Queensl<strong>and</strong> such as price, purity <strong>and</strong> availability are alsoaddressed in this section.4.1 Use4.1.1 Recent patterns of heroin use among participantsFigure 2 illustrates the prevalence <strong>and</strong> frequency of heroin use among participants in the sixmonths preceding interview. Heroin use remained stable in 2009, with 75% of participantsreporting having used the drug in the six months preceding interview (74% in 2008). Forty-sixpercent of participants in 2009 reported heroin as the drug most often injected in the monthprior to interview (36% in 2008) <strong>and</strong> 39% of the 2009 IDU sample stated it was the last druginjected (37% in 2008). The percentage of participants reporting daily use of heroin was 25% in2009 (n=20), compared with 5% in 2008 (n=5), <strong>and</strong> this was a statistically significant increase(21%; 95% CI of difference; -31, -10). Heroin was nominated as the drug of choice for justover half of the participants in 2009 (53%, 63% in 2008).Figure 2: Prevalence <strong>and</strong> frequency of heroin use in the preceding six months, 2001-2009% Participants90807060504030201002001 2002 2003 2004 2005 2006 2007 2008 2009Used last 6 months <strong>Drug</strong> of choice <strong>Drug</strong> most often injected<strong>Drug</strong> last injected Used day before interview Daily useSource: QLD IDRS IDU interviews, 2001-2009Of those participants who had used heroin in the six months prior to the interview in 2009, themedian number of days of use <strong>and</strong> the median number of days injected were both 72 (seeFigure 3). These numbers are higher than those in 2008, when the median number of days ofuse <strong>and</strong> median number days injected were both 48.11
Figure 3: Median days of heroin use <strong>and</strong> injection in the preceding six months, 2001-2009Median days used100806040200907072 7249 5052 52 524048 4826 2628 282001 2002 2003 2004 2005 2006 2007 2008 2009Days usedDays injectedSource: QLD IDRS IDU interviews, 2001-2009Note: Prior to 2003 participants were not asked separately about frequency of injection4.1.2 HomebakeHomebake is a form of heroin made from pharmaceutical products <strong>and</strong> involves the extractionof diamorphine from pharmaceutical opioids such as codeine <strong>and</strong> morphine. In 2009, over onethird(39%) of participants reported that they had used homebake heroin at least once in theirlifetime. Thirteen percent of participants reported the use of homebake heroin in the six monthspreceding interview (9% in 2008, see Figure 4). All who reported recent use of homebake heroinhad injected it; however, 1% reported smoking <strong>and</strong> 1% reported swallowing it in the six monthspreceding interview. In 2009, the median number of days of use of homebake heroin amongstthose reporting recent use of homebake was seven days (four days in 2008).Figure 4: Prevalence <strong>and</strong> frequency of homebake heroin use in the preceding six months,2002-2009% Participants1412108642013994 5 6292002 2003 2004 2005 2006 2007 2008 2009121086420Median days/180Recent useMedian days usedSource: QLD IDRS IDU interviews, 2002-20094.2 Preparation <strong>and</strong> colourBrown heroin was first identified in New South Wales (NSW) by the Medically SupervisedInjecting <strong>Centre</strong> (MSIC) in 2006. Participants in the IDRS first commented on the presence ofbrown heroin in the same year. In 2007, the issue was first investigated by asking participants todescribe the colour forms of heroin they had used over the last six months, in addition to the‘form most used’.Traditionally, heroin originating from the Golden Triangle (where Australia’s heroin haspredominantly originated in the past) has been white or off-white in colour. This form of heroin12
has an acidic (acetone/hydrochloride) base <strong>and</strong> is relatively easy to prepare for injection becauseit is more refined <strong>and</strong> easy to dissolve in water. In contrast, heroin produced in the GoldenCrescent (a region producing heroin that has, historically, been seen very rarely in Australia) hastraditionally been brown in colour <strong>and</strong> is less refined. It requires the use of heat, <strong>and</strong> often anacid, to prepare for injection, <strong>and</strong> was also more amenable to smoking as a route ofadministration.More recently, however, the picture has become less clear, with at least one documented instanceof white acidic heroin production occurring in Afghanistan (Zerell, Ahrens & Gerz, 2005).Furthermore, information from border seizures indicates that it is not possible to determine thegeographic origin of the drug based on colour alone (Australian Federal Police (AFP), personalcommunication). Therefore, while the following information provides an indication of theappearance of heroin used by participants of the IDRS at the street level, it is not possible todraw conclusions about its geographic origin, purity or preparation method required for injectionbased on these data alone. Further research into this area is required before firmer conclusionscan be drawn.4.2.1 Colour <strong>and</strong> formAmong recent heroin users (n=60), 67% reported that they had used heroin powder, which waswhite/off-white in colour in the preceding six months (see Table 4). The majority of theseparticipants reported that the usual form used was white/off-white powder (36%), white/offwhiterock (27%), or brown rock (24%).Table 4: Forms of heroin used <strong>and</strong> most common form used in the preceding six monthsamongst those reporting recent heroin use, QLD, 2009Heroin Type 2009(n=60)Used in past six monthsHeroin powderWhite/off-white (%) 67Brown (%) 38Other colour (%) 5Heroin rockWhite/off-white (%) 55Brown (%) 50Other colour (%) 5Homebake (%) 15Usual form usedHeroin powderWhite/off-white (%) 36Brown (%) 10Other colour (%) 0Heroin rockWhite/off-white (%) 27Brown (%) 24Other colour (%) 3Homebake (%) 0Source: QLD IDRS IDU interviews, 200913
4.2.2 PreparationFor the first time in 2008, participants were asked how often they used heat <strong>and</strong>/or citric/aceticacid in the preparation of white/off-white <strong>and</strong> brown heroin. The 2008 data relating to heroinpreparation methods is presented in Table 5.Table 5: Heroin preparation methods used by recent users in the preceding six months,2008White/off-whiteheroinBrown/beige heroinFrequency of heating heroin (%) (n=66) (n=28)Never 47 39A little of the time 18 11Some of the time 15 18Quite a bit of the time 6 4All of the time 14 29Frequency of using citric/acetic acid (%) (n=35) (n=17)Never 77 59A little of the time 23 18Some of the time 0 6Quite a bit of the time 0 0All of the time 0 18Source: QLD IDRS IDU interviews, 2008In 2009, participants also reported on the methods of preparation they employed when usingheroin. The response scales were changed, however, in that participants were simply asked ifthey had used heat or acid the last time they injected <strong>and</strong>, if so, what colour the heroin was. Ofthose who reported injecting heroin in the six months prior to interview (n=60) 40% said theyhad used heat the last time they injected <strong>and</strong> 6% said they had used acid. Of those who reportedusing either heat or acid the last time they injected heroin (n=24), 35% reported that the heroinwas white, 52% reported that it was brown, <strong>and</strong> 13% reported that it was another colour (namelybeige, light beige, or tan).4.3 PriceFigure 5 presents the median prices paid for the most recently purchased cap, gram, half-gram<strong>and</strong> quarter-gram of heroin (amongst participants who had purchased these quantities of heroinin the six months preceding interview). Prices for all quantities remained stable between 2008<strong>and</strong> 2009.14
Figure 5: Median prices of heroin estimated from most recent participant purchases,2001-2009Median price (AU$)6005004003002001000487.5400380400 400 400 400 400400250230 240220 200 200 200 200 200132.5120 120 120100 100 120 100 10050 50 50 50 505050 50 502001 2002 2003 2004 2005 2006 2007 2008 2009Cap Gram Half gram Quarter gramSource: QLD IDRS IDU interviews, 2001-2009Table 6 presents participant reports of heroin price changes in Queensl<strong>and</strong> in the six monthspreceding interview. Consistent with purchase prices, the majority of participants whocommented on heroin trends in 2009 reported that prices had remained ‘stable’ in the previoussix months (73%, 78% in 2008). A small proportion of participants reported that the price ofheroin had been ‘increasing’ (10%, as in 2008), ‘fluctuating’ (8%, 3% in 2008), or ‘decreasing’(3%, 4% in 2008).Table 6: Participant reports of heroin price changes in the last six months, 2008-200920082009N=104N=80Did not respond (%) 32 25Did respond (%) 68 75Of those who responded n=71 n=60Increasing (%) 10 10Stable (%) 78 73Decreasing (%) 4 3Fluctuating (%) 3 8Don’t know^ (%) 6 5Source: QLD IDRS IDU interviews, 2008-2009^ ‘Don’t know’ refers to participants who responded to questions about availability <strong>and</strong>/or purity, but not price15
4.4 Availability4.4.1 Participant reports of heroin availabilityFigure 6 illustrates participant reports of current heroin availability in Queensl<strong>and</strong>. The majorityof participants who commented on the availability of heroin (n=60) reported that it was ‘easy’(53%, 51% in 2008) or ‘very easy’ (28%, 30% in 2008) to obtain in Queensl<strong>and</strong>. In 2009, theproportion of participants reporting that heroin was ‘difficult’ to obtain (13%) was similar to thatin 2008 (17%). Additionally, the proportion of participants reporting that is was ‘very difficult’to obtain remained stable (5%, 1% in 2008).Figure 6: Participant reports of current heroin availability, 2001-2009% Participants7060504030201002001 2002 2003 2004 2005 2006 2007 2008 2009Very easy Easy Difficult Very difficultSource: QLD IDRS IDU interviews, 2001-2009Participants were also asked to comment on changes in the availability of heroin in Queensl<strong>and</strong>in the six months prior to interview (see Table 7). The majority of participants believed heroinavailability to have remained ‘stable’ (59%, 73% in 2008). Fifteen percent reported that heroinavailability had been ‘more difficult’ <strong>and</strong> 15% reported that heroin availability had been ‘easier’.Table 7: Participant reports of changes in heroin availability in the preceding six months,2008-20092008N=1042009N=80Did not respond (%) 32 25Did respond (%) 68 75Of those who responded n=71 n=60More difficult (%) 11 15Stable (%) 73 59Easier (%) 7 15Fluctuates (%) 4 8Don’t know^ (%) 4 3Source: QLD IDRS IDU interviews, 2008-2009^ ‘Don’t know’ refers to participants who responded to questions about price <strong>and</strong>/or purity, but not availability16
In 2009, the majority (72%) of participants who reported purchasing heroin in the six monthsprior to interview bought it from a known dealer. Fifteen percent obtained heroin throughfriends. The most common places for purchasing heroin were agreed public locations (60%), adealer’s home (15%), <strong>and</strong> home delivery (8%).4.4.2 Heroin detected at the Australian borderThe total weight (in kilograms) <strong>and</strong> number of heroin detections at the border by the AustralianCustoms Service (ACS) from financial years 1998/1999 to 2008/2009 is illustrated in Figure 7.These detections include heroin, opium seeds <strong>and</strong> resin, morphine, <strong>and</strong> pharmaceuticals such asOxycontin ® . The total weight of detections increased from 104.49 kg in 2007/2008 to 150.67 kgin 2008/2009, whilst the total number of detections decreased from 283 to 250 in the same timeperiod. The greatest number of detections was through the mail.Figure 7: Weight <strong>and</strong> number of detections of heroin made at the border by theAustralian Customs Service, financial years 1998/1999-2008/2009Weight in kilograms60050040030020010005092692184203196117349 75 1021515004003002001000Number of detectionsWeightNumberSource: Australian Customs Service4.5 Purity4.5.1 Participant reports of heroin purityParticipants were asked to comment on their perceptions of the purity of heroin in Queensl<strong>and</strong>(see Table 8). The majority of participants who commented perceived it to be to be ‘low’ (43%,49% in 2008), ‘fluctuating’ (23%, 17% in 2008), or ‘medium’ (22%, 25% in 2008). Participantswere also asked to comment on how the purity of heroin had changed over the six months priorto interview. The majority of participants who commented reported it had been ‘decreasing’(32%, 20% in 2008), ‘stable’ (29%, 27% in 2008), or ‘fluctuating’ (20%, 27% in 2008).17
Table 8: Participant perceptions of heroin purity in the past six months, 2008-2009Current purityDid not respond (%)Did respond (%)2008N=10432682009N=80Of those who responded n=71 n=60High (%) 4 8Medium (%) 25 22Low (%) 49 43Fluctuates (%) 17 23Don’t know^ (%) 4 3Purity change over the last six monthsDid not respond (%)Did respond (%)Of those who responded n=71 n=59Increasing (%) 17 15Stable (%) 27 29Decreasing (%) 20 32Fluctuating (%) 27 20Don’t know^ (%) 10 3Source: QLD IDRS IDU interviews, 2008-2009^ ‘Don’t know’ refers to participants who responded to questions about price <strong>and</strong>/or availability, but not purity3268257526744.5.2 Seizure dataThe median purity <strong>and</strong> number of heroin seizures recorded by Queensl<strong>and</strong> Police Service (QPS)<strong>and</strong> AFP in Queensl<strong>and</strong> from the financial years 2001/2002 to 2007/2008 are shown by quarterin Figures 8 <strong>and</strong> 9 respectively. It is important to note that the figures do not represent the puritylevels of all heroin seizures, only those that have been analysed at a forensic laboratory.Additionally, no adjustment has been made to account for double-counting joint operationsbetween the AFP <strong>and</strong> QPS.The purity of QPS seizures between January-March 2007 <strong>and</strong> January-March 2008 has remainedrelatively stable between 13% <strong>and</strong> 16%. The purity of AFP seizures, however, droppedmarkedly from 56% in July-September 2007 to 27% in January-March 2008. The number ofQPS seizures between January-March 2007 <strong>and</strong> January-March 2008 has varied, with peaks inJanuary-March 2007, July-September 2008, <strong>and</strong> October-December 2008 (65, 69, <strong>and</strong> 82respectively. The number of AFP seizures, has remained relatively stable during the same 12-month period between zero <strong>and</strong> three (this is not unusual since AFP seizures reflect borderinterceptions <strong>and</strong> are often smaller in number but higher in purity <strong>and</strong> weight).18
Figure 8: Median purity of heroin seizures analysed in Queensl<strong>and</strong>, by quarter,2001/2002-2007/2008Median purity (%)80706050403020100QPSAFPSource: ABCI, 2001-2002; ACC, 2003-2008Note: Figures represent the purity levels of heroin seized by QPS/AFP in the relevant quarter. The period between the date ofseizure by police <strong>and</strong> the date of receipt at the laboratory can vary greatlyFigure 9: Number of heroin seizures analysed in Queensl<strong>and</strong>, by quarter, 2001/2002-2007/2008Number of seizures300250200150100500QPSAFPSource: ABCI, 2001-2002; ACC, 2003-20084.6 KE commentsSix KE commented on trends in the heroin market. In terms of socio-demographiccharacteristics, several KE commented that, among the heroin users they had come into contactwith, many had prison histories <strong>and</strong> many had mental health problems such as depression <strong>and</strong>anxiety. They also noted that most of the heroin users they had had contact with wereunemployed. Several KE noted that heroin users were an aging population. Not all KE agreedon this point, however, with more than one commenting that many of the heroin users they hadhad contact with were approximately 25-35 years old.19
In terms of the purity <strong>and</strong> price of heroin, the majority of KE reported that the price tends toremain stable whilst the purity can fluctuate markedly. It was noted that Queensl<strong>and</strong> is typicallya secondary supply market in that heroin predominantly arrives in the country at Sydney orMelbourne <strong>and</strong> is then supplied to Queensl<strong>and</strong>, meaning that the purity has often been furtherreduced by the time it is sold to users in this state. Regarding the origin of heroin, lawenforcement KE suggested that 50% of the heroin in Australia currently comes from Burma <strong>and</strong>50% comes from Afghanistan, <strong>and</strong> that it is increasingly difficult to discern the origin of heroinfrom its colour (i.e., both the Golden Crescent <strong>and</strong> Golden Triangle are producing white <strong>and</strong>brown heroin).4.7 Summary of heroin trendsTable 9 summarises trends in heroin use, price, purity, <strong>and</strong> availability.Table 9: Summary of heroin trends, QLD, 2008-2009Use • Recent use of heroin remained stable (74% of participants in 2008, 75%in 2009)• Median number of days of use in the preceding six months (amongstrecent users) increased from 48 in 2008 to 72 in 2009• The proportion of participants reporting daily use in the preceding sixmonths increased significantly from 5% in 2008 to 25% in 2009• 63% of recent heroin users reported that white/off-white powder or rockwas the form they used most often in the preceding six months, whilst34% reported using brown powder or rockPrice (median) • Cap: stable at $50, Gram: stable at $400• Majority of IDU reported recent prices had been ‘stable’Availability • Majority reported that recent heroin availability had been ‘stable’• ACS data indicates that the total weight of heroin detections at the borderincreased from 104.49 kg in the 2007/2008 financial year to 150.67 kg inthe 2008/2009 financial yearPurity • Majority reported that heroin purity had been ‘stable’ (29%), ‘decreasing’(32%), or ‘fluctuating’ (20%) in the preceding six months20
5 METHAMPHETAMINEThe 2009 IDRS questionnaire collected data on three different forms of methamphetamine:methamphetamine powder or ‘speed’, base methamphetamine or ‘base’, <strong>and</strong> crystalmethamphetamine or ‘crystal/ice’. Differentiating between speed, base <strong>and</strong> ice ensures that anydifferences in the price, purity <strong>and</strong> availability of each individual form of methamphetamine canbe observed <strong>and</strong> monitored over time.In 2009, 56% of the entire sample was able to comment on trends in the price, purity, availability<strong>and</strong> use of speed. Forty percent of all participants were able to comment on base <strong>and</strong> 44% of thesample was able to comment on ice trends.5.1 Use5.1.1 Methamphetamine use among participants: SummaryAny methamphetamineIn 2009, 96% of participants (n=77) reported having used some form of methamphetamine (i.e.speed, base, ice, amphetamine liquid) at least once in their lifetime. Ninety-six percent ofparticipants also reported having injected some form of methamphetamine at least once in theirlifetime. Between half <strong>and</strong> one-third of the sample reported ever swallowing (53%), smoking(40%), or snorting (35%) some form of methamphetamine in their lifetime. Sixty-one percent ofparticipants reported some form of methamphetamine as the first drug they injected (almosttwice the number of participants who reported heroin as the first they drug injected, at 33%).Methamphetamine powder ‘Speed’Eighty-nine percent of participants (n=71) reported having used speed in their lifetime <strong>and</strong> 87%reported having injected speed in their lifetime. Approximately, one-third reported that they hadsnorted (39%) or swallowed (31%) speed in their life.Base methamphetamine ‘Base’Seventy-five percent of participants (n=60) reported ever having used base <strong>and</strong> 75% reportedhaving ever injected base. Other routes of administration for base use were less common, with9% of the 2009 sample reporting having ever smoked, 4% ever snorted, <strong>and</strong> 20% ever swallowedthis form of methamphetamine.Crystal methamphetamine ‘Ice’Eighty-five percent of participants (n=68) reported having ever used crystal <strong>and</strong> 81% percentreported having ever injected crystal. Almost one-third (30%) of participants reported that theyhad ever smoked ice, 5% ever snorted it, <strong>and</strong> 18% ever swallowed it.21
5.1.2 Current patterns of methamphetamine useAny methamphetamineIn 2009, 70% of participants (n=56) reported the use of some form of methamphetamine in thesix months preceding interview (59% in 2008). The most common route of administration wasinjection (70% of all participants). Sixteen percent of the sample reported that they had smokedsome form of methamphetamine in the preceding six months. Smaller proportions reportedrecently snorting (1%) or swallowing it (12%).Methamphetamine powder ‘Speed’Forty-seven percent of participants (n=37) reported the use of speed in the six monthspreceding interview (35% in 2008, see Figure 10). The most common route of administrationwas injection, also reported by 47% of participants in the sample. Smaller proportions of thesample reported smoking (4%), snorting (1%) <strong>and</strong> swallowing (6%) speed in the preceding sixmonths. Median days of use <strong>and</strong> injection amongst those reporting speed use in the precedingsix months were both 24 days (approximately four times a month, double that in 2008). Twoparticipants reported daily use of speed during that time. From the entire sample, 42% ofparticipants reported that speed was the first drug ever injected, 13% reported speed as the mostcommon drug they injected in the previous month (10% in 2008), 19% reported speed as themost recent drug injected (12% in 2008), <strong>and</strong> 8% reported that they had used speed on the dayprior to interview (5% in 2008). Six percent of the sample reported speed was their drug ofchoice, the same proportion as in 2008.Base methamphetamine ‘Base’Forty-one percent of participants (n=33) reported the recent use of base in 2009 (34% in 2008;see Figure 10). Injection was the most common route of administration (42% of the sample).Smoking, snorting <strong>and</strong> swallowing were less frequently reported as recent routes ofadministration of base (1%, 0%, <strong>and</strong> 1% of the sample respectively). Median days of use <strong>and</strong>injection amongst those reporting base use in the preceding six months were both 22 (24 in2008), approximately three times a month. Two participants reported having used base daily inthe preceding six months. Eight percent of participants reported that base was the most frequentdrug injected in the preceding month (6% in 2008). Five percent reported that they had usedbase on the day preceding interview (3% in 2008). Four percent stated base was the most recentdrug they injected (6% in 2008). Five percent reported that base was the first drug injected (6%in 2008). Three percent nominated base as their drug of choice (4% in 2008).Crystal methamphetamine ‘Ice’Forty-seven percent of participants (n=37) reported the recent use of ice (40% in 2008, seeFigure 10). Injection was the most common route of administration (45% of the sample).Smoking, snorting <strong>and</strong> swallowing were less frequently reported as recent routes ofadministration of ice (11%, 0%, <strong>and</strong> 4% of the sample respectively). Median days of use <strong>and</strong>injection among those reporting ice use in the preceding six months were 10 <strong>and</strong> 11 respectively(both were 12 in 2008), approximately twice a month. No participant reported having used icedaily in the preceding six months. Ten percent of participants reported that ice was the mostfrequent drug injected in the preceding month (12% in 2008). Eight percent reported that theyhad used ice on the day preceding interview (7% in 2008). Ten percent stated ice was the most22
ecent drug they injected (as in 2008). Five percent reported that ice was the first drug injected(3% in 2008). Nine percent nominated ice as their drug of choice (as in 2008).Liquid amphetamineIn 2009, 41% of participants (n=33) reported that they had used liquid amphetamine at leastonce in their lifetime. Only 10% (n=8), however, reported the recent use of liquid amphetamine.Due to these low numbers liquid amphetamine will not be reported on in any more detail.Figure 10: Percentage of participants reporting recent use of methamphetamine forms,2001-2009% Participants807060504030201002001 2002 2003 2004 2005 2006 2007 2008 2009Speed Base Crystal LiquidSource: QLD IDRS IDU interviews, 2001-20095.2 PriceThe median prices of participants’ last purchase of each form of methamphetamine arepresented in Table 10. Reports of changes in price in the six months preceding interview for2009 are presented in Table 11.5.2.1 Methamphetamine powder ‘Speed’Overall, 44 participants commented on current speed prices in 2009. Between 2008 <strong>and</strong> 2009there were no changes in the median prices of a point (0.1 g), a half-gram, or a gram of speed(based on participant reports of their last purchase of each quantity). The median price of aneightball (3.5 g), however, had increased to $600 from $500 in 2008. Of those who commentedon changes in speed prices over the last six months (n=44), the majority (61%) perceived speedprices as stable.5.2.2 Base methamphetamine ‘Base’Overall, 32 participants commented on current base prices in 2009. Between 2008 <strong>and</strong> 2009,there were no changes in the median prices of a point (0.1 g), a half-gram, a gram, or an eightball(3.5 g) of base (based on participants’ reports of their last purchase of each quantity). Of thosewho commented on changes in base prices over the last six months (n=32), the majority (59%)perceived base prices as stable.23
Table 10: Price of most recent methamphetamine purchase by participants, 2008-2009Amount Median price *AU$SpeedPoint (0.1 g)Half-gram (0.5 g)Gram (1 g)Eightball (3.5 g)BasePoint (0.1 g)Half-gram (0.5 g)Gram (1 g)Eightball (3.5 g)IcePoint (0.1 g)Half-gram (0.5 g)Gram (1 g)Eightball (3.5 g)50 (50)100 (100)200 (200)600 (500)50 (50^)100 (100)200 (200)500 (500^)50 (50)100 (200)350 (275)1200^ (750^)Range *AU$20-80 (20-50)80-280 (25-250)100-400 (150-600)450-1050 (300-1200)20-100 (25-50^)100-200 (100-200)150-500 (100-300)400-1300 (350-1200^)20-60 (20-100)100-250 (100-300)40-500 (150-600)1050-1500^ (500-1200^)Source: QLD IDRS IDU interviews, 2008-2009* 2008 data are reported in brackets; ^ Small numbers (less than 10) reporting, interpret with cautionNumber ofpurchasers *24 (19)24 (21)22 (18)17 (13)12 (7)17 (10)20 (11)13 (6)15 (14)13 (13)10 (12)6 (8 )5.2.3 Crystal methamphetamine ‘Ice’Overall, 35 participants were able to comment on current ice prices in 2009. Between 2008 <strong>and</strong>2009, there were no changes in the median prices of a point (0.1 g) of ice (based on participantreports of their last purchase of each quantity). Interestingly, however, the median price of ahalf-gram of ice decreased to $100 in 2009 from $200 in 2008. Conversely, the median prices fora gram <strong>and</strong> an eightball (3.5 g) of ice had increased to $350 <strong>and</strong> $1,200 respectively in 2009 (from$275 <strong>and</strong> $750 respectively in 2008). The median price for an eightball of ice should beinterpreted with caution, however, as only six participants were able to respond to this questionin 2009. Of those who commented on changes in ice prices over the last six months (n=35), themajority (54%) perceived speed prices as stable. Twenty-three percent, however, reported themas increasing.24
Table 11: Participants’ reports of methamphetamine price changes in the last six monthsin QLD, 2009Methamphetamine powder2009N=80Did not respond (%) 45Did respond (%) 55Of those that responded n=44Increasing (%)Stable (%)Decreasing (%)Fluctuating (%)Don’t know (%)Base methamphetamineDid not respond (%) 60Did respond (%) 40Of those that responded n=32Increasing (%)13Stable (%)Decreasing (%)Fluctuating (%)Don’t know (%)Crystal methamphetamineDid not respond (%) 56Did respond (%) 44Of those that responded n=35Increasing (%)23Stable (%)Decreasing (%)Fluctuating (%)Don’t know (%)Source: QLD IDRS IDU interviews, 2009256127559016125401495.3 AvailabilityParticipant reports of current methamphetamine availability <strong>and</strong> changes in availability in the sixmonths preceding interview in 2008 <strong>and</strong> 2009 are presented in Table 12. Indicator data relatingto the number <strong>and</strong> weight of amphetamine seizures over recent years is presented in Figure 11.25
5.3.1 Participant reports of methamphetamine powder ‘Speed’ availabilityParticipant reports of the current availability of speed remained stable between 2008 <strong>and</strong> 2009,with the majority of participants reporting that it was ‘very easy’ (50%) or ‘easy’ (23%) to obtain(see Table 12). In terms of changes in the availability of speed in the six months precedinginterview in 2009, the majority of participants who commented (57%) reported that availabilityhad been stable. In 2009, the majority of participants who had bought speed recently reportedpurchasing it from known dealers (39%) or friends (32%).Table 12: Participants’ reports of methamphetamine availability in the preceding sixmonths, 2008-2009Current availabilitySpeed powder Base Crystal2009 2008 2009 2008N=80 N=104 N=80 N=1042008N=1042009N=80Did not respond * (%)64 45 77 60 70 56Did respond (%)36 55 23 40 30 44Of those who responded: n=37 n=44 n=24 n=32 n=31 n=35Very easy (%) 34 50 29 38 36 23Easy (%) 37 23 50 41 42 29Difficult (%) 16 21 13 16 12 26Very difficult (%) 5 5 0 3 7 14Don’t know^ (%) 8 2 8 3 3 9Changes to availabilityDid not respond * (%)64 45 77 60 70 56Did respond (%)36 55 23 40 30 44Of those who responded: n=37 n=44 n=24 n=32 n=31 n=35More difficult (%) 18 25 8 13 13 31Stable (%) 63 57 75 63 71 40Easier (%) 3 11 4 9 10 9Fluctuates (%) 5 5 8 9 0 11Don’t know^ (%) 11 2 4 6 7 9Source: QLD IDRS IDU interviews, 2008-2009^ ‘Don’t know’ refers to participants who responded to questions about price <strong>and</strong>/or purity, but not availability5.3.2 Participant reports of base methamphetamine ‘Base’ availabilityParticipant reports of the current availability of base also remained stable between 2008 <strong>and</strong>2009, with the majority of participants reporting that it was ‘very easy’ (38%) or ‘easy’ (41%) toobtain (see Table 12). In terms of changes in the availability of base in the six monthspreceding interview, the majority of participants who commented (63%) reported that availabilityhad been stable. In 2009, the majority of participants who bought base in the previous sixmonths reported purchasing it from known dealers (50%), friends (19%), or acquaintances.26
5.3.3 Participant reports of crystal methamphetamine ‘Ice’ availabilityParticipant reports of the current availability of ice also remained stable between 2008 <strong>and</strong> 2009,with the majority of participants reporting that it was ‘very easy’ (23%) or ‘easy’ (29%) to obtain.In terms of changes in the availability of ice in the six months preceding interview, 40% ofparticipants who commented reported that availability had been ‘stable’ <strong>and</strong> 31% or participantsreported it had been ‘more difficult’. In 2009, the majority of participants who bought ice in theprevious six months reported purchasing it from known dealers (40%) or friends (34%).5.3.4 Amphetamine-type stimulants detected at the Australian borderThe total weight (in kilograms) <strong>and</strong> number of amphetamine-type stimulants (ATS) detections atthe border by the ACS from the financial years 1998/1999 to 2008/2009 is shown in Figure 11.ATS detections include amphetamines <strong>and</strong> methamphetamines in power, tablet, capsule, liquid,or paste form (but do not include MDMA). The total weight of detections increased from263.33 kg in 2007/2008 to 416.56 kg in 2008/2009, whilst the total number of detectionsdecreased from 568 to 392 in the same time period. The greatest number of detections wasthrough the mail.Figure 11: Weight <strong>and</strong> number of amphetamine-type stimulants *Australian Customs Service, financial years 1998/1999-2008/2009detections by theWeight in kilograms50045040035030025020015010050011 2285429240615791272634178007006005004003002001000Number of detectionsWeightNumberSource: Australian Customs Service* Includes amphetamine, methamphetamine <strong>and</strong> crystal methamphetamine detections, but excludes MDMA5.4 PurityParticipant reports of the current purity of methamphetamines are illustrated in Figure 12.5.4.1 Participant reports of methamphetamine powder ‘Speed’ purityThe current purity of speed was most frequently reported to be ‘low’ (41%) or ‘fluctuating’(23%) among those who commented in 2009 (n=43). The majority of those who commented onchanges in speed purity in the six months preceding interview (n=44) reported that it had been‘decreasing’ (32%), ‘fluctuating’ (25%), or ‘stable’ (23%).27
5.4.2 Participant reports of methamphetamine base ‘Base’ purityAmong those who commented on base in 2009 (n=32), 28% reported current base purity to be‘medium’ <strong>and</strong> 22% reported it to be ‘high’. The majority of those who commented on changesin base purity over the preceding six months (n=32) reported that it had been ‘stable’ (34%),‘fluctuating’ (28%), or ‘decreasing’ (16%).5.4.3 Participant reports of crystal methamphetamine ‘Ice’ purityThe current purity of ice was most frequently reported to be ‘high’ (40%) or ‘medium’ (23%)among those who commented in 2009 (n=35). The majority of those who commented onchanges in ice purity in the six months preceding interview (n=35) reported that it had been‘stable’ (31%), or ‘fluctuating’ (31%).Figure 12: Perceptions of speed, base <strong>and</strong> ice purity among participants whocommented, 2009% Participants454035302520151050941402823 22231819 1914Speed Base Ice14High Medium Low FluctuatesSource: QLD IDRS IDU interviews, 20095.4.4 Seizure dataThe median purity <strong>and</strong> number of methamphetamine seizures recorded by QPS <strong>and</strong> AFP inQueensl<strong>and</strong> between 2001/2002 <strong>and</strong> 2007/2008 are shown by quarter in Figures 13 <strong>and</strong> 14.Seizure data do not distinguish between ice <strong>and</strong> other forms of generally domestically producedmethamphetamine, rendering fluctuations in purity difficult to interpret. It is important to notethat figures do not represent the purity levels of all methamphetamine seizures, only those thathave been analysed at a forensic laboratory. Additionally, no adjustment has been made toaccount for double-counting joint operations between the AFP <strong>and</strong> QPS.The purity of QPS seizures between January-March 2007 <strong>and</strong> January-March 2008 has remainedrelatively stable between 10% <strong>and</strong> 16%. The number of QPS seizures during the same timeperiod peaked in January-March 2007 at 519 before falling to a low of 111 in April-June 2007.In the following three quarters, the numbers stabilised again in the mid three-hundreds to midfour-hundreds. The AFP recorded only one seizure during the same calendar year, in January-March 2007, with a purity of 38% (this is not unusual since AFP seizures reflect borderinterceptions <strong>and</strong> are often smaller in number but higher in purity <strong>and</strong> weight).28
Figure 13: Median purity of methamphetamine seizures analysed in Queensl<strong>and</strong>, byquarter, 2001/2002-2007/2008Median purity (%)9080706050403020100QPSAFPSource: ABCI, 2001-2002; ACC, 2003-2008Note: Figures represent the purity levels of methamphetamine seized by QPS/AFP in the relevant quarter. The period betweenthe date of seizure by police <strong>and</strong> the date of receipt at the laboratory can vary greatlyFigure 14: Number of methamphetamine seizures analysed in Queensl<strong>and</strong>, by quarter,2001/2002-2007/2008Number of seizures7006005004003002001000QPSAFPSource: ABCI, 2001-2002; ACC, 2003-20085.5 KE commentsSix KE commented on trends in the methamphetamine market. In terms of socio-demographiccharacteristics, several KE commented that, among the methamphetamine users they had comeinto contact with, many had prison histories <strong>and</strong> many had mental health problems such asdepression <strong>and</strong> anxiety. They also noted that most of the methamphetamine users they had hadcontact with were unemployed. The majority of KE noted that methamphetamine users tendedto be males in their 20s <strong>and</strong> 30s, <strong>and</strong> two KE commented that there appeared to have been anincrease in the number of methamphetamine users in the previous 12 months (note that therewas not a significant increase, however, in the proportion of IDRS participants reporting recentuse of methamphetamines between 2008 <strong>and</strong> 2009).In terms of purity, law enforcement KE commented that the current purity of streetmethamphetamines was approximately 17%. These KE also noted that methamphetamines arepredominantly manufactured domestically but that there has been an increase in the importation29
of pre-cursor chemicals. Additionally, they commented that within Australia, Queensl<strong>and</strong> hasthe greatest number of cl<strong>and</strong>estine laboratories producing small amounts of methamphetamine.5.6 Summary of methamphetamine trendsTable 13 summarises trends in methamphetamine use, price, purity, <strong>and</strong> availability.Table 13: Summary of methamphetamine trends, QLD, 2008-2009UsePrice (median)AvailabilityPurityMethamphetamine powder (speed)• Proportion reporting recent use stable (47% in 2009)• Median number of days of use in preceding six months increased to 24 in2009 (12 in 2008)Methamphetamine base (base)• Proportion reporting recent use stable (41% in 2009)• Median number of days of use in preceding six months stable (22 in 2009)Crystal methamphetamine (ice/crystal)• Proportion reporting recent use stable (47% in 2009)• Median number of days of use in the preceding six months stable (10 in2009)Methamphetamine powder (speed)• Point: stable at $50, Gram: stable at $200• Majority reported recent prices had been ‘stable’Methamphetamine base (base)• Point: stable at $50, Gram: stable at $200• Majority reported recent prices had been ‘stable’Crystal methamphetamine (ice/crystal)• Point: stable at $50, Gram: increased to $350 from $275 in 2008• Majority reported recent prices had been ‘stable’Methamphetamine powder (speed)• Majority reported speed was ‘easy’ or ‘very easy’ to obtain• Majority reported recent speed availability had been ‘stable’Methamphetamine base (base)• Majority reported base was ‘easy’ or ‘very easy’ to obtain• Majority reported recent base availability had been stableCrystal methamphetamine (ice/crystal)• Majority reported ice was ‘easy’ or ‘very easy’ to obtain (although onequarterreported it was ‘difficult’)• Majority reported that recent ice availability had been ‘stable’ or ‘moredifficultMethamphetamine powder (speed)• Majority reported that current speed purity was ‘low’ or ‘fluctuating’Methamphetamine base (base)• Majority reported that current base purity was ‘high’ or ‘medium’Crystal methamphetamine (ice/crystal)• Majority reported that current ice purity was ‘high’ or ‘medium’30
6 COCAINEIn 2009, 15% of participants (n=12) reported having used cocaine in the six months precedinginterview. Additionally, only five participants could comment on trends in price, purity, <strong>and</strong>/oravailability. Due to the small number of respondents, caution needs to be exercised ininterpreting the trends discussed in this chapter.6.1 Use6.1.1 Cocaine use among participantsIn 2009, 60% of participants (n=47) reported using cocaine at sometime during their life. Fortythreepercent of participants (n=32) reported having injected it, 10% (n=7) having smoked it,32% (n=24) having snorted it, <strong>and</strong> 10% (n=7) having swallowed it during their lifetime.6.1.2 Current patterns of cocaine useThe proportion of 2009 participants reporting cocaine use in the previous six months was 15%(13% in 2008, see Figure 15). Twelve percent of participants reported having injected it, 1%reported having smoked it, 5% reported having snorted it, <strong>and</strong> 1% reported having swallowed itin the preceding six months. Of those reporting recent cocaine use (n=12), the median numberof days used in the preceding six months was two. Fifty-eight percent (n=7) of those reportingrecent use stated they had used cocaine powder, 17% (n=2) reported using crack cocaine, <strong>and</strong>42% (n=34) reported using rock in the preceding six months. No participant reported cocaineas their drug of choice. Additionally, no participant reported using cocaine on the day prior tointerview.Figure 15: Proportion of QLD IDU sample reporting cocaine use in the preceding sixmonths, 2001-2009% Participants30201002001 2002 2003 2004 2005 2006 2007 2008 2009% Used cocaine in preceding 6 monthsSource: QLD IDRS IDU interviews, 2001-20096.2 PriceThe median prices paid for cocaine by participants in the QLD sample in 2009 on the lastoccasion of purchase are presented in Table 14. As there are only small numbers reporting,comparisons cannot be made to the previous year. In 2009, no participant could comment onthe price of a cap or a quarter-gram of cocaine. One participant commented on the price of ahalf-weight (0.5 g) of cocaine ($180). Two participants were able to comment on the price of agram of cocaine, which had a median price of $325.31
Table 14: Median price of most recent cocaine purchases by participants, 2008-2009Amount Median price * $ Range * $Number ofpurchasers *Cap - (-) - (-) 0 (0)Quarter-gram - (-) - (-) 0 (0)‘Half-weight’ (0.5 g) 180 (-) 180-180 (-) 1 (0)Gram 325 (450) 300-450 (300-800) 2 (4)Source: QLD IDRS IDU interviews, 2008-2009* 2008 data are presented in bracketsAs in 2008, 94% of the 2009 participants did not comment on changes in cocaine prices in thepreceding six months. Of the 6% who did comment, three participants reported that prices hadremained stable.6.3 Availability6.3.1 Participant reports of cocaine availabilityOf those participants who commented on current trends in the cocaine market (n=5), fourpeople were commented on patterns of availability. One participant stated cocaine was currently‘very easy’ to obtain, one participant said it was ‘easy’, <strong>and</strong> two said it was ‘difficult’. In terms ofhow the ease of access had changed in the preceding six months, one participant said it had been‘more difficult’ <strong>and</strong> three participants said it had been ‘stable’.6.3.2 Cocaine detected at the Australian borderThe total weight (in kilograms) <strong>and</strong> number of cocaine detections at the border by the ACS fromthe financial years 1998/1999 to 2008/2009 is illustrated in Figure 16. The total weight ofdetections decreased from 655.94 kg in 2007/2008 to 506.29 kg in 2008/2009, <strong>and</strong> the totalnumber of detections also decreased from 627 to 359 in this time period.Figure 16: Weight <strong>and</strong> number of cocaine detections made at the border by theAustralian Customs Service, financial years 1998/1999-2008/2009Weight in kilograms11001000900800700600500400300200100029279242698462.00138 19778610 6565067006005004003002001000Number of detectionsWeightNumberSource: Australian Customs Service32
6.4 Purity6.4.1 Participant perceptions of cocaine purityOf those participants who commented on current trends in the cocaine market (n=5), fourpeople commented on purity/strength. Two participants stated current purity was ‘high’ <strong>and</strong>two stated it was ‘medium’. In terms of how purity/strength had changed in the preceding sixmonths, one participant said it had been ‘increasing’ <strong>and</strong> one said it had been ‘decreasing’; onesaid had been ‘stable’ <strong>and</strong> one said had been ‘fluctuating’. Given the small number ofparticipants able to comment on purity, it is very difficult to draw any firm conclusions from thisdata.6.4.2 Seizure dataThe median purity <strong>and</strong> number of cocaine seizures recorded by QPS <strong>and</strong> AFP in Queensl<strong>and</strong>from the financial years 2001/2002 to 2007/2008 are shown by quarter in Figures 17 <strong>and</strong> 18respectively. It is important to note that figures do not represent the purity levels of all cocaineseizures, only those that have been analysed at a forensic laboratory. Additionally, no adjustmenthas been made to account for double-counting joint operations between the AFP <strong>and</strong> QPS.The purity of seizures by the QPS between January-March 2007 <strong>and</strong> January-March 2008 hasslowly risen from 29% to 42%, whilst the number of seizures has fluctuated during this period.The purity of seizures by AFP also rose from 75% in January-March 2007 to 85% in April-June2007, <strong>and</strong> then remained stable until January-March 2008. The number of seizures by the AFPremained relatively stable during the same 12-month period, with a peak of eight in January-March 2007.Figure 17: Median purity of cocaine seizures analysed in Queensl<strong>and</strong>, by quarter,financial years 2001/2002-2007/2008Median purity (%)9080706050403020100QPSAFPSource: ABCI, 2001-2002; ACC, 2003-2008Note: Figures represent the purity levels of cocaine seized by QPS/AFP in the relevant quarter. The period between the date ofseizure by police <strong>and</strong> the date of receipt at the laboratory can vary greatly33
Figure 18: Number of cocaine seizures analysed in Queensl<strong>and</strong>, by quarter, financialyears 2001/2002-2007/2008Number of seizures706050403020100QPSAFPSource: ABCI, 2001-2002; ACC, 2003-20086.5 Summary of cocaine trendsTable 15 summarises the trends in use, price, purity <strong>and</strong> availability of cocaine.Table 15: Summary of cocaine trends, QLD, 2009Use • Proportion reporting recent use remained stable (15% in 2009)• Median days of use in the preceding six months was two• Injecting was the most common route of administrationPrice (median) • Gram: $325 (n=2)Availability • Mixed reports (n=5)• ACS data indicates that the total weight of cocaine detections at theborder decreased from 655.94 kg in the 2007/2008 financial year to506.29 kg in the 2008/2009 financial yearPurity • Mixed reports (n=5)34
7 CANNABISIn 2009, 61% (n=49) of the IDU sample reported being able to distinguish between indoorcultivatedcannabis (hydro) <strong>and</strong> outdoor-cultivated cannabis (bush). Of these participants, 74%(n=36) commented on trends in the hydro market, <strong>and</strong> 69% (n=34) reported on trends in thebush market.7.1 Use7.1.1 Cannabis use among participantsIn 2009, nearly all participants (98%, n=78) reported using cannabis at least once in theirlifetime. Sixty-nine percent of participants (n=55) reported use of cannabis in the preceding sixmonths (82% in 2008).7.1.2 Current patterns of cannabis useAmongst those reporting recent cannabis use, the median number of days of use in the previoussix months was 150 (more than double that in 2008 at 72 days). Forty-six percent of participantsreporting recent use said they used cannabis on a daily basis in the preceding six months (33% in2008). In terms of the drugs participants reported taking the day before interview, cannabis wasone of the two most commonly named (35% of the IDU sample, same as for heroin). Seventeenpercent of participants reported cannabis as their drug of choice (8% in 2008). Percentagesregarding the prevalence <strong>and</strong> frequency of cannabis use among participants are shown in Figure19.Figure 19: Prevalence <strong>and</strong> frequency of cannabis use among participants, 2001-2009100% Participants8060402002001 2002 2003 2004 2005 2006 2007 2008 2009Used last 6 months Used day before interview Daily use <strong>Drug</strong> of choiceSource: QLD IDRS IDU interviews, 2001-2009Of those respondents who had used cannabis in the six months prior to the interview, 89% hadused hydro (95% in 2008), 71% had used bush (58% in 2008), 18% had used hash (11% in2008), <strong>and</strong> 7% reported using hash oil (10% in 2008). Hydro was the form of cannabis usedmost often in the preceding six months for the majority (81%) of recent users.35
7.2 PriceThe median prices for hydro <strong>and</strong> bush cannabis (based on participant reports of the price oftheir last purchase) are shown in Table 16. Participants perceptions of prices changes in thehydro <strong>and</strong> bush cannabis markets in the last six months are shown in Table 17.7.2.1 HydroPrices for a gram <strong>and</strong> an ounce of hydro remained stable between 2008 <strong>and</strong> 2009. Prices for aquarter-ounce <strong>and</strong> half-ounce of hydro both appeared to drop by $10 each from 2008 to $170<strong>and</strong> $300 respectively in 2009. Of those who commented on recent changes in the price ofhydro (n=34), the majority (72%) said that prices had remained stable.7.2.2 BushPrices for a gram <strong>and</strong> a quarter-ounce of bush remained stable between 2008 <strong>and</strong> 2009. Pricesfor a half-ounce <strong>and</strong> an ounce of bush appeared to increase to $140 <strong>and</strong> $280 respectively in2009 (from $120 <strong>and</strong> $220 respectively in 2008). Of those who commented on recent changes inthe price of hydro (n=34), the majority (65%) said that prices had remained stable.Table 16: Median price of participants’ most recent cannabis purchases 2008-2009Amount Median price * AU$ Range * AU$HydroGramQuarter-ounceHalf-ounceOunceBushGramQuarter-ounceHalf-ounceOunce25 (25)90 (100)170 (180)300 (300)20 (20)70 (70^)140 (120^)280 (220)Source: QLD IDRS IDU interviews, 2008-2009* 2008 data are reported in brackets^ Small numbers reporting (n=less than 10)12-25 (15-25)80-100 (80-120)150-200 (150-200)280-400 (200-400)8-25 (10-25)30-120 (60-100)100-360 (75-150^)60-400 (120-400)Number ofpurchasers *16 (29)23 (31)12 (16)17 (28)11 (16)19 (8)13 (7)19 (21)7.2.3 Hash <strong>and</strong> hash oilFive participants answered questions on the recent price of hash or hash oil. Four participantsreported on the price of a gram of hash, resulting in a median price of $65 <strong>and</strong> a range of $25-$85. One participant reported on the price of a cap of hash oil, stating it cost $50.36
Table 17: Participant reports of cannabis price changes in the last six months in QLD,2009Hydro2009N=80Did not respond (%) 57Did respond (%) 43Of those that responded n=34BushIncreasing (%)Stable (%)Decreasing (%)Fluctuating (%)Did not respond (%) 57Did respond (%) 43Of those that responded n=34Increasing (%)Stable (%)Decreasing (%)Fluctuating (%)Source: QLD IDRS IDU interviews, 2009147231117651267.3 AvailabilityParticipant reports of current cannabis availability <strong>and</strong> changes in availability in the six monthspreceding interview are presented in Table 18. Indicator data relating to the number <strong>and</strong> weightof amphetamine seizures over recent years is presented in Figure 20.7.3.1 HydroOf those that commented on the current availability of hydro (n=36), the majority stated that itwas ‘very easy’ (64%) or ‘easy’ (28%) to obtain (45% <strong>and</strong> 43% respectively in 2008). In terms ofrecent changes to availability, of those who commented (n=36), the majority stated that hydroavailability had been stable (81%) or had become easier (11%).The vast majority of participants who said they had bought hydro in the last six months reportedbuying it from friends (43%) or known dealers (46%). The most commonly reported locationsof the last purchase were the dealer’s home (40 %), friend’s home (23%), or home delivery, i.e.,at the participant’s home (17%).7.3.2 BushOf those who commented on the current availability of bush (n=34), the majority stated that itwas ‘very easy’ (56%) or ‘easy’ (24%) to obtain (24% <strong>and</strong> 46% respectively in 2008). In terms ofrecent changes to availability, of those who commented (n=34), the majority stated that ‘bushavailability had been stable (68%) or had become easier (24%).The vast majority of participants who said they had bought bush in the preceding six monthsreported buying it from friends (36%), known dealers (18%), or acquaintances (12%). The most37
commonly reported locations of the last purchase were a friend’s home (30%), dealer’s home(18%), or home delivery, i.e., at the participant’s home (9%).Table 18: Participant reports of cannabis availability in the preceding six months, 2008-2009Current availability2008N=104Hydro2009N=802008N=104Bush2009N=80Did not respond * (%)30556158Did respond (%)70453942Of those who responded: n=73 n=36 n=41 n=34Very easy (%) 45 64 24 56Easy (%) 43 28 46 24Difficult (%) 10 6 22 15Very difficult (%) 1 3 7 6Don’t know^ (%) 1 0 0 0Changes in availabilityDid not respond * (%)30556158Did respond (%)70453942Of those who responded: n=73 n=36 n=41 n=34More difficult (%) 6 6 5 6Stable (%) 78 81 81 68Easier (%) 6 11 7 24Fluctuates (%) 8 3 7 3Don’t know^ (%) 3 0 0 0Source: QLD IDRS IDU interviews, 2008-2009^ ‘Don’t know’ refers to participants who responded to questions about price <strong>and</strong>/or purity, but not availability7.3.3 Cannabis detections at the Australian borderThe total weight (in kilograms) <strong>and</strong> number of cannabis detections at the border by the ACSfrom the financial years 1998/1999 to 2008/2009 is illustrated in Figure 20. These detectionsinclude cannabis, cannabis leaf, oil, seed, <strong>and</strong> resin. The total weight of detections decreasedfrom 53.44 kg in 2007/2008 to 8.6 kg in 2008/2009, whilst the total number of detectionsincreased from 654 to 1,044 in the same time period.38
Figure 20: Weight <strong>and</strong> number of cannabis detections made at the border by theAustralia Customs Service, financial years 1998/1999-2008/2009Weight in kilograms350030002500200015001000500056 23 712944227094 45 46 53 9120010008006004002000Number of detectionsWeightNumberSource: Australian Customs Service7.4 PotencyParticipant reports of current cannabis potency <strong>and</strong> changes in potency in the six monthspreceding interview are presented in Figures 21 <strong>and</strong> 22.7.4.1 HydroOf those who commented on the current purity/potency of hydro (n=36), the majority reportedit was ‘high’ (58%) or ‘medium’ (33%; 60% <strong>and</strong> 27% respectively in 2008). Of those whocommented on recent changes in hydro potency in 2009, the majority stated it was ‘stable’ (56%)or ‘increasing’ (22%).7.4.2 BushOf those who commented on the current purity/potency of bush (n=34), the majority reportedit was ‘high’ (41%) or ‘medium’ (35%; 27% <strong>and</strong> 42% respectively in 2008). Of those whocommented on recent changes in bush potency in 2009, the majority stated it was ‘stable’ (44%)or ‘increasing’ (38%).Figure 21: Participant reports of current cannabis potency, 2009% Participants806040200584133 35156 3 9High Medium Low FluctuatesSource: QLD IDRS IDU interviews, 2009HydroBush39
Figure 22: Participant reports of recent changes in cannabis potency, 2009% Participants60402005638 44228 9 8 6Increasing Stable Decreasing FluctuatingHydroBushSource: QLD IDRS IDU interviews, 20097.5 KE commentsThree KE commented on trends in the cannabis market. In terms of socio-demographiccharacteristics, all commented that of the cannabis users they had come into contact with, themajority were men in their late teens <strong>and</strong> 20s <strong>and</strong> that there appeared to be a high prevalence ofmental health problems such as depression, anxiety, <strong>and</strong> schizophrenia. One KE commentedthat there seemed to be an increase in the number of cannabis users under the age of 25accessing services in the preceding 12 months. None of the KE could comment the currentprice, purity, or availability of cannabis.7.6 Summary of cannabis trendsTable 19 presents a summary of trends in cannabis use, price, purity, <strong>and</strong> availability.Table 19: Summary of cannabis trends, QLD, 2008-2009Use • Proportion reporting recent use stable (69% in 2009)• Median number of days of use in preceding six months increased to150 in 2009 (72 in 2008)Price (median) Hydroponic cannabis• Gram: stable at $25, Ounce: stable at $300Cannabis (bush)• Gram: stable at $20, Ounce: $280 in 2009, up from $220 in 2008AvailabilityHydroponic cannabis• Majority reported hydro was ‘easy’ or ‘very easy’ to obtain• Majority reported recent hydro availability had been ‘stable’Cannabis (bush)• Majority reported bush was ‘easy’ or ‘very easy’ to obtain• Majority reported recent bush availability had been ‘stable’PotencyHydroponic cannabis• Majority reported hydro was ‘high’ or ‘medium’ potency• Majority reported recent hydro potency had been ‘stable’ or‘increasing’Cannabis (bush)• Majority reported bush was ‘high’ or ‘medium’ potency• Majority reported recent bush potency had been ‘stable’ or ‘increasing’40
8 OTHER OPIOIDSThe IDRS investigates the use patterns, harms <strong>and</strong> market characteristics of a number ofpharmaceutical opioids, including methadone, buprenorphine, buprenorphine-naloxone,morphine <strong>and</strong> oxycodone. Use of these substances is broadly split into the following categories.Use1. Use of licitly obtained opioids, i.e., use of opioids obtained by a prescription in the user’sname, through any route of administration.2. Use of illicitly obtained opioids, i.e., those obtained from a prescription in someone else’sname, through any route of administration (‘illicit use’).3. Use of any opioids, i.e., does not distinguish between licit <strong>and</strong> illicit methods of obtainment.Injection4. Injection of licitly obtained opioids.5. Injection of illicitly obtained opioids.6. Injection of any opioids.Note on interpretation: The IDRS <strong>and</strong> the term ‘diversion’Varied views on what constitutes diversion currently exist in the field. It is important toacknowledge the numerous <strong>and</strong> varied motivations behind the extra-medical use of opioidpharmacotherapies. While it is beyond the scope of the present study to examine this issue indetail, some examples of the range <strong>and</strong> breadth of these motivations include (but by no meansare restricted to): substitution for other drugs (e.g., heroin) when availability is low; euphoria (toachieve a pleasant opiate effect); the perception that pharmaceutical opioids are safer or a morereliable alternative to illicit substances, which may vary in content <strong>and</strong> purity; the desire to selfdetoxor self-medicate when treatment is undesirable or unavailable (e.g., where shame, fear ofstigma <strong>and</strong> discrimination associated with being identified as a ‘drug user’ prevent an individualseeking formal treatment); where Opioid Substitution Treatment (OST) is unavailable or has along waiting list; <strong>and</strong> where practical issues such as transport, dosing times <strong>and</strong> other issues (suchas physical <strong>and</strong>/or mental illness, employment, holidays <strong>and</strong> childcare) place constraints on theindividual.Similarly, persons engaged in OST may engage in extra-medical use of their medication for many<strong>and</strong> varied reasons, including (but not limited to): being ‘stood over’ or threatened (diversion toothers); for monetary gain or bartering (diversion to others); stockpiling for unexpectedcircumstances such as being unable to attend a clinic; where doses intended for singleconsumption are split across the day to ensure the level of pain relief remains constant; <strong>and</strong>‘topping up’ when the prescribed dose is not high enough (e.g., in the first few weeks followingcommencement of OST).The use of pharmaceutical opioids in ways other than as prescribed is currently an area ofconsiderable debate <strong>and</strong> readers are encouraged to acquaint themselves with the literature beforedrawing conclusions or making policy decisions with regard to the prescription ofpharmaceutical opioids. For example, other research has investigated the issues surroundingtake-away policies <strong>and</strong> methadone diversion (e.g., Ritter & Di Natale, 2005; Fraser, Valentine,Treloar & Macmillan, 2007). More detailed investigations into the barriers <strong>and</strong> incentives toentering drug treatment have also been conducted (e.g., Treloar et al., 2004; Digiusto & Treloar,2007; Reid, Crofts & Beyer, 2001). More recently, the argument has been made for a distinctionbetween ‘non-adherence’ (the use of one’s own medication in a way other than as directed, e.g.,41
through injection) <strong>and</strong> ‘diversion’ (the selling, trading, giving or sharing of one’s medication toanother person, including through voluntary, involuntary <strong>and</strong> accidental means).8.1 Methadone8.1.1 Trends in methadone useMethadone is prescribed for the treatment of opioid dependence, usually as a syrup preparation<strong>and</strong> is often dosed under supervised conditions. Take-away doses are available for some patientsdepending on various state/territory regulations. Physeptone tablets (the pill form of methadone)are less common in Australia <strong>and</strong> are usually prescribed for people in methadone treatment whoare travelling, or in a minority of cases where the methadone syrup is not tolerated. Asmentioned previously, illicit use of methadone <strong>and</strong> physeptone was defined as the use ofmedication not obtained with a prescription in the participant’s name. The participant may havebought the medication on the street or obtained it from a friend or acquaintance.Licit methadone <strong>and</strong> physeptoneThe proportion of participants indicating that they had ever used licit methadone (licit being theuse of one’s prescribed methadone) was stable at 47% in 2009 (48% in 2008). Twelve percent(n=9) of participants in 2009 reported use of licit methadone in the six months precedinginterview (22% in 2008). In 2009, 12% of participants reported having swallowed licitmethadone in the previous six months (22% in 2008). In addition, 6% of participants reportedhaving used licit methadone by injection in the six months prior to interview (13% in 2008).Among those who reported recent use of licit methadone, 56% reported daily use in thepreceding six months.Nine percent of participants reported ever using licit physeptone. No participant reported use oflicit physeptone in the preceding six months.Illicit methadone <strong>and</strong> physeptoneIn 2009, the proportion of participants reporting use of illicit methadone at some point in theirlife was 36% (51% in 2008). There was a significant decrease in the proportion of participantsreporting illicit methadone use in the six months preceding interview between 2008 <strong>and</strong> 2009,from 24% (n=25) to 10% (n=8; 14%; 95% CI of difference; +3, +24) (see Figure 23). Sixpercent of the sample reported injecting illicit methadone in the preceding six months (19% in2008) <strong>and</strong> 5% reported swallowing it (11% in 2008). Among participants reporting recent useof illicit methadone, the median number of days of use was one (range=1-24).In 2009, 19% reported ever using illicit physeptone; however, only 4% of participants reportedrecent use of illicit physeptone. Four percent reported recent injection of illicit physeptone (9%in 2008, <strong>and</strong> median days of use in the preceding six months was two.42
Figure 23: Use <strong>and</strong> injection of illicit methadone <strong>and</strong> Physeptone ® among participants inthe preceding six months, 2003-2009% Participants3025201510502003 2004 2005 2006 2007 2008 2009Used methadoneUsed Physeptone®Injected methadoneInjected Physeptone®Source: QLD IDRS IDU interviews, 2003-20098.1.2 Price <strong>and</strong> availabilityIn 2009, only two participants were able to report on the current price of illicit methadone. Forthis reason, the price data will not be reported here. Ten participants commented on the currentavailability of illicit methadone <strong>and</strong> changes to illicit methadone availability in the preceding sixmonths. Due to the small number of responses, caution should be exercised when interpretingthe results. Twenty percent reported it was ‘very easy’ to obtain, 40% said ‘easy’, 20% said‘difficult’, <strong>and</strong> 20% said ‘very difficult’. Twenty percent said availability was ‘more difficult’ inthe previous six months <strong>and</strong> 80% said it was ‘stable’. Of those who commented (n=10), 50% ofparticipants reported that the last time they bought illicit methadone, they obtained it from afriend.8.1.3 Motivations for diverted useEight participants commented on their reasons for using illicit methadone (multiple responseswere allowed). Five reported self-treatment, two said that it was a substitute for heroin/otheropiates, one said that they were away from home, <strong>and</strong> one said it was to become intoxicated.8.2 Buprenorphine8.2.1 Trends in buprenorphine useLicit buprenorphineIn 2009, 43% of participants reported that they had used licit buprenorphine (i.e., buprenorphineprescribed to them) at some point in their life (34% in 2008). Use of prescribed buprenorphinein the six months preceding interview remained stable between 2008 <strong>and</strong> 2009 (14%, n=15 <strong>and</strong>10%, n=8 respectively). In terms of recent routes of administration, 9% of the sample reportedswallowing buprenorphine <strong>and</strong> 3% reported injecting it in the preceding six months. Amongstthose who had used licit buprenorphine in the preceding six months, the median number of daysof use increased from 55 days in 2008 to 135 days in 2009.43
Illicit buprenorphineIn 2009, 55% of participants reported use of illicit buprenorphine (buprenorphine that isprescribed to someone else) at some point in their life (41% in 2008). Thirty-one percent (n=25)reported use of illicit buprenorphine in the six months prior to interview (25% in 2008, n=26)(see Figure 24). In terms of recent routes of administration, 11% of the sample reportedswallowing buprenorphine <strong>and</strong> 24% reported injecting it in the preceding six months. Mediannumber of days of use for illicit buprenorphine in 2009 (amongst those reporting recent use) was10 (nine in 2008).Figure 24: Use <strong>and</strong> injection of illicit buprenorphine among participants in the precedingsix months, 2004-2009% Participant3530252015105030 313125282519 20212416 172004 2005 2006 2007 2008 2009Used buprenorphineInjected buprenorphineSource: QLD IDRS IDU interviews, 2004-20098.2.2 Price <strong>and</strong> availabilityThe median reported price for a 2 mg tablet of buprenorphine was $15 (n=7) <strong>and</strong> $40 for an8 mg tablet (n=12). The majority of participants who responded (n=26) reported thatbuprenorphine was ‘easy’ (31%), ‘very easy’ (27%), or ‘difficult’ (27%) to obtain. Fifty percentreported that availability had remained ‘stable’ in the preceding six months, whilst 31% ofparticipants reported that availability had been ‘more difficult’.8.2.3 Motivations for diverted useNineteen participants commented on their reasons for using illicit buprenorphine (multipleresponses were allowed). Three reported self-treatment, two said that it was a substitute forheroin/other opiates, eight said that they were away from home, <strong>and</strong> five reported other reasons(including habit, feeling depressed, <strong>and</strong> to try it out).8.3 Buprenorphine-naloxone8.3.1 Trends in buprenorphine-naloxone useLicit buprenorphine-naloxoneIn 2009, 35% of participants reported that they had used licit buprenorphine-naloxone (i.e.,buprenorphine-naloxone prescribed to them) at some point in their life (23% in 2008). Twentythreepercent (n=18) reported use of prescribed buprenorphine-naloxone in the six monthspreceding interview (16% in 2008). In terms of recent routes of administration, 20% of the44
sample reported swallowing buprenorphine-naloxone <strong>and</strong> 6% reported injecting it in thepreceding six months. Amongst those who had used licit buprenorphine-naloxone in thepreceding six months, the median number of days of use decreased to 66 days in 2009 from 90days in 2008.Illicit buprenorphine-naloxoneIn 2009, 34% of participants reported use of illicit buprenorphine-naloxone (buprenorphinenaloxonethat is prescribed to someone else) at some point in their life (21% in 2008). Twentytwopercent (n=18) of the sample reported used of illicit buprenorphine-naloxone in the sixmonths prior to interview (16% in 2008) (see Figure 25). In terms of recent routes ofadministration, 14% reported swallowing buprenorphine-naloxone <strong>and</strong> 15% reported injecting itin the preceding six months. The median number of days of use for illicit buprenorphinenaloxonein 2009 (amongst those reporting recent use) was eight (five in 2008).Figure 25: Use <strong>and</strong> injection of illicit buprenorphine-naloxone among participants in thepreceding six months, 2006-2009% Participants3025201510502421221614 15752006 2007 2008 2009Used buprenorphine-naloxoneInjected buprenorphine-naloxoneSource: QLD IDRS IDU interviews, 2006-20098.3.2 Price <strong>and</strong> availabilityThe median reported price for a 2 mg tablet of buprenorphine-naloxone was $10 (n=5) <strong>and</strong> $28for an 8 mg tablet (n=12). The majority of participants who commented (n=19) reportedbuprenorphine-naloxone was ‘very easy’ (63%), or ‘easy’ (21%) to obtain. Fifty-eight percentreported that availability had remained ‘stable’ in the preceding six months, whilst 16% ofparticipants reported that availability had been ‘easier’.8.3.3 Motivations for diverted useSixteen participants commented on their reasons for using illicit buprenorphine-naloxone(multiple responses were allowed). Four reported self-treatment, one said that it was a substitutefor heroin/other opiates, seven said that they were away from home, <strong>and</strong> two reported otherreasons (including habit, <strong>and</strong> ‘just to get stoned’).8.4 MorphineIn 2009, it was decided at a national level that only data regarding use of illicit morphine would bepresented in the IDRS reports.45
8.4.1 Trends in illicit morphine useSixty percent of participants (n=48) in 2009 reported the use of illicit morphine at some pointduring their life, a significant decrease from 78% (n=81) in 2008 (18%; 95% CI of difference;+5, + 31). However, reports of illicit morphine use in the six months preceding interviewremained stable between 2008 <strong>and</strong> 2009 (51% <strong>and</strong> 38% respectively) (see Figure 26). Thirtyeightpercent also reported injecting illicit morphine recently (50% in 2008), whilst 6% said theyhad swallowed it in the preceding six months. The median number of days of use (amongstthose reporting recent use) was 18, up slightly from 12 in 2008.Figure 26: Use <strong>and</strong> injection of illicit morphine among participants in the preceding sixmonths 2003-2009% Participants60504030201002003 2004 2005 2006 2007 2008 2009Used illcit morphineInjected illicit morphineSource: QLD IDRS IDU interviews 2003-20098.4.2 Price <strong>and</strong> availabilityParticipants were asked to comment on the current price of different br<strong>and</strong>s of morphinetablets. The median reported price for 30 mg of MS Contin ® was $20 (n=3), 60 mg was $30(n=12), <strong>and</strong> 100 mg was $60 (n=20). The median reported price for 100 mg of Kapanol ® was$50 (n=14). Of the 36 participants who commented, 36% said that morphine was currently ‘veryeasy’ to access, 31% said it was ‘easy’, <strong>and</strong> 22% said it was ‘difficult’. The majority said accesshad either remained ‘stable’ in the preceding six months (47%), become ‘more difficult’ (22%),or had ‘fluctuated’ (17%).8.4.3 Motivations for diverted useThirty participants commented on their reasons for using illicit morphine (multiple responseswere allowed). Thirteen reported self-treatment, 14 said that it was a substitute for heroin/otheropiates, three reported it was for intoxication, <strong>and</strong> seven reported other reasons (includingaddiction, availability, <strong>and</strong> habit).8.5 OxycodoneIn 2009, it was decided at a national level that only data regarding use of illicit oxycodone wouldbe presented in the IDRS reports.46
8.4.1 Trends in illicit oxycodone useFifty-one percent of participants in 2009 reported the use of illicit oxycodone at some pointduring their life (46% in 2008). Thirty-four percent (n=27) reported the use of illicit morphinein the six months preceding interview (26% in 2008) (see Figure 27) <strong>and</strong> 34% also reportedinjecting illicit morphine recently (24% in 2008), whilst 4% said they had swallowed it in thepreceding six months. The median number of days of use in the preceding six months (amongstthose reporting recent use) was 14, up from seven in 2008.Figure 27: Use <strong>and</strong> injection of illicit oxycodone among participants in the preceding sixmonths, 2005-2009% Participants403530252015105039 3834 3426 24211618142005 2006 2007 2008 2009Used oxycodoneInjected oxycodoneSource: QLD IDRS IDU interviews, 2005-20098.4.2 Price <strong>and</strong> availabilityParticipants were asked to comment on the current price of different br<strong>and</strong>s of oxycodonetablets. The median reported price for 20 mg of Oxycontin ® was $10 (n=5), 40 mg was $20(n=11), <strong>and</strong> 80 mg was $40 (n=16). In 2009, only two participants were able to report on thecurrent price of Endone ® . For this reason, the price data on Endone ® will not be reported here.Of the 26 participants who commented, 42% said that oxycodone was currently ‘difficult’ toaccess <strong>and</strong> 15% said it was ‘very difficult’. Twenty-three percent, however, said it was ‘easy’ toaccess <strong>and</strong> 19% said it was ‘very easy’. The majority said in that in the past six months, accesshad remained stable (54%), or had become more difficult (23%).8.4.3 Motivations for diverted useTwenty-two participants commented on their reasons for using illicit oxycodone (multipleresponses were allowed). Eight reported self-treatment, five said that it was a substitute forheroin/other opiates, 11 said that they were away from home, <strong>and</strong> four reported other reasons(including price <strong>and</strong> availability).8.5 Other opioidsNineteen percent of participants reported that they had ever used opioids other than those listedabove (33% in 2008) <strong>and</strong> 10% reported injecting them at some point in their life. Thirteenpercent (n=9) reported use of other opioids in the six months prior to interview (8% in 2008)<strong>and</strong> the median number of days used among these participants was 10.47
8.6 KE commentsThree KE commented on trends in the illicit pharmaceutical opioids market. Two KE spokespecifically about morphine <strong>and</strong> both commented that problems with injecting, such asvein/tissue damage <strong>and</strong> abscesses, were common amongst the morphine users they had comeinto contact with. It was noted that these problems can be often reduced with the use of pillfilters. One KE spoke about pharmaceutical opioids in general, <strong>and</strong> commented that there hadbeen a large increase in the level of prescription of these drugs over the past 10 years. They alsocommented that these drugs may be more appealing to some IDU because they are oftencheaper <strong>and</strong> perceived as safer in comparison to heroin since the purity is more consistent.8.6 Summary of other opioids trendsTable 20 presents the summary of trends in the use of other opioids.Table 20: Summary of trends for other opioids, QLD, 2008-2009Methadone • Proportion reporting recent use of licit methadone stable (12% in 2009)• 56% of recent licit methadone users reported daily use in the precedingsix months• Proportion reporting recent use of illicit methadone decreasedsignificantly from 24% in 2008 to 10% in 2009Buprenorphine • Proportion reporting recent use of licit buprenorphine remained stable(14% in 2009)• Median days of use of licit buprenorphine in the preceding six monthsincreased to 135 days in 2009 from 55 days in 2008• Proportion reporting recent use of illicit buprenorphine remained stable(31%)Buprenorphinenaloxone• Proportion reporting recent use of licit buprenorphine-naloxoneremained stable (23% in 2009)• Median days of use of licit buprenorphine-naloxone in the preceding sixmonths decreased to 66 days in 2009 from 90 days in 2008• Proportion reporting recent use of illicit buprenorphine-naloxoneremained stable (22%)Morphine • Proportion reporting recent use of illicit morphine remained stable(51% in 2009)• Median days of use in the preceding six months was 18Oxycodone • Proportion reporting recent use of illicit oxycodone remained stable(34% in 2009)• Median days of use in the preceding six months was 14, up from sevenin 200848
9 OTHER DRUGS9.1 EcstasyIn 2009, 25% of participants reported the recent use of ecstasy, as can be seen in Table 21.Fourteen percent of participants reported having injected ecstasy in the previous six months.Amongst those who reported ecstasy use in the preceding six months, the median number ofdays of use was two.Table 21: Patterns of ecstasy use among participants in the preceding six months inQLD, 2005-20092005N=1062006N=1122007N=1192008N=1042009N=80Recent use (%) 25 28 22 17 25Recent injection (%) 5 11 12 15 14Source: QLD IDRS IDU interviews, 2005-20099.2 BenzodiazepinesThe proportion of the sample reporting use of benzodiazepines at some point in their lifetimewas 80% in 2009 (73% in 2008). Fifty-nine percent of the sample reported use ofbenzodiazepines in the preceding six months (61% percent in 2008) <strong>and</strong> 4% reported recentinjection of benzodiazepines (5% in 2008) (see Figure 22). The median number of days usedamongst recent users was 65 (70 days in 2008).For the first time in 2008, benzodiazepines were divided into the categories licit <strong>and</strong> illicit. In2009, 45% of participants reported recent use of licit benzodiazepines (42% in 2008), <strong>and</strong> 33%reported recent use of illicit benzodiazepines (39% in 2008). The overall proportion ofparticipants reporting recent injection of both forms was low at 4% for licit <strong>and</strong> 1% for illicit(4% <strong>and</strong> 2% respectively in 2008). The most common route of administration for both formswas swallowing at 45% of the overall sample for licit <strong>and</strong> 34% for illicit (42% <strong>and</strong> 39%respectively in 2008). Median number of days of use amongst those who reported recent use oflicit benzodiazepines was 72 (down from 110 days in 2008), <strong>and</strong> seven (10 days in 2008) amongstthose who reported recent use of illicit benzodiazepines. Amongst those reporting recent use ofeither form (n=47), the most common form used was licit benzodiazepines (76%). The majorityof recent benzodiazepine users reported that the main br<strong>and</strong> used was Valium ® (58%), Xanax ®(16%), or Antenex ® (14%).Table 22: Patterns of benzodiazepine (licit/illicit) use among participants in thepreceding six months in QLD, 2005-20092005N=1062006N=1122007N=1192008N=1042009N=80Recent use (%) 51 69 50 61 59Recent injection (%) 7 10 3 5 4Source: QLD IDRS IDU interviews, 2005-200949
9.3 Pharmaceutical stimulantsSince 2004, participants have been asked to comment about their use of pharmaceuticalstimulants. This includes drugs such as dexamphetamine <strong>and</strong> methylphenidate, which aremedications most commonly prescribed for Attention Deficit Hyperactivity Disorder (ADHD).From 2006, the IDRS distinguished between licit <strong>and</strong> illicit forms of pharmaceutical stimulants.The proportion of the sample reporting use of either form pharmaceutical stimulants at somepoint in their lifetime was 30% in 2009 (23% in 2008). In terms of use in the six monthspreceding interview, 1% of the sample reported using licit pharmaceutical stimulants (0% in2008) <strong>and</strong> 4% reported using illicit pharmaceutical stimulants (as in 2008). The proportion ofparticipants reporting recent use <strong>and</strong> recent injection of some form of pharmaceutical stimulantsis presented in Table 23.Table 23: Patterns of pharmaceutical stimulant (licit/illicit) use among participants inthe preceding six months in QLD, 2005-20092005N=1062006N=1122007N=1192008N=1042009N=80Recent use (%) 12 9 11 4 5Recent injection (%) 2 6 3 1 3Source: QLD IDRS IDU interviews, 2005-20099.4 HallucinogensIn 2009, 60% of participants reported using hallucinogens at some point in their lifetime (72% in2008) <strong>and</strong> 13% reported using hallucinogens in the six months prior to interview (7% in 2008)(see Figure 28). All of those reporting recent use (n=10) also reported that swallowing was theroute of administration. Fifteen percent of the sample reported having injected hallucinogens atsome point during their life but none reported recent injection. Among those reporting recentuse, the majority of participants said the form most frequently used was LSD (70%) ormushrooms (20%).Figure 28: Prevalence <strong>and</strong> frequency of hallucinogen use in the preceding six months,2001-2009% Participants3025201510502001 2002 2003 2004 2005 2006 2007 2008 20096543210Median days / 180Recent useMedian daysSource: QLD IDRS IDU interviews, 2001-200950
9.5 InhalantsThe percentages of participants reporting use of inhalants at some point during their life <strong>and</strong>those reporting use in the preceding six months are presented in Figure 29. The majority ofparticipants reporting recent use (n=7) stated that the main form used was glue (43%) or nitrousoxide (14%).Figure 29: Prevalence of inhalant use by participants, 2001-2009% Participants403530252015105034333526 22262420208157 6 133 3912001 2002 2003 2004 2005 2006 2007 2008 2009LifetimeRecentSource: QLD IDRS IDU interviews, 2001-20099.6 <strong>Alcohol</strong> <strong>and</strong> tobaccoThe majority of participants (95%) reported having used alcohol at least once during their life(88% in 2008). Sixty-eight percent of the sample reported using alcohol in the six monthspreceding interview (62% percent in 2008). Four percent reported having injected alcohol atsome point in their lifetime (9% in 2008), although no participant reported having injectedalcohol recently (as in 2008). The median number of days used amongst those reporting use inthe preceding six months was 20 (as in 2008).The majority of participants (98%) also reported having used tobacco at least once during theirlife (95% in 2008). Ninety-five percent of the sample reported using tobacco in the six monthspreceding interview (90% in 2008). The median number of days used amongst those reportingrecent use of tobacco was 180 (as in 2008) (see Table 24).Table 24: Patterns of tobacco use among participants in the preceding six months inQLD, 2005-20092005N=1062006N=1122007N=1192008N=1042009N=80Recent use (%) 88 96 94 90 95Median days used * 180 180 180 180 180Source: QLD IDRS IDU interviews, 2005-2009* Among those reporting recent use; maximum=180 days.9.7 KE commentsThree KE commented on the use of illicit benzodiazepines. The majority commented on anapparent association between the use of benzodiazepines such as Xanax ® <strong>and</strong> problembehaviours such as aggression <strong>and</strong> criminal activity. One KE commented that the prescription51
of benzodiazepines has decreased in the last few years, with the exception of Xanax ® . Theremaining KE both commented that they suspected there had been an increase in the number ofIDU using Xanax ® in the preceding 12 months <strong>and</strong> one suggested that there needs to be anational tightening on the prescription of Xanax ® so that it is less readily available. Interestingly,there was no significant increase in the percentage of participants reporting recent use of licit orillicit benzodiazepines between 2008 <strong>and</strong> 2009. Regardless of this discrepancy, it seems that theuse of benzodiazepines amongst IDU could be an emerging issue <strong>and</strong> one worth monitoring inyears to come.9.8 Summary of other drug trendsTable 25 summarises the trends for other drug use including ecstasy, benzodiazepines,pharmaceutical stimulants, hallucinogens, inhalants, alcohol, <strong>and</strong> tobacco.Table 25: Summary of trends in other drug use, QLD, 2009Ecstasy • 25% of sample reported recent use of ecstasy• Median number of days of use in the preceding six months was twoBenzodiazepines • 45% of sample reported recent use of licit benzodiazepines <strong>and</strong> 33%reported recent used of illicit benzodiazepines• Swallowing was the most commonly reported recent route ofadministration• Most commonly used br<strong>and</strong> was Valium ®Pharmaceuticalstimulants• 1% of sample reported recent use of licit pharmaceutical stimulants <strong>and</strong>4% reported recent use of illicit pharmaceutical stimulantsHallucinogens • 13% of sample reported recent use of hallucinogens• The most frequently used form was mushroomsInhalants • 9% of the sample reported recent use of inhalants• The most frequently used form was glue<strong>Alcohol</strong> <strong>and</strong>tobacco• 68% of sample reported recent use of alcohol• Median number of days of use of alcohol in the preceding six monthswas 20• 95% of sample reported recent use of tobacco• Median number of days of use of tobacco in the preceding six monthswas 18052
10 HEALTH-RELATED TRENDS ASSOCIATED WITH DRUG USE10.1 Overdose10.1.1 HeroinIn 2009, 53% of participants reported having overdosed on heroin at least once at some point intheir life (50% in 2008). Ninety-one percent of participants who reported ever having overdosedon heroin reported having overdosed one to five times, 6% reported having overdosed betweensix <strong>and</strong> 15 times <strong>and</strong> 3% reported having overdosed 20 times. The median time to last heroinoverdose was 65 months (range=2-300 months; 72 months in 2008, <strong>and</strong> range=2-360 months).Of those who reported ever having overdosed on heroin (n=28), 21% reported havingoverdosed in the year prior to the interview. No participant reported overdosing on heroin inthe preceding month.Participants in the 2009 survey who reported overdosing in the last 12 months (n=5) were alsoasked what treatment <strong>and</strong> information they received. Given the small number of participantsresponding to these questions, caution should be exercised when interpreting the results. Twoof these participants reported that they received no treatment or information the last time theyoverdosed on heroin. Two participants reported ambulance attendance; one reported theyattended a hospital emergency department; <strong>and</strong> one participant reported that Narcan ® wasadministered.10.1.2 Other drugsIn 2009, only two participants reported overdosing on a drug other than heroin in the preceding12 months. Of these, one reported overdosing on benzodiazepines, one reported overdosing oncannabis, <strong>and</strong> both reported overdosing on alcohol.10.1.3 Queensl<strong>and</strong> Ambulance Service dataFigure 30 presents the number of overdoses attended by the Queensl<strong>and</strong> Ambulance Service(QAS) where a drug was specified as the primary problem, during the 2008/2009 financial year 1 .During 2008/2009, of the 7,908 overdoses attended by QAS, those involving licit drugs weremost common (e.g., alcohol: 43%; antidepressants: 9%; benzodiazepines: 6%). Overdoses whereillicit drugs were specified were less common (e.g.. ecstasy: 3%; heroin: 2%, cannabis: 2%,amphetamines: 2%).1 During 2006, QAS modified its data collection methods with the introduction of the Electronic Ambulance Report Form(eARF), allowing collection of information on specific drug types. Prior to 2006, overdose information was only available in thefollowing categories: recreational drug poisoning/overdose <strong>and</strong> prescription drug poisoning/overdose. Note that these data areconservative for several reasons, <strong>and</strong> cannot be considered a definitive record of the number of overdoses attended by QASduring the specified time period. QAS data do not include formal diagnoses, as these are not made until the patient has receivedtreatment at the Emergency Department. QAS data <strong>and</strong> Queensl<strong>and</strong> Health data are not routinely linked. It is possible that QASattended overdoses that were not assigned an overdose code, <strong>and</strong> are thus not included in the data shown.It should be noted that the ‘drug type’ field is optional – it is not always possible for paramedics to establish the drug typeinvolved. Instances of polydrug overdose are likely to be under-represented in these data, as this information is not alwaysknown at the scene of the overdose. Finally, these data relate only to cases where the primary case nature was coded as overdose.Any overdose cases where the overdose was coded as secondary to the primary problem are not included (e.g., cardiac arrest dueto drug overdose, trauma, <strong>and</strong>/or psychiatric cases).53
Figure 30: Number of overdoses attended by QAS where a drug was specified as theprimary problem, 2008/200935003000250020001500100050003414724445 222 189 169 129 63 28 23 5Source: Queensl<strong>and</strong> Ambulance Service10.2 Calls to telephone help linesThe following data was obtained from the Queensl<strong>and</strong> <strong>Alcohol</strong> <strong>and</strong> <strong>Drug</strong> Information Service(ADIS). It represents the number of calls about each drug from people who had a drug history<strong>and</strong> were willing to provide information about it.10.2.1 OpioidsThe number of calls made to ADIS regarding licit <strong>and</strong> illicit opioids from 2001/2002 to2008/2009 is shown in Figure 31. The majority of calls to ADIS in relation to illicit opioidsinvolved heroin. The licit opioid category includes calls about drug categories such aspharmacotherapies for heroin dependence (methadone, buprenorphine <strong>and</strong> buprenorphinenaloxone),<strong>and</strong> pharmaceutical opioid preparations such as morphine <strong>and</strong> oxycodone, whetherlicit or illicitly obtained for use. Six percent of all calls to ADIS in 2008/2009 were about illicitopioids (5% in 2007/2008) <strong>and</strong> 11% were about licit opioids (9% in 2007/2008).Figure 31: Number of enquiries to ADIS regarding licit <strong>and</strong> illicit opioids, 2001/2002-2008/2009Number of calls15001000500013891229940 940 10021130 118110351160 1176958 923 892731 771 7662001/02 2002/03 2003/04 2004/05 2005/06 2006/07 2007/08 2008/09Licit opioidsIllicit opioidsSource: Queensl<strong>and</strong> <strong>Alcohol</strong> <strong>and</strong> <strong>Drug</strong> Information Service10.2.2 MethamphetamineFigure 32 shows the number of telephone enquiries made to ADIS in relation to amphetaminesfrom 2001/2002 to 2008/2009. During 2006/2007, the number of enquiries pertaining toamphetamines reached a peak of 3,470 calls <strong>and</strong> then decreased to 1,703 during 2007/2008.Twelve percent of all calls to ADIS in 2008/2009 were about amphetamines (13% in2007/2008).54
Figure 32: Number of enquiries to ADIS regarding amphetamines, includingmethamphetamine, 2001/2002-2008/2009Number of calls4,0003,0002,0001,00003,4703,0932,418 2,270 2,487 2,5591,7031,4222001/02 2002/03 2003/04 2004/05 2005/06 2006/07 2007/08 2008/09Source: Queensl<strong>and</strong> <strong>Alcohol</strong> <strong>and</strong> <strong>Drug</strong> Information Service10.2.3 CocaineFigure 33 shows the number of cocaine-related enquiries made to ADIS from 2001/2002 to2008/2009. One percent of all calls to ADIS were in 2008/2009 were about cocaine (
any drug treatment <strong>and</strong> 58% of participants (n=46) reported that they had not been in any formof treatment in the preceding six months. Sixteen percent of those reporting current drugtreatment (n=13) reported that their main treatment was Suboxone ® (buprenorphine-naloxone)whilst 8% (n=6) named Subutex ® (buprenorphine); 9% (n=7) said they were being treatedprimarily with methadone/biodone syrup; <strong>and</strong> 5% (n=4) named drug counselling. Among thosecurrently in drug treatment, the median number of months engaged in treatment was six (with arange of one week to 10 years). The proportion of participants reporting treatments other thanpharmacotherapy in the preceding six months is shown in Figure 35.Figure 35: Proportion of participants reporting treatments other than pharmacotherapyin past six months, 2001-2009% Participants10864202001 2002 2003 2004 2005 2006 2007 2008 2009<strong>Drug</strong> CounsellingDetoxificationTherapeutic community or rehab Narcotics AnonymousNaltrexoneSource: QLD IDRS IDU interviews 2001-200910.3.2 Estimated number of pharmacotherapy clientsFigure 36 illustrates the estimated number of pharmacotherapy clients for all pharmacotherapytypes in Queensl<strong>and</strong>, from 1989 to 2008. In 2008 there were 4,899 clients were registered foropioid pharmacotherapy. Of these, 56% were receiving methadone syrup or Biodone Forte ® ,<strong>and</strong> 44% were receiving buprenorphine (Subutex ® ) or buprenorphine-naloxone (Suboxone ® ),which were similar to reported proportions in 2007 (61% <strong>and</strong> 39%, respectively).During 2008, 66% of Queensl<strong>and</strong> clients were registered with public prescribers, compared to27% nationally <strong>and</strong> 33% were registered with private prescribers, compared to 65% nationally.Less than 1% of registrations were in correctional facilities, compared to 7% nationally. The lowrate of opioid pharmacotherapy in Queensl<strong>and</strong> correctional settings remains a considerableconcern considering a significant proportion of both male <strong>and</strong> female prisoners have a history ofillicit drug use (Butler & Milner, 2003; Johnson, 2004; Makkai & Payne, 2003).In Queensl<strong>and</strong>, the number of registered prescribers was 111 in 2008 (99 in 2007). Mostprescribers in 2008 (96%) were authorised to prescribe multiple pharmacotherapy drugs, forinstance, methadone, buprenorphine <strong>and</strong> buprenorphine-naloxone. The estimated number ofpharmacotherapy clients in Queensl<strong>and</strong> in 2008 comprised approximately 12% of the totalnumber of all opioid pharmacotherapy registrations in Australia, with the bulk of clientsregistered in New South Wales (42%) <strong>and</strong> Victoria (29%).56
Figure 36: Estimated number of pharmacotherapy clients for all opioid pharmacotherapytypes in Queensl<strong>and</strong>, 1989-2008Number of clientregistrations6000500040003000200010000Public Private TotalSource: AIHW analysis of 2008 NOPSAD collection, 2009Note: Does not include clients that received a take-away dose on the ‘snapshot’ collection date10.4 Hospital admissions10.4.1 OpioidsFigure 37 shows the rate of hospital admissions per million persons aged 15 to 54 years, whereopioids were the primary diagnosis from 1994/1995 to 2007/2008 (both in Queensl<strong>and</strong> <strong>and</strong>nationally). In 1998/1999, the rate peaked in Queensl<strong>and</strong> at 708 per million persons beforedropping markedly over the following four years to a rate of 334 per million persons during2002/2003. In 2007/2008, the rate in Queensl<strong>and</strong> was 390 per million <strong>and</strong> nationally it was 440per million.Figure 37: Rate per million of inpatient hospital admissions where opioids were theprincipal diagnosis per million persons aged 15-54 years, Queensl<strong>and</strong> <strong>and</strong> nationally,1994/1995-2007/2008Rate per million10008006004002000QLD<strong>National</strong>Source: <strong>National</strong> Hospital Morbidity Database; Roxburgh & Burns (in press)10.4.2 MethamphetamineFigure 38 shows the rate of hospital admissions per million persons aged 15 to 54 years, whereamphetamines were the principal diagnosis, from 1994/1995 to 2007/2008 (both in Queensl<strong>and</strong><strong>and</strong> nationally). In 2001/2002, the rate peaked in Queensl<strong>and</strong> at 232 per million persons, beforedecreasing to a rate of 119 per million persons during 2007/2008.57
Figure 38: Rate of inpatient hospital admissions where amphetamines were the principaldiagnosis per million persons aged 15-54 years, Queensl<strong>and</strong> <strong>and</strong> nationally, 1994/1995-2007/2008Rate per million250200150100500QLD<strong>National</strong>Source: <strong>National</strong> Hospital Morbidity Database; Roxburgh & Burns (in press)10.4.3 CocaineFigure 39 illustrates the rate of hospital admissions per million persons aged 15 to 54 years,where cocaine was the principal diagnosis, from 1994/1995 to 2007/2008 (both in Queensl<strong>and</strong><strong>and</strong> nationally). Across Queensl<strong>and</strong> the rate has remained relatively low, peaking at seven permillion persons in 2003/2004. In 2007/2008, the rate in Queensl<strong>and</strong> was two per million <strong>and</strong>nationally it was 15 per million.Figure 39: Rate of inpatient hospital admissions where cocaine was the principaldiagnosis per million persons aged 15-54 years, Queensl<strong>and</strong> <strong>and</strong> nationally, 1994/1995-2007/2008Rate per million50403020100QLD<strong>National</strong>Source: <strong>National</strong> Hospital Morbidity Database; Roxburgh & Burns (in press)10.4.4 CannabisFigure 40 illustrates the rate of hospital admissions per million persons aged 15 to 54 years,where cannabis was the principal diagnosis, from 1994/1995 to 2007/2008 (both in Queensl<strong>and</strong><strong>and</strong> nationally). In Queensl<strong>and</strong>, the rate peaked in 2004/2005 at 89 per million persons. In2007/2008, the rate in Queensl<strong>and</strong> was 69 per million <strong>and</strong> nationally it was 134 per million.58
Figure 40: Rate of inpatient hospital admissions where cannabis was the principaldiagnosis per million people aged 15-54 years, Queensl<strong>and</strong> <strong>and</strong> nationally, 1994/1995-2007/2008Rate per million200150100500QLD<strong>National</strong>Source: <strong>National</strong> Hospital Morbidity Database; Roxburgh & Burns (in press)10.5 Injecting risk behaviours10.5.1 Sharing of injecting equipmentFigure 41 presents the proportion of participants that reported borrowing used needles, loaningused needles, <strong>and</strong> sharing other injecting equipment in the month preceding interview. Anoticeable change between 2008 <strong>and</strong> 2009 was the significant increase in the proportion ofparticipants who reported lending a used needle from 6% to 31% (19%; 95% CI of difference;-37, -25). The proportion of participants who reported borrowing a needle was 15% (7% in2008) <strong>and</strong> the proportion who reported sharing other injecting equipment was 36% (44% in2008). Seventy-three percent reported re-using their own needle in the preceding month, asignificant increase from 49% in 2008 (24%; 95% CI of difference; -36, -9). Of the people whoreported borrowing needles in the previous month (n=12), 67% reported borrowing a needlefrom a regular sex partner, 22% reported borrowing from a close friend, <strong>and</strong> 44% said theyborrowed from ‘other people’. No participant reported borrowing a needle from a casual sexpartner in the preceding month. The median number of times they had borrowed a needle in theprevious month was two (with a minimum of one time <strong>and</strong> a maximum of more than 10 times).Figure 41: Proportion of participants reporting sharing injecting equipment in the monthpreceding interview, 2001-2009% Participants60504030201002001 2002 2003 2004 2005 2006 2007 2008 2009Borrowed used needleShared other injecting equipmentLoaned used needleSource: QLD IDRS IDU interviews, 2001-2009Note: ‘Other injecting equipment’ includes spoons or mixing containers, filters, tourniquets, water, <strong>and</strong> swabs (2009 only)Of those who reported using other injection equipment after someone else in the precedingmonth (n=29), 72% said they had used spoons or other mixing containers after someone else,59% reported using filters, 24% reported using tourniquets, 48% reported using water, <strong>and</strong> 14%said they had used swabs after someone else.59
10.5.2 Access to sterile injecting equipment in the preceding six monthsThe vast majority of IDRS participants in 2009 (95%; 97% in 2008) reported accessing needlesfrom a NSP in the preceding six months. The next most popular place was a pharmacy (30%).Ten percent reported sourcing needles from a friend, <strong>and</strong> 9% from a dealer. Two peoplereported accessing needles at a hospital.Figure 42 illustrates the total number of needles <strong>and</strong> syringes distributed to NSP in Queensl<strong>and</strong>by the Queensl<strong>and</strong> Needle <strong>and</strong> Syringe Program (QNSP) from 1996/1997 to 2008/2009. In2008/2009, the number of syringes distributed to NSP across the state was 5,973,560 (5,569,405in 2007/2008).Figure 42: Total number of syringes dispensed in Queensl<strong>and</strong>, 1996/1997-2008/2009Number dispensed(millions)86420Source: Queensl<strong>and</strong> Needle <strong>and</strong> Syringe Program10.5.2 Blood-borne viral infectionsFigure 43 presents the total number of notifications for hepatitis B (HBV), incident <strong>and</strong>unspecified, <strong>and</strong> hepatitis C (HCV) in Queensl<strong>and</strong> from 1991 to 2009 2 . It should be noted thatjurisdictional data aggregates both incident <strong>and</strong> unspecified HCV notifications. In 2009, the totalnumber of for HBV incident <strong>and</strong> unspecified notifications were 47 <strong>and</strong> 1,021 respectively (45<strong>and</strong> 841 in 2008). The total number of HCV notifications (incident <strong>and</strong> unspecified combined)was 2,742 (2,630 in 2008).Figure 43: Total number of notifications for HBV (incident <strong>and</strong> unspecified) HCV(unspecified) * , Queensl<strong>and</strong> 1991-2009Number of notifications40003000200010000HBV incident HBV unspecified HCV unspecifiedSource: Communicable Diseases Network, Australia: <strong>National</strong> Notifiable Diseases Surveillance SystemNote: Includes all notifications received from State health authorities in the period of 1991 to 2008 <strong>and</strong> year to date notificationsfor 2009* HBV incident includes incident cases from Queensl<strong>and</strong> from 1993 to the present, <strong>and</strong> HCV unspecified includes incident casesfrom Queensl<strong>and</strong> from 1995 to present2 There are several caveats to the NNDSS data that need to be considered. As no personal identifiers are collected, duplication inreporting may occur if patients move from one jurisdiction to another <strong>and</strong> are notified in both. In addition, notified cases arelikely to represent only a proportion of the total number of cases that occur, <strong>and</strong> this proportion may vary between viruses, <strong>and</strong>jurisdictions, over time.60
10.5.3 Usual location for injection in the month preceding interviewFigure 44 shows the usual location for injection among IDRS participants in the monthpreceding interview. Consistent with previous years, the majority of participants nominated aprivate home (68%) although this was a significant decrease from 87% in 2008 (19%; 95% CI ofdifference; +7, +31). A car was the next most frequently reported place (19%; 9% in 2008) astheir usual location for injection in the month before interview.Figure 44: Usual location for injection in the month preceding interview, 2002-2009% Participants10090807060504030201002002 2003 2004 2005 2006 2007 2008 2009Home Street/park or beach Car Public toiletSource: QLD IDRS IDU interviews, 2002-200910.5.3 Self-reported injection-related health problemsTable 26 presents the self-reported injection-related problems among participants in the monthpreceding interview. A noticeable difference between 2008 <strong>and</strong> 2009 was the significant increasein the proportion of participants reporting scarring/bruising from 46% to 64% (18%; 95 CI ofdifference; -31, -3).Table 26: Injection-related problems among participants in the preceding month, byproblem type, 2002-20092002 2003 2004 2005 2006 2007 2008 2009Overdose (%) 6 7 3 3 4 4 3 1Dirty hit (%) 18 19 16 14 25 31 20 31Abscess/infection (%) 14 16 11 5 8 6 8 15Scarring/bruising (%) 51 37 48 37 55 57 46 64Difficulty injecting (%) 43 35 40 31 38 41 38 38Thrombosis (%) 11 7 8 7 9
Figure 45: Main drug attributed to a dirty hit in the preceding month, 2004-2009 *% Participants504030201002004 (n=18) 2005 (n=15) 2006 (n=28) 2007 (n= 35) 2008 (n=21) 2009 (n=24)Heroin Methamphetamine MethadoneMorphine Benzodiazepines BuprenorphineSource: QLD IDRS IDU interviews, 2004-2009* Among participants who reported experiencing a dirty hit in the month before interview10.6 Physical health problems10.6.1 Chronic conditionsFor the first time in 2009, participants were asked whether they had ever been diagnosed withone or more chronic conditions, the age at which they had first been diagnosed, <strong>and</strong> whetherthey had received treatment for their condition/conditions in the preceding 12 months. Theresults of these questions are shown in Table 27. The conditions that participants mostcommonly reported having been diagnosed with were back or neck pain (44%, n=35), liverdisease (43%, n=34), asthma (29%, n=23), vision problems (29%, n=23), migraine (26%, n=21),skin problems (23%, n=18), <strong>and</strong> bronchitis (20%, n=16).The conditions that participants most commonly reported as having received treatment for inthe previous 12 months were back or neck pain (n=14, 18% of the overall sample), asthma(n=11, 14% of the overall sample), <strong>and</strong> migraine (n=9, 11% of the overall sample).10.6.2 Dental healthFor the first time in 2009, participants were asked questions about their dental health. Whenasked to give the reason for their last visit to the dentist, 48% reported an extraction, 34%reported fillings, 16% said a check-up <strong>and</strong>, <strong>and</strong> 15% said for relief of pain (multiple responseswere allowed). Seventy-seven percent of participants reported that they did not pay for their lastvisit to the dentist. The median number of adult teeth that participants reported having lost wasfour (range=0-31). The median number of times participants had visited a dentist in thepreceding 12 months was one (range=0-12) <strong>and</strong> 69% reported that there had been an occasionduring this time when they had needed to visit a dentist but did not.62
Table 27: Proportion of participants diagnosed with chronic conditions, median age ofdiagnosis, <strong>and</strong> proportion of participants receiving treatment in preceding year, 2009Condition% Participantsever diagnosed(N=80)Median age(years) firstdiagnosed *^% Participantsreceivingtreatment in past12 months *Asthma 29 12 (1-37) 48 (n=11)Cancer 8 28 (17-59) 33 (n=2)Stroke 4 23 (18-39) 0Other heart/circulatory condition 14 23 (14-43) 60 (n=6)Gout, rheumatism, or arthritis 4 36 (35-36) 33 (n=1)Diabetes or high blood sugar levels 0 0 0Epilepsy 6 13 (3-30) 20 (n=1)Skin problems 23 18 (2-47) 33 (n=6)Vision problems 29 20 (8-50) 30 (n=7)Hearing problems 8 19 (1-40) 17 (n=1)Diabetes 1 17 (17) 0High blood pressure 9 25 (14-43) 86 (n=6)Liver disease 43 25 (16-48) 6 (n=2)Respiratory disease 6 20 (1-49) 40 (n=2)Joint/muscular/skeletal 16 27 (15-47) 42 (n=5)Human papilloma virus 6 24 (16-27) 20 (n=1)Septicaemia 6 25 (13-36) 20 (n=1)Cellulitis 8 29 (14-49) 50 (n=3)Hay fever 16 10 (2-15) 39 (n=5)Sinus or sinus allergy 13 15 (8-30) 30 (n = 3)Emphysema 5 40 (30-51) 50 (n = 2)Bronchitis 20 16 (1-31) 40 (n = 6)Anaemia 9 19 (7-34) 43 (n = 3)Fluid problems/fluid retention/oedema 3 31 (27-35) 0Hernias 5 27 (9-45) 0Kidney problems 5 25 (12-40) 25 (n = 1)Psoriasis 5 27 (6-30) 25 (n = 1)Stomach ulcer/other gastrointestinal ulcer 5 28 (12-32) 25 (n = 1)Thyroid trouble/goiter 3 15 (13-16) 0Tuberculosis 0 0 0Back/neck pain or back /neck problems 44 24 (6-47) 42 (n = 14)Migraine 26 19 (5-35) 45 (n = 9)Source: QLD IDRS IDU interviews, 2009* Of those diagnosed with that particular condition;^ Age range of first diagnosis presented in brackets63
10.7 Mental health problems, psychological distress, <strong>and</strong> personal wellbeing10.7.1 Mental health problems <strong>and</strong> psychological distressIn 2009, 41% of participants (n=33) reported having had a mental health problem other th<strong>and</strong>rug dependence in the six months preceding interview. The most commonly reportedproblems were depression, anxiety, <strong>and</strong> manic-depression (64%, 46%, <strong>and</strong> 18% respectively ofthe participants who reported having had a mental health problem in the preceding six months)(see Table 28). Fifty-eight percent of those who reported mental health problems said that theyhad attended a mental health professional in the previous six months (n=19) <strong>and</strong> of theseparticipants, 64% reported being prescribed anti-depressants, 70% reported benzodiazepines,<strong>and</strong> 58% reported anti-psychotics.Table 28: Summary of mental health problems experienced by IDU QLD, 20092009N=80Self-reported mental health problem last six months (%) 41(n=33)Self-reported mental health problems *Depression (%) 64Anxiety (%) 46Manic-depression (%) 18Panic (%) 6Paranoia (%) 12Schizophrenia (%) 9<strong>Drug</strong>-induced psychosis 12Attended mental health professional (%) *No medication (%) **Prescribed anti-depressant (%) **Prescribed anti-psychotic (%) **Prescribed benzodiazepine (%) **Source: QLD IDRS IDU interviews, 2009* Of those who reported a mental health problem in the preceding six months** Of those who attended a mental health professional585645870The Kessler 10 (K10) was administered to obtain a measure of psychological distress. It is a 10-item st<strong>and</strong>ardised measure that has been found to have good psychometric properties <strong>and</strong> toidentify clinical levels of psychological distress as measured by the Diagnostic <strong>and</strong> StatisticalManual of Mental Disorders IV (DSM-IV)/the Structured Clinical Interview for DSM disorders(SCID, Kessler, 2002; Andrews & Slade, 2001).The minimum score of the sample was 10 (indicating no distress) <strong>and</strong> the maximum was 49(indicating very high psychological distress). The mean score of the sample was 26 (SD=9.5,median=25). The 2007 <strong>National</strong> <strong>Drug</strong> Strategy Household Survey (NDSHS) (AIHW, 2008)provided the most recent Australian population norms available for the K10, <strong>and</strong> used fourcategories to describe degree of distress: scores from 10-15 were considered to be ‘low’, 16-21 as‘moderate’, 22-29 as ‘high’ <strong>and</strong> 30-50 as ‘very high’.Table 29 shows K10 scores from the general Australian population in the 2007 NDSHS (AIHW,2008), <strong>and</strong> the 2008 <strong>and</strong> 2009 QLD IDRS interviews. As can be seen, whilst the majority in the64
NDSHS scored in the no/low distress category (69%), the majority in the 2009 IDRS samplescored in the moderate to high risk categories (26% <strong>and</strong> 34% respectively).Table 29: K10 scores in the NDSHS (2007) <strong>and</strong> the QLD IDRS interviews, 2008 <strong>and</strong> 2009K10 Score Level of psych. 2007 NDSHS (%) 2008 QLD 2009 QLDdistressIDRS (%)(N=104)IDRS (%)(N=80)10-15 No/low distress 69 24 1316-21 Moderate distress 21 25 2622-29 High distress 8 29 3430-50 Very high distress 2 21 28Source: AIHW, 2008; QLD IDRS IDU interviews, 2008-200910.7.2 Personal wellbeingFor the first time in 2009, the Personal Wellbeing Index (PWI) (International Wellbeing Group,2006) was included in the IDRS survey. Questions asked how satisfied participants were withvarious aspects of their life. These included: st<strong>and</strong>ard of living, health, personal achievement,personal relationships, personal safety, feeling a part of the community, future security, <strong>and</strong> lifeas a whole. Participants were asked to respond on a scale of 0-10 (where 0=very unsatisfied <strong>and</strong>10=very satisfied). Figure 46 shows the mean IDU sample scores compared to the Australiangeneral population.Figure 46: Mean IDU sample <strong>and</strong> Australian general population scores * on the PersonalWellbeing IndexMean score9080706050403020100IDUGeneral PopulationSource: QLD IDRS IDU interviews, 2009; Cummins et al., 2007* Note: Mean scores have been multiplied by 10, resulting in a maximum possible mean score of 10065
10.8 Other risk behaviours10.8.1 Driving risk behavioursThe proportion of participants who reported driving after alcohol <strong>and</strong> illicit drugs in thepreceding six months is presented in Table 30. Of those participants who had driven in thepreceding six months (n=52), 89% reported they had driven under the influence of illicit drugsduring that time. Based on these participants’ responses (n=46), the drugs most commonlytaken before driving were heroin (59%), cannabis (48%), morphine (33%), speed (30%), base(30%), ice (22%), <strong>and</strong> benzodiazepines (20%). The median number of times participantsreported having driven under the influence of illicit drugs was 77. The median number ofminutes participants reported having driven after taking illicit drugs was five. Seven participantsreported being drug driving tested at some point.Table 30: Driving after licit <strong>and</strong> illicit drug use in the preceding six months, 2007-20092007N=1192008N=104Driven in the last 6 months (%) 47 57 65Driven under the influence of alcohol * (%) 28 20 20Driven whilst over the legal limit^ (%) N/A N/A 50Driven soon after taking an illicit drug * (%) 87 90 89<strong>Drug</strong>s taken last time participant drug drove ** (%)HeroinCannabisMorphineMethadoneSpeed powderCrystal methamphetamine (ice)Buprenorphine-naloxoneBase methamphetamineBuprenorphineBenzodiazepinesCocaineOther opiatesOxycodoneEcstasyLSDInhalants4743157216492920000042301198864442220002009N=805948337302273011204011400Impact of illicit drug on driving ability ** (%)Quite impairedSlightly impairedNo impactSlightly improvedQuite improved62157132232660013135797Tested positive on police roadside drug-driving test last n=4 n=0 n=36 months **Source: QLD IDRS IDU interviews, 2007-2009*Among those who had driven a vehicle in the six months preceding interview^ Among those who had driven under the influence in the six months preceding interview (first asked in 2009)**Among those who had driven soon after taking a drug in six months preceding interview66
10.8.2 GamblingFor the first time in 2009, participants were asked about their gambling behaviours. Thirty-ninepercent of participants reported that they had gambled in the 30 days preceding interview. Interms of the usual forms of gambling these participants (n=31) engaged in, 77% said pokermachines, 19% said horse or dog racing, <strong>and</strong> 16% said casinos (multiple responses wereallowed). The median number of days these participants reported gambling in the preceding 30days was three (range=1-28). Thirty-nine percent reported that they had gambled their usualamount in the preceding 30 days, 29% said it was more than usual, <strong>and</strong> 32% said it was less thanusual. The median amount spent by these participants on the last occasion they gambled was$40 (with a range of $2 to $6,000).Thirty-two percent of participants who had gambled in the preceding 30 days said they had beenunder the influence of alcohol the last time they gambled (n=10), <strong>and</strong> 90% of these participantssaid that they continued to drink while they were gambling. Seventy-one percent of participantswho had gambled in the preceding 30 days said that they had been under the influence of illicitdrugs the last time they gambled (n=22). Amongst these participants, the drugs they mostcommonly reported having taken were heroin (32%), cannabis (18%), base (14%), ice (14%), <strong>and</strong>morphine (14%).Participants who reported gambling on four or more days in the last month (n=12) were alsoasked to respond to the Problem Gambling Severity Index (PGSI) (Ferris & Wynne, 2001). Thismeasure is made up of nine items <strong>and</strong> participants answer on a five-point Likert scale (where1=never <strong>and</strong> 5=always). Total PGSI scores were calculated <strong>and</strong> based on these scores; fourparticipants fell into the ‘recreational’ gambling category, five fell into the ‘low risk’ gamblingcategory, <strong>and</strong> three fell into the ‘moderate risk’ gambling category.11.8.3 AggressionThe 2009 IDRS included the Buss-Perry Aggression Questionnaire (Short Form, BPAQ-SF).This 12-item questionnaire provides a valid <strong>and</strong> reliable measure of ‘dispositional aggression’which correlates well with the original 29-item Buss-Perry Aggression Questionnaire (Bryant <strong>and</strong>Smith 2001; Buss & Perry, 1992). Participants responded by stating to what extent each itemwas ‘characteristic’ of them on a six-point Likert scale (where 1=extremely uncharacteristic <strong>and</strong>6=extremely characteristic). Each item falls onto one of four sub-scales: physical aggression,verbal aggression, hostility, <strong>and</strong> anger (i.e., each subscale is comprised of three items, has aminimum possible score of three <strong>and</strong> a maximum possible score of 18).The majority of participants (98%) responded to all items on the BAPQ-SF. The mean scoreson the physical aggression, verbal aggression, hostility, <strong>and</strong> anger subscales were: 9.87 (SD=4.81),9.99 (SD=3.62), 10.04 (SD=3.86), <strong>and</strong> 9.35 (SD=4.33) respectively. The proportion ofparticipants who endorsed one or more of the three items on each sub-scale as being at all‘characteristic’ of them were 67% for physical aggression, 76% for verbal aggression, 73% forhostility, <strong>and</strong> 61% for anger. The proportion of participants who endorsed all three items on eachsubscale as being at all ‘characteristic’ of them were 23% for physical aggression, 18% for verbalaggression, 20% for hostility, <strong>and</strong> 18% for anger.Thirty percent of participants reported that they would have answered questions on the BAPQ-SF differently had they been under the influence of a drug. When asked what drug they werethinking of 52% of these participants said methamphetamine, 22% said heroin, 17% said alcohol,<strong>and</strong> 4% said cannabis.67
11.9 Summary of health-related trendsTable 31 presents a summary of health-related trends.Table 31: Summary health-related trends associated with drug use, QLD, 2008-2009Overdose <strong>and</strong> drug-relatedharmsInjecting risk behavioursPhysical health problemsMental health problems,psychological distress, <strong>and</strong>personal wellbeing• 53% of participants reported overdosing on heroin at leastonce during their lifetime• 18% of these participants reported overdosing in the precedingyear• Two participants reported overdosing on a drug other thanheroin in the preceding yearSharing injecting equipment• 31% of sample reported lending a used needle in the precedingmonth, a significant increase from 6% in 2008• 73% of sample reported re-using their own needle in thepreceding month, a significant increase from 49% in 2008• 36% of sample reported using other injecting equipment (e.g.,spoons, mixing containers) after someone else in the precedingmonthLocation of injections• 68% nominated a private home as the usual location forinjection in the preceding month, a significant decrease from87% in 2008Injection-related problems• 64% reported scarring/bruising in the preceding month, anincrease from 46% in 2008• The drug most commonly reported as being responsible for adirty hit was heroinChronic conditions• The most commonly reported conditions were back/neck pain,liver disease, asthma, vision problems, skin problems, migraine<strong>and</strong> bronchitis.Dental health• The most commonly reported reasons for the visit to thedentist were extractions <strong>and</strong> fillings• 41% reported a mental health problem in the preceding sixmonths, most commonly depression <strong>and</strong> anxiety• Of those reporting a mental health problem, 42% had notattended a mental health professional• The majority of the IDU sample scored in the ‘high’ to ‘veryhigh’ ranges of distress on the Kessler 10 scale• On average, the IDU sample were less satisfied with all aspectsof personal wellbeing assessed on the PWI than the generalAustralian populationOther risk behaviours • 89% of sample who had driven in the preceding six monthshad driven under the influence of an illicit drug• 39% of sample had gambled in the preceding 30 days• 15% had gambled on four or more days in the precedingmonth68
11 LAW ENFORCEMENT-RELATED TRENDS ASSOCIATED WITH DRUG USE11.1 Reports of criminal activity among participantsForty-five percent of participants (n=36) reported being arrested in the 12 months precedinginterview (40% in 2008) (see Figure 47). When asked what they had been arrested for (multipleresponses were allowed), 42% of these participants said property crime, 36% said use/possessionof drugs, 25% said violent crime, 14% said a driving offence, 8% said dealing/trafficking, 8%said fraud, 8% said use/possession of weapons, 8% said breach of an apprehended violenceorder (AVO), 6% said drugs <strong>and</strong> driving, 3% said alcohol <strong>and</strong> driving, <strong>and</strong> 40% stated anotheroffence. Among these other offences were breach of a domestic violence protection order(DVO), talking on the phone whilst driving, child neglect, <strong>and</strong> wilful damage of a police vehicle.Participants were also asked to report on the types of crime they had been involved in during themonth preceding interview (see Figure 47). The most commonly reported types of crime weredealing <strong>and</strong> property crime (34% <strong>and</strong> 33% of participants respectively).Figure 47: Criminal activity in the month preceding interview <strong>and</strong> past year arrest amongparticipants, 2003-2009% Participants60504030201002003 2004 2005 2006 2007 2008 2009Source: QLD IDRS IDU interviews, 2003-2009Dealing Property crime FraudViolent crime Any crime Arrested in past year11.2 ArrestsAt the time of publication, QPS arrest data for the 2008/2009 financial year was not available.As such, the following section presents the same data that was reported in the 2008 Queensl<strong>and</strong>IDRS Report.11.2.1 HeroinFigure 48 presents the number of heroin possession/use arrests made by QPS during eachfinancial year from 1998/1999 to 2007/2008. In addition to the total number of arrests forQueensl<strong>and</strong>, Figure 48 also shows the number of arrests made in each of the three areas fromwhere IDRS participants are sampled each year. During the 1999/2000 financial year, the totalnumber of arrests increased to 211, before falling to less than a third of this number (n=63)during the 2001/2002 heroin shortage. Since 2002/2003, the number of heroin use/possessionarrests in Queensl<strong>and</strong> has remained relatively stable. During the 2007/2008 financial year, QPS69
made 73 arrests pertaining to heroin use/possession across the state. Of these, the majority(47%) occurred in the metropolitan-south region, whilst almost one-quarter occurred in thesouth-eastern region (23%) <strong>and</strong> the metropolitan-north region (22%), respectively.Figure 48: Number of heroin possession/use arrests by geographic area 1998/1999-2007/2008Number of arrests250200150100500QLD Metro North Metro South South-EasternSource: Queensl<strong>and</strong> Police ServiceNote: Changes in the number of arrests may be indicative of changes in police activity, an increase in possession/use, or acombination of both11.2.2 MethamphetamineThe number of ATS arrests made in Queensl<strong>and</strong> by QPS, from 1999/1999 to 2007/2008, isshown in Figure 49. There has been a substantial increase in the total number of ATS-relatedarrests across Queensl<strong>and</strong>, from 599 during 2001/2002 to 1,084 arrests during the 2007/2008financial year. Compared to other regions, there was a noticeable increase in the number ofarrests pertaining to ATS use/possession in the south-eastern region of Queensl<strong>and</strong>, from 101arrests during 2001/2002 to 385 during 2007/2008. However, there are two reasons why theapparent increase in ATS arrests in Queensl<strong>and</strong> is difficult to interpret: (i) QPS includeamphetamine, methamphetamine, <strong>and</strong> phenethylamines (MDMA/ecstasy) in the ATS category,<strong>and</strong> (ii) increased ATS arrests may reflect greater production, distribution <strong>and</strong> use of this drugclass, <strong>and</strong>/or may be indicative of increased operational activity focused on ATS use,manufacture, <strong>and</strong> supply.Figure 49: Number of ATS possession/use arrests by geographic area, 1998/1999-2007/2008Number of arrests150010005000QLD Metro North Metro South South-EasternSource: Queensl<strong>and</strong> Police ServiceNote: ATS includes amphetamine, methamphetamine <strong>and</strong> phenethylamines (e.g., MDMA)70
As in previous years, law enforcement KE in 2008 continued to note that methamphetamineproduction in Queensl<strong>and</strong> is typified by a large number of small-yield, cl<strong>and</strong>estine ‘box’laboratories. However, following the introduction of Project Stop across Queensl<strong>and</strong> in recentyears – an initiative targeted to reducing the supply of pseudoephedrine from pharmacies – KEnoted that there has been a shift toward greater importation of precursor chemicals fromoverseas by organised crime groups, indicating a potential move away from small ‘box’laboratories to ‘superlabs’ across the State. During 2007/2008, the number of cl<strong>and</strong>estinelaboratories detected in Queensl<strong>and</strong> remained higher than in any other Australian state, <strong>and</strong>comprised almost a third (32%) of all laboratories detected nationally (Figure 50).Figure 50: Number of cl<strong>and</strong>estine laboratories detected in Australia, Queensl<strong>and</strong>, <strong>and</strong>other states, 2007/2008Number of detections40030020010003731219569 47 325 3 1Australia QLD VIC SA NSW WA ACT NT TASSource: Queensl<strong>and</strong> Police ServiceThe number of cl<strong>and</strong>estine laboratories detected in Queensl<strong>and</strong> by QPS, from 1998 to 2008, isshown in Figure 51. Until 2005, there was a gradual increase in the number of laboratoriesdetected each year in Queensl<strong>and</strong>, reaching a peak of 212 in 2004. Since this time, however, thenumber of detections across the state has fallen, from 136 labs in 2006 to 133 labs in 2007.During 2008, the number of laboratory detections reduced again; QPS seized 124 cl<strong>and</strong>estinelaboratories, with the majority of those detected producing methamphetamine.Figure 51: Number of cl<strong>and</strong>estine laboratories detected by QLD Police, 1998-2008Number of detections25020015010094 96 93115161 166212188136 133 1245001998 1999 2000 2001 2002 2003 2004 2005 2006 2007 2008Source: Queensl<strong>and</strong> Police Service11.2.3 CocaineFigure 52 presents the number of QPS arrests for cocaine use/possession in Queensl<strong>and</strong>, bygeographic area, from 1998/1999 to 2007/2008. While the prevalence of recent cocaine use hasremained consistently low among Queensl<strong>and</strong> IDRS participants, the number of cocaine-related71
arrests has increased gradually in recent years. During the 1990/2000 financial year QPS madefour arrests pertaining to cocaine use/possession, compared to 14 arrests in 2005/2006 <strong>and</strong> 24arrests in 2006/2007. During 2007/2008, the number of cocaine use/possession arrestsincreased to a total of 29 across the state, with almost half (48%) of these arrests occurring in thesouth-eastern region of Queensl<strong>and</strong>. While the increase in cocaine-related arrests may reflect ashift in QPS operations, it is also possible that the Queensl<strong>and</strong> cocaine market is continuing togrow in size.Figure 52: Number of cocaine possession/use arrests by geographic area, 1998/19998-2007/2008Number of arrests35302520151050QLD Metro North Metro South South-EasternSource: Queensl<strong>and</strong> Police Service11.2.4 CannabisThe number of arrests for cannabis use/possession in Queensl<strong>and</strong>, from 1998/1999 to2007/2008, is shown in Figure 53. In 2001/2002, the number of arrests for the state dropped to1,964, before increasing progressively to a peak of 2,254 arrests during the 2004/2005 financialyear. There were 2,201 arrests related to cannabis use/possession in Queensl<strong>and</strong> during2006/2007, which fell to 2,105 during 2007/2008. Given that these data are inclusive of caseswhere arrestees were processed through the cannabis diversion program, recent arrest data donot necessarily reflect shifts in the prevalence of cannabis use or its distribution in Queensl<strong>and</strong>.Figure 53: Number of cannabis possession/use arrests by geographic area, 1998/1999-2007/2008Number of arrests3,0002,5002,0001,5001,0005000QLD Metro North Metro South South-EasternSource: Queensl<strong>and</strong> Police ServiceNote: Changes in the number of arrests may be indicative of changes in police activity, or an increase in possession/use, or areflection of both72
11.2.5 Other opioidsFigure 54 illustrates the number of other opioid possession/use arrests by geographic area, from1998/1999 to 2007/2008. Consistent with previous years, the number of ‘other opioid’ arrestsacross the state remained low during 2007/2008, with only five arrests occurring acrossQueensl<strong>and</strong> during the last financial year.Figure 54: Number of other opioid possession/use arrests by geographic area,1999/1999-2007/2008Number of arrests6543210QLD Metro North Metro South South-EasternSource: Queensl<strong>and</strong> Police Service11.3 Expenditure on illicit drugsFigure 55 shows the mean amount of money that Queensl<strong>and</strong> IDRS participants reportedspending on illicit drugs on the day immediately prior to interview (range=$5-$300 in 2009). Ofthe participants who reported purchasing drugs on the day before interview (n=52), 10% saidthey spent less than $20, 19% reported spending between $20 <strong>and</strong> $49, 17% between $49 <strong>and</strong>$99, 37% between $100 <strong>and</strong> $199, <strong>and</strong> 27% between $199 <strong>and</strong> $300.Figure 55: Mean amount of money spent by participants on illicit drugs on the daypreceding interview * , 2001-2009Mean AU$ spent20018016014012010080604020$162.00$140.00$140.00$120.00 $117.00 $111.00$122.00$113.00$108.002001 2002 2003 2004 2005 2006 2007 2008 2009Source: QLD IDRS IDU interviews, 2001-2009* Among those who spent money on drugs the day preceding interview73
11.4 SummaryTable 32 presents a summary of law enforcement trends associated with drug use.Table 32: Summary of law enforcement trends associated with drug use, 2009Reports of criminal activityamong participants• 45% of participants reported being arrested in thepreceding 12 months• property crime <strong>and</strong> use/possession of drugs were themost frequently reported reasons for arrestsArrests • at the time of publication, QPS arrest data for the2008/2009 financial year was not available• the relevant section presents the same data reported inthe 2008 Queensl<strong>and</strong> IDRS reportExpenditure • the average amount of money spent on illicit drugs onthe day preceding interview was $10874
12 IMPLICATIONSPatterns in the use, price, purity, <strong>and</strong> availability of heroin largely remained stable between 2008<strong>and</strong> 2009 in Queensl<strong>and</strong>. In 2009, 75% of participants reporting having used the drug in the sixmonths preceding interview (74% in 2008). The median price of a cap was stable between thetwo years at $50, as was the price of a gram at $400. The majority of participants who respondedin 2008 <strong>and</strong> 2009 (73% <strong>and</strong> 59% respectively) reported that they perceived heroin availability tohave been ‘stable’ in the six months preceding interview, <strong>and</strong> the majority in both years reportedthat the current purity of heroin was ‘medium’ or ‘low’ (25% <strong>and</strong> 49% in 2008, <strong>and</strong> 22% <strong>and</strong>43% in 2009 respectively). In spite of this apparent stability in the heroin market, in 2009 asignificantly greater proportion of the sample (25%) reported daily use of heroin in the sixmonths preceding interview (5% in 2008). It is difficult to interpret why this might be, however,particularly in light of the fact that the proportion of overlap in the IDU sample between twoconsecutive years cannot be held constant.Patterns in the use, price, <strong>and</strong> availability of methamphetamines also remained relatively stablebetween 2008 <strong>and</strong> 2009. The proportions of participants reporting use of speed, base, <strong>and</strong> ice inthe six months preceding interview in 2009 were 47%, 41%, <strong>and</strong> 47% respectively (35%, 34%,<strong>and</strong> 40% in 2008). While at face value this may appear to indicate an increase in the proportionsof participants using these methamphetamines, note that the differences in percentages between2008 <strong>and</strong> 2009 were not statistically significant. The median reported prices of speed, base <strong>and</strong>ice remained stable at $50 for a point of each <strong>and</strong> $200 for a gram (with the exception of ice,which increased from $275 in 2008 to $350 in 2009). Reports of availability also appeared toappear stable between the two years. In 2009, the majority of participants reported the currentpurity of speed to be ‘low’ or ‘fluctuating’, <strong>and</strong> the purity of base <strong>and</strong> ice to be ‘medium’ or‘high’.In terms of the injecting risk behaviours associated with injecting drug use, of some concern arethe proportions of the 2009 IDU sample who reported lending a used needle (31%), reusingtheir own needles (73%), <strong>and</strong> using other injecting equipment after someone else (36%) in themonth preceding interview. Additionally, in terms of other risk behaviours, it is concerning that89% of the sample in 2009 that had driven in the six months preceding interview had drivenunder the influence of an illicit drug at some point during that time (90% in 2008). Heroin wasmost commonly reported as one of the drugs taken the last time the participant drove under theinfluence of illicit drugs <strong>and</strong> the median length of time participants reported having driven aftertaking illicit drugs was five minutes. Increasing awareness of the risks associated both withsharing injecting equipment <strong>and</strong> driving under the influence of illicit drugs is important becauseof the harms associated with these practices.Finally, over one-third of participants (41%) in 2009 reported mental-health problems other th<strong>and</strong>rug dependence in the six months preceding interview, the most common being depression <strong>and</strong>anxiety. Only 58% of these participants, however, reported attending a mental healthprofessional during this time. In addition to this, the majority of participants scored in the ‘high’to ‘very high’ ranges of distress on the Kessler 10 scale, <strong>and</strong> on average, the IDU sample wereless satisfied with all aspects of personal wellbeing assessed on the PWI than the generalAustralia population. Given these statistics, it might be beneficial to increase awareness amongstthe IDU population that under the Australian Government’s Better Access to Mental HealthCare initiative, eligible people can generally receive 12 subsidised sessions per calendar year witha registered psychologist when referred by a general practitioner or other appropriate medicalpractitioner (Australian Psychological Society, 2010).75
REFERENCESAmerican Psychiatric Association. (1994). Diagnostic <strong>and</strong> statistical manual of mental healthdisorders (4th ed). Washington DC: American Psychiatric Association.Andrews, G., & Slade, T. (2001). Interpreting scores on the Kessler Psychological DistressScale (K10). Australian <strong>and</strong> New Zeal<strong>and</strong> Journal of Public Health, 25, 494-497.Australian Crime Commission. (2009). Illicit <strong>Drug</strong> Data Report 2007-2008. Canberra: AustralianCrime Commission.Australian Institute of Health <strong>and</strong> Welfare. (2008). 2007 <strong>National</strong> <strong>Drug</strong> Household Survey: FirstResults. Canberra: Australian Institute of Health <strong>and</strong> Welfare.Australian Psychological Society. (2010). http://www.psychology.org.au/medicare/fact_sheet/Accessed 18 th January 2010.Bryant, F. B., & Smith, B. D. (2001). Refining the architecture of aggression: A measurementmodel for the Buss-Perry Aggression Questionnaire. Journal of <strong>Research</strong> in Personality, 35,138-167.Buss, A. H., & Perry, M. (1992). The Aggression Questionnaire. Journal of Personality <strong>and</strong> SocialPsychology, 63, 452-459.Cummins, R. A., Woerner, J., Gibson, A., Lai, L., Weinberg, M., & Collard, J. (2007). AustralianUnity Wellbeing Index Survey 20 Report 20.0 October 2008. Part A: The Report. The Wellbeing ofAustralians – Money, debt <strong>and</strong> loneliness. Melbourne: Deakin University.Ferris, J., & Wynne, H. (2001). The Canadian Problem Gambling Index: Final report. Submittedto the Canadian <strong>Centre</strong> on Substance Abuse (CCSA).Fraser, S., Valentine, K., Treloar, C. & Macmillan, K. (2007). Methadone maintenance treatment inNew South Wales <strong>and</strong> Victoria: Takeaways, diversion <strong>and</strong> other key issues. Sydney: The Universityof New South Wales.International Wellbeing Group. (2006). Personal Wellbeing Index (4 th ed). Melbourne: DeakinUniversity.Kessler, R. C., Andrews, G., Colpe, L. J., Hiripi, E., Mroczek, D. K., Norm<strong>and</strong>, S. L. T., Walters,E. E., & Zaslavsky, A. M. (2002). Short screening scales to monitor populationprevalences <strong>and</strong> trends in non-specific psychological distress. Psychological Medicine, 32,959-976.Reid, G., Crofts, N. & Beyer, L. (2001). <strong>Drug</strong> Treatment Services for Ethnic Communities inVictoria, Australia: An examination of cultural <strong>and</strong> institutional barriers. Ethnicity <strong>and</strong>Health, 6, 13-26.76
Ritter, A. & Di Natale, R. (2005). The relationship between take-away methadone policies <strong>and</strong>methadone diversion <strong>Drug</strong> <strong>and</strong> <strong>Alcohol</strong> Review, 24, 347-352.Roxburgh, A., & Burns, L. (in press). <strong>Drug</strong> related hospital stays in Australia, 1993-2008. Sydney:<strong>National</strong> <strong>Drug</strong> <strong>and</strong> <strong>Alcohol</strong> <strong>Research</strong> <strong>Centre</strong>, University of New South Wales.T<strong>and</strong>berg D. (date unknown). Improved confidence intervals for the difference between two proportions<strong>and</strong> Number Needed to Treat (NNT), Version 1.49, available at:http://www.cebm.net/index.aspx?o=1023.Zerell, U., Ahrens, B. & Gerz, P. (2005). Documentation of a heroin manufacturing process inAfghanistan. Bulletin on Narcotics, LVII, 11-31.77