2012 CAFR - Encina Wastewater Authority
2012 CAFR - Encina Wastewater Authority
2012 CAFR - Encina Wastewater Authority

You also want an ePaper? Increase the reach of your titles
YUMPU automatically turns print PDFs into web optimized ePapers that Google loves.
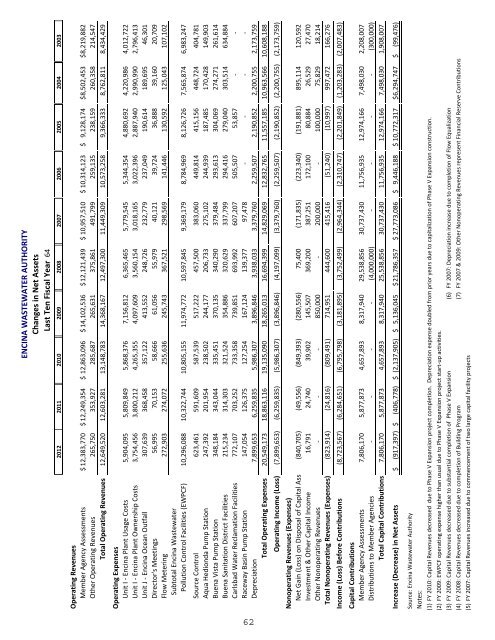
ENCINA WASTEWATER AUTHORITYChanges in Net AssetsLast Ten Fiscal Year 64<strong>2012</strong> 2011 2010 2009 2008 2007 2006 2005 2004 2003Operating RevenuesMember Agency Assessments $ 12,383,770 $ 12,249,354 $ 12,863,096 $ 14,102,536 $ 12,121,439 $ 10,957,510 $ 10,314,123 $ 9,128,174 $ 8,502,453 $ 8,219,882Other Operating Revenues 265,750 353,927 285,687 265,631 375,861 491,799 259,135 238,159 260,358 214,547Total Operating Revenues 12,649,520 12,603,281 13,148,783 14,368,167 12,497,300 11,449,309 10,573,258 9,366,333 8,762,811 8,434,429Operating ExpensesUnit I ‐ <strong>Encina</strong> Plant Usage Costs 5,904,095 5,809,849 5,868,376 7,156,812 6,365,465 5,779,545 5,344,354 4,880,692 4,220,986 4,012,722Unit I ‐ <strong>Encina</strong> Plant Ownership Costs 3,754,456 3,800,212 4,265,355 4,097,609 3,560,154 3,018,165 3,022,396 2,887,940 2,990,990 2,796,413Unit J ‐ <strong>Encina</strong> Ocean Outfall 307,639 368,458 357,122 413,552 248,726 232,779 237,049 190,614 189,695 46,301Director's Meetings 56,995 70,153 58,666 61,056 55,979 40,121 39,724 36,888 39,160 20,709Flow Metering 272,903 274,072 255,636 245,743 367,521 298,569 141,446 130,592 125,043 107,102Subtotal <strong>Encina</strong> <strong>Wastewater</strong>Pollution Control Facilities (EWPCF) 10,296,088 10,322,744 10,805,155 11,974,772 10,597,845 9,369,179 8,784,969 8,126,726 7,565,874 6,983,247Source Control 623,461 591,609 587,539 517,222 457,500 383,060 449,814 415,156 448,724 404,781Aqua Hedionda Pump Station 247,392 201,954 238,502 244,177 206,733 275,102 244,939 187,485 170,428 149,903Buena Vista Pump Station 348,184 343,044 335,451 370,135 340,290 379,484 293,613 304,069 274,271 261,614Buena Sanitation District Facilities 215,234 314,303 321,524 354,886 320,629 337,799 294,416 279,040 303,514 634,884Carlsbad Water Reclamation Facilities 772,107 703,252 733,358 739,851 693,992 607,207 505,507 53,857 ‐ ‐Raceway Basin Pump Station 147,054 126,375 127,254 167,124 139,377 97,478 ‐ ‐ ‐ ‐Depreciation 7,899,653 6,259,835 5,986,307 3,896,846 3,938,033 3,379,760 2,259,507 2,190,852 2,200,755 2,173,759Total Operating Expenses 20,549,173 18,863,116 19,135,090 18,265,013 16,694,399 14,829,069 12,832,765 11,557,185 10,963,566 10,608,188Operating Income (Loss) (7,899,653) (6,259,835) (5,986,307) (3,896,846) (4,197,099) (3,379,760) (2,259,507) (2,190,852) (2,200,755) (2,173,759)Nonoperating Revenues (Expenses)Net Gain (Loss) on Disposal of Capital Ass (840,705) (49,556) (849,393) (280,556) 75,400 (171,835) (223,340) (191,881) 895,114 120,592Investment & Other Capital Income 16,791 24,740 39,902 145,507 369,200 387,251 172,100 80,884 26,529 27,470Other Nonoperating Revenues ‐ ‐ ‐ 850,000 ‐ 200,000 ‐ 100,000 75,829 18,214Total Nonoperating Revenues (Expenses) (823,914) (24,816) (809,491) 714,951 444,600 415,416 (51,240) (10,997) 997,472 166,276Income (Loss) Before Contributions (8,723,567) (6,284,651) (6,795,798) (3,181,895) (3,752,499) (2,964,344) (2,310,747) (2,201,849) (1,203,283) (2,007,483)Capital ContributionsMember Agency Assessments 7,806,170 5,877,873 4,657,893 8,317,940 29,538,856 30,737,430 11,756,935 12,974,166 7,498,030 2,208,007Distributions to Member Agencies ‐ ‐ ‐ ‐ (4,000,000) ‐ ‐ ‐ ‐ (300,000)Total Capital Contributions 7,806,170 5,877,873 4,657,893 8,317,940 25,538,856 30,737,430 11,756,935 12,974,166 7,498,030 1,908,007Increase (Decrease) in Net Assets $ (917,397) $ (406,778) $ (2,137,905) $ 5,136,045 $ 21,786,357 $ 27,773,086 $ 9,446,188 $ 10,772,317 $ 6,294,747 $ (99,476)Source: <strong>Encina</strong> <strong>Wastewater</strong> <strong>Authority</strong>Notes:(1) FY 2010: Capital Revenues decreased due to Phase V Expansion project completion. Depreciation expense doubled from prior years due to capitalization of Phase V Expansion construction.(2) FY 2009: EWPCF operating expense higher than usual due to Phase V Expansion project start‐up activities.(3) FY 2009: Capital Revenues decreased due to substantial completion of Phase V Expansion (6) FY 2007: Depreciation increase due to completion of Flow Equalization(4) FY 2008: Capital Revenues decreased due to completion of Building Program (7) FY 2007 & 2009: Other Nonoperating Revenues represent Financial Reserve Contributions(5) FY 2007: Capital Revenues increased due to commencement of two large capital facility projects