Ageing and welfare reform in the Nordic Countries, 1990-2010 ...
Ageing and welfare reform in the Nordic Countries, 1990-2010 ...
Ageing and welfare reform in the Nordic Countries, 1990-2010 ...

Create successful ePaper yourself
Turn your PDF publications into a flip-book with our unique Google optimized e-Paper software.
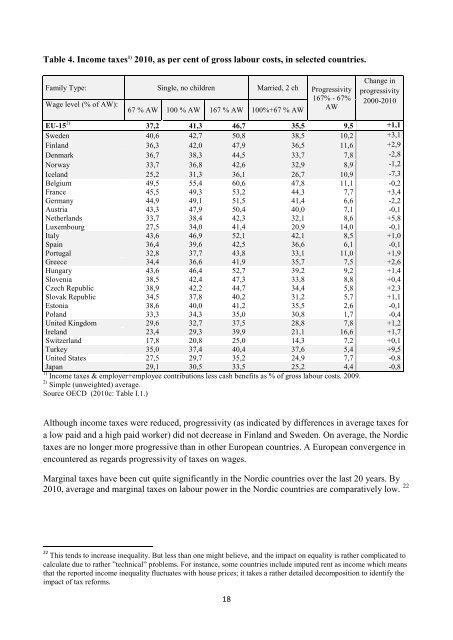
Table 4. Income taxes 1) <strong>2010</strong>, as per cent of gross labour costs, <strong>in</strong> selected countries.Family Type: S<strong>in</strong>gle, no children Married, 2 ch Progressivity167% - 67%Wage level (% of AW):67 % AW 100 % AW 167 % AW 100%+67 % AWAWChange <strong>in</strong>progressivity2000-<strong>2010</strong>EU-15 2) 37,2 41,3 46,7 35,5 9,5 +1,1Sweden 40,6 42,7 50,8 38,5 10,2 +3,1F<strong>in</strong>l<strong>and</strong> 36,3 42,0 47,9 36,5 11,6 +2,9Denmark 36,7 38,3 44,5 33,7 7,8 -2,8Norway 33,7 36,8 42,6 32,9 8,9 -1,2Icel<strong>and</strong> 25,2 31,3 36,1 26,7 10,9 -7,3Belgium 49,5 55,4 60,6 47,8 11,1 -0,2France 45,5 49,3 53,2 44,3 7,7 +3,4Germany 44,9 49,1 51,5 41,4 6,6 -2,2Austria 43,3 47,9 50,4 40,0 7,1 -0,1Ne<strong>the</strong>rl<strong>and</strong>s 33,7 38,4 42,3 32,1 8,6 +5,8Luxembourg 27,5 34,0 41,4 20,9 14,0 -0,1Italy 43,6 46,9 52,1 42,1 8,5 +1,0Spa<strong>in</strong> 36,4 39,6 42,5 36,6 6,1 -0,1Portugal 32,8 37,7 43,8 33,1 11,0 +1,9Greece 34,4 36,6 41,9 35,7 7,5 +2,6Hungary 43,6 46,4 52,7 39,2 9,2 +1,4Slovenia 38,5 42,4 47,3 33,8 8,8 +0,4Czech Republic 38,9 42,2 44,7 34,4 5,8 +2,3Slovak Republic 34,5 37,8 40,2 31,2 5,7 +1,1Estonia 38,6 40,0 41,2 35,5 2,6 -0,1Pol<strong>and</strong> 33,3 34,3 35,0 30,8 1,7 -0,4United K<strong>in</strong>gdom 29,6 32,7 37,5 28,8 7,8 +1,2Irel<strong>and</strong> 23,4 29,3 39,9 21,1 16,6 +1,7Switzerl<strong>and</strong> 17,8 20,8 25,0 14,3 7,2 +0,1Turkey 35,0 37,4 40,4 37,6 5,4 +9,5United States 27,5 29,7 35,2 24,9 7,7 -0,8Japan 29,1 30,5 33,5 25,2 4,4 -0,81) Income taxes & employer+employee contributions less cash benefits as % of gross labour costs. 2009.2) Simple (unweighted) average.Source OECD (<strong>2010</strong>c: Table I.1.)Although <strong>in</strong>come taxes were reduced, progressivity (as <strong>in</strong>dicated by differences <strong>in</strong> average taxes fora low paid <strong>and</strong> a high paid worker) did not decrease <strong>in</strong> F<strong>in</strong>l<strong>and</strong> <strong>and</strong> Sweden. On average, <strong>the</strong> <strong>Nordic</strong>taxes are no longer more progressive than <strong>in</strong> o<strong>the</strong>r European countries. A European convergence <strong>in</strong>encountered as regards progressivity of taxes on wages.Marg<strong>in</strong>al taxes have been cut quite significantly <strong>in</strong> <strong>the</strong> <strong>Nordic</strong> countries over <strong>the</strong> last 20 years. By<strong>2010</strong>, average <strong>and</strong> marg<strong>in</strong>al taxes on labour power <strong>in</strong> <strong>the</strong> <strong>Nordic</strong> countries are comparatively low. 2222 This tends to <strong>in</strong>crease <strong>in</strong>equality. But less than one might believe, <strong>and</strong> <strong>the</strong> impact on equality is ra<strong>the</strong>r complicated tocalculate due to ra<strong>the</strong>r ”technical” problems. For <strong>in</strong>stance, some countries <strong>in</strong>clude imputed rent as <strong>in</strong>come which meansthat <strong>the</strong> reported <strong>in</strong>come <strong>in</strong>equality fluctuates with house prices; it takes a ra<strong>the</strong>r detailed decomposition to identify <strong>the</strong>impact of tax <strong>reform</strong>s.18